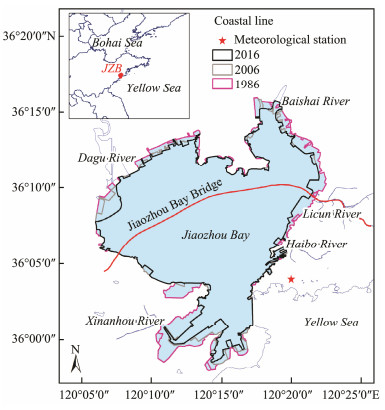
Jiaozhou Bay (JZB; 35˚38΄–36˚18΄N, 120˚04΄–120˚23΄E), which is connected to the Yellow Sea through an inlet channel to the south, is located off the Southern coast of the Shandong Peninsula, China (Fig.1). JZB is a semi-enclosed bay with a trumpet shape, whose water depth increases from northwest to southeast with an average depth of 7 m (Zhao et al., 2015). It is bounded by the seven districts of Qingdao City, with an area of 343.09 km2 (Ma et al., 2014; Song et al., 2015). JZB is characterized by low turbidity, short and weak tides, and low waves and currents (Yang et al., 2004b). Although more than 13 small rivers flow into the bay, JZB is tide-dominated (Yang et al., 2004a).
|
Fig. 1 Location of JZB, China. The red star indicates the location of the Qingdao meteorological station. |
The rapid growth of seacoast economies, including the construction of docks, aquaculture farms, bridges, and ports, has reclaimed a significant area of land from JZB. According to Ma et al. (2014), approximately 39.5% of the water area in JZB has been transformed into land during the last 150 years. For example, two islands in JZB, Hong-dao and Huangdao, have been merged with the mainland. Most of the bay's natural coastlines have been replaced by artificial infrastructures. In addition, Jiao-Zhou-Bay Bridge (JZBB), which was under construction from 2006 to 2011, now connects the east and west areas of JZB. The overall length of the bridge is 26.707 km, 97% of which is over sea water. The bridge rests on 5000 pillars, which significantly affect the hydrodynamics in JZB, especially in areas near the bridge (Zhang et al., 2015; Li et al., 2014).
As a frozen sea area with the lowest latitude in the world, JZB can experience unexpected disasters due to sea ice (Yuan et al., 2015). According to historical materials (Yuan et al., 2015; Zhang, 1986), JZB has been covered by sea ice of various extents in winter and has experienced extreme sea ice coverage in 1917, 1936, 1956, 1977, and 1980. During these periods, sea ice induced by severe weather conditions has resulted in significant losses by multiple industries, such as shipping transportation, aquaculture, and sea salt production.
Satellite remote sensing can provide a frequent and real-time view of sea ice variability on global and regional scales. Long-term optical high-resolution remote sensing images enable the identification of the spatiotemporal variability of sea ice in most latitudes. For example, Kang et al. (2014) examined the relationship between global sea ice extent and ice surface temperature using Moderate Resolution Imaging Spectroradiometer (MODIS) products. Of significant interest is the investigation of variations in sea ice in small regions, which are mostly neglected at the global scale but are important to local environments and economies (such as those in the Bohai Sea and JZB). Yuan et al. (2012) retrieved the thickness of sea ice in the Bohai Sea and constructed an index that indicates the annual amount of sea ice. Shi and Wang(2012a, b) proposed a model for estimating sea ice coverage in the Bohai Sea and analyzed the seasonal and annual variations.
In contrast to the studies noted above, little is known about sea ice in JZB. The sea ice coverage in JZB is unique because this sea ice occurs at the lowest latitude of the world ocean where the freezing of sea water in winter is observed. Due to its potential implications for the regional environment and economy, more attention should be directed to studies related to sea ice variability in JZB.In addition, previous investigations of the weather variables that may trigger sea ice variations have mostly focused on temperature-related parameters, such as surface air (Su et al., 2012; Shi and Wang, 2012b), sea ice surface temperature (Kang et al., 2014), and cumulative free-zing degree days (Zhang et al., 2016). The potential effects of winds have been less fully explored (Yuan et al., 2016; Zhang, 1986). Moreover, few studies have considered the far-reaching consequences of the establishment of artificial infrastructures, which can significantly alter the formation and distribution of sea ice.
In this paper, we describe sea ice variability in JZB, based on the spectral analysis of sea-ice with Landsat joouoc-18-2-349ry over the past 30 years. We outline the natural and artificial factors related to sea ice variability. Our overall aim is to use satellite observations to provide insight into the spatial and temporal distribution patterns of sea ice in JZB.
2 DatasetsWe used satellite data collected by Landsat in this study, which have a high spatial resolution of 30 m and a relatively long time series of over 30 years. We obtained images from the Thematic Mapper (TM), Enhanced Thematic Mapper Plus (ETM+), and Operational Land Imager (OLI) sensors from the United States Geological Survey (http://www.usgs.gov/) and the Geospatial Data Cloud (http://www.gscloud.cn/). Through visual examination, we chose 118 cloud-free images showing sea ice cover in JZB from 1986 to 2016 (Table 1). These satellite data were acquired between December and February when sea ice often emerges in JZB. For the purposes of quality control, we excluded images with no sea ice or excessive cloud cover. The winter period of each year in this study refers to the meteorological year starting from December 1 to November 30 of the succeeding year.
|
|
Table 1 Landsat images employed in the study. The column headed by 'year' indicates the meteorological year starting from December 1 to November 30 of the succeeding year |
We obtained meteorological data such as air temperature, wind speed, and wind direction recorded by the Qingdao meteorological station, which is located 2.62 km inland from JZB (red star in Fig.1), from the China Meteorological Data Sharing Service System (http://data.cma.cn/en). We acquired the in-situ water temperature from the Marine Ecosystem Research Station (http://www.jzw.cern.ac.cn/) in JZB, and collected the sea surface temperature (SST) from NASA's Ocean Color Web (https://ocean-color.gsfc.nasa.gov).
3 Methodology 3.1 Data Pre-ProcessingFirst, we performed radiometric calibration to convert the Landsat images into top-of-atmosphere radiance. Then, we used the Fast Line-of-Sight Atmospheric Analysis of Hypercube (FLAASH) module embedded in ENVI 5.2 software to atmospherically correct the calibrated radiance. With a lookup table generated by the moderate resolution atmospheric transmission-4 (MODTRAN-4) radiation transfer code, we used FLAASH to derive the atmospheric properties for each pixel in an joouoc-18-2-349. This treatment has proved to be a good solution for atmospheric correction in classification applications (Han et al., 2015). Regarding the key parameters used in the FLAASH module, we set the atmospheric model to 'Mid-Latitude Winter' and the aerosol model to 'Urban', because JZB is located nearby Qingdao City. We used a two-band (K–T) algorithm to retrieve the aerosol properties, and selected the 'initial visibility' option to be 20–40 km, depending on the quality of the examined image.
As noted above, we obtained satellite data from three different Landsat sensors. Given the different band configurations and spectral responses of these Landsat sensors (Chander et al., 2009; Han et al., 2015), the retrieval methodology established for one satellite is not directly suitable for the other two sensors. To minimize the differences in bandwidth, we used an empirical method proposed by Han et al. (2015) to adjust the surface reflectance of earlier Landsat images and thereby reduce bias with respect to the new generation of Landsat OLI data (available here on January 24, 2016).
We compared the SSTs derived from MODIS between 2003 and 2016 with those of corresponding in-situ data (5.67 ± 5.33℃) collected in the months of January, Febru-ary, November, and December 2011. A scatter plot (not shown) reveals a very good relationship between the in-situ and retrieved SSTs (R2 = 0.95, N = 21).
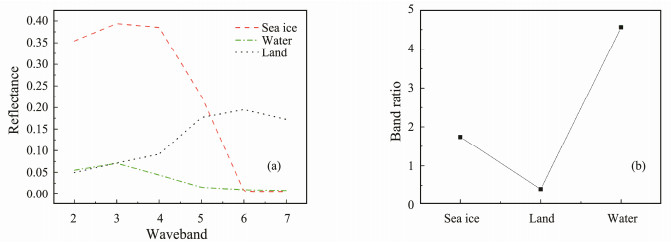
3.2 Methods for Sea Ice IdentificationAccording to early studies (Shi and Wang, 2012a; Su et al., 2013), land, seawater, and sea ice can be detected using a ratio-threshold segmentation method because their spectra show significant contrast in the red and near-infrared bands. Fig.2a shows the spectra of sea ice, seawater, and land in the OLI data. We obtained the ratio of band 3 to band 5 (Fig.2b) to identify typical features related to different surface covers. The ratio of seawater was the largest of the three subjects, followed by the ratio of sea ice and then land. Accordingly, we can derive the coverages of sea ice, seawater, and land by setting different threshold values for the corresponding surface types. As shown in the following equations, following our statistical analysis of all the images of JZB, we obtained two combinations of thresholds:
|
Fig. 2 Reflectances and ratios of sea ice, seawater, and land. |
| $ \text{Land--ice separation:}\ {R_1}{\rm{ < band }}3/{\rm{band }}5 < {R_2}, $ | (1) |
| $ \text{Ice--water separation:}\ {R_3}{\rm{ < band }}3/{\rm{band }}5 < {R_4}, $ | (2) |
where we set threshold values R1, R2, R3, and R4, to approximately 0.0, 0.9, 0.9, and 3.2, respectively. The band 3/band 5 ratio is the reflectance ratio of bands 3 and 5 of the Landsat OLI images.
The reports of previous authors (Xie et al., 2006; Ning et al., 2009; Shi and Wang, 2012a) have indicated that sea ice reflectance ranges from 0.1 to 0.4 in the visible wavelength with the peak values in the green and red wavelengths. Since the sea ice reflectance data of these previous studies qualitatively agree with those in our study, we used the above-mentioned threshold values of reflectance (Eqs. (1) and (2)) to identify the sea ice distributions in JZB.
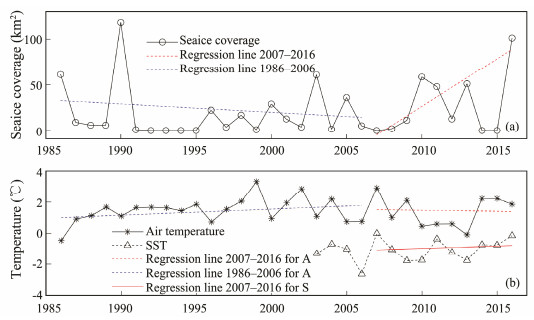
4 Results 4.1 Interannual Variability of Sea IceSea ice in JZB, a frequently observed phenomenon, is affected by atmospheric and oceanic processes, which results in significant interannual variability. We calculated the largest sea ice coverage for each winter since 1986(Fig.3a). Although JZB is not always covered by sea ice in winter, sea ice can occupy more than one-third of its sea area when a cold wave strikes. No sea ice coverage was recorded by Landsat images for 1992–1995, 2007, or 2014–2015. By contrast, the largest sea ice coverage of 118.09 km2, which accounts for approximately 34.4% of the total sea area of JZB, was observed in 1990, followed by two other extreme cases with sea ice coverages of 101.27 and 60.81 km2 in 2016 and 2003, respectively.
|
Fig. 3 Largest sea ice coverage (solid line with circles) (a), air temperature (solid line with asterisks), and SST (dashed line with triangles) (b) in winter of JZB from 1986–2016. |
We calculated the trends of sea ice coverage for different periods from 1986–2006 and 2007–2016. The largest sea ice coverage in each meteorological year experienced a slight decreasing trend (−0.91 km2 yr−1, P < 0.5) between 1986 and 2006. In comparison, the sea ice coverage trend for the 2007–2016 period was positive (10.44 km2 yr−1, P < 0.05, R2 = 0.65).
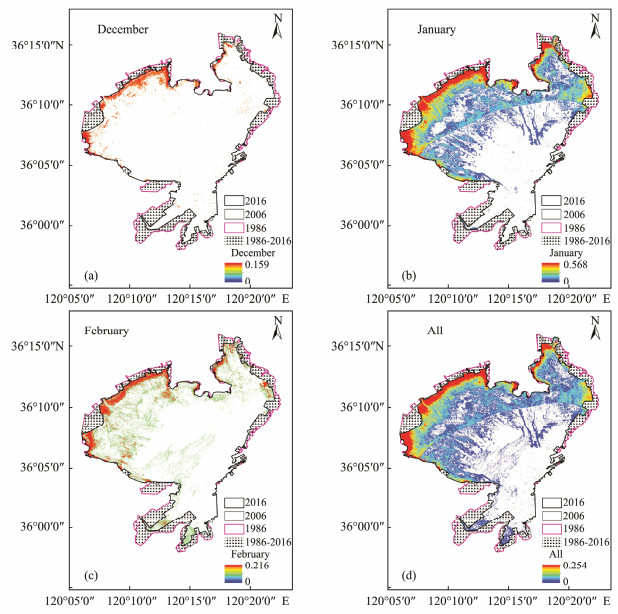
4.2 Sea Ice Spatial DistributionTo calculate the occurrence frequency of sea ice in JZB, we divided the number of images with sea ice by the number of available images in each winter month. Fig.4 shows the spatial distribution of sea ice occurrence frequency in JZB between 1986 and 2016, in which the JZB boundaries are marked by pink, gray, and black lines for 1986, 2006, and 2016, respectively. The shaded area with dots represents the extent of the shrinkage of JZB.
|
Fig. 4 Sea ice occurrence frequency based on Landsat observations between 1986 and 2016 for December (a), January (b), February (c), and all three winter months (d). The gradient of red to blue indicates variation from high to low frequency, respectively. The areas with dots indicate the area of shrinkage of JZB between 1986 and 2016; the black, gray, and pink lines indicate the JZB boundary in 2016, 2006, and 1986, respectively. |
Frequency maps (Fig.4) suggest that sea ice in JZB normally appears in December, and expands to its maximum in January, followed by a gradual decrease in February. As shown in Fig.4a, only the northwest corner of JZB has been frequently covered by sea ice in December. In comparison, sea ice expanded significantly in January (Fig.4b), from the coast to the central and southern parts of JZB. In addition, sea ice appeared to concentrate around the JZBB. In February (Fig.4c), sea ice was still frequently observed in JZB in its northwestern inshore and offshore areas. Generally, the spatial distribution of sea ice frequency in February is similar to that in December, with the sea ice remaining in the northwestern coastal area. In particular, sea ice in JZB in 1990 expanded to the central and southern areas, including Qianwan Bay and Haixi Bay. In the winter months (Fig.4d), sea ice was mostly observed from along the coast to the central bay. The occurrence of sea ice in the southern part of JZB has been infrequent.
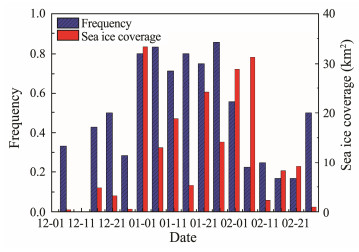
4.3 Occurrence Time of Sea IceTo analyze the temporal behavior of sea ice occurrence in JZB, we divided each winter month into 6 pentads, with the 1st–6th pentads in December, the 7th–12th pentads in January, and the 13th–18th pentads in February. Then, we divided the number of images with sea ice by the number of available images in each pentad, and calculated the sea ice frequency of each pentad, which are indicated by the shaded blue bars in Fig.5. We also determined the average sea ice coverage of each pentad, as indicated by the red bars in Fig.5.
|
Fig. 5 Sea ice frequency for each pentad in December, Jan-uary, and February between 1986 and 2016. The shaded blue bars indicate the sea ice frequency and the red bars indicate the sea ice coverage of each pentad. |
Generally, sea ice appeared during the 7th to 13th pentads (January 1 to February 5). The highest frequency occurred in the 12th pentad (January 26 to January 31), and the second highest in the 8th pentad (January 6 to January 10). Large sea ice coverage occurred between the 7th and 14th pentads (January 1 to February 10). The largest coverage of 33.37 km2 occurred in the 7th pentad (January 1 to January 5). The temporal pattern of the sea ice is similar to the results shown in Figs. 3 and 4, in which we can see that the most significant sea ice production and expansion has occurred in January.
5 Factors Affecting the Variability of Sea Ice in JZB 5.1 Surface Air Temperature and SSTWe calculated the mean surface air temperature (SAT)and SST of each winter in the JZB, the results of which are presented in Fig.3b. We can see that SAT and SST display opposite trends with respect to sea ice coverage. The SAT and SST peaks are closely aligned with the troughs of sea ice coverage, which suggests that SAT and SST are controlling factors of sea ice coverage variability in JZB. Moreover, the correlation between SAT and sea ice coverage is stronger than that between SST and sea ice coverage.
To determine the correlation between temperature and sea ice coverage, we calculated the cumulative freezing degree days (CFDD), which refers to the sum of the average daily air temperature below the freezing point for a specified period (Su and Wang, 2012; Zhang et al., 2016):
| $CFDD = \sum\limits_{{D_s}}^{{D_e}} {{T_a}, {\kern 1pt} {\kern 1pt} {\kern 1pt} {\kern 1pt} {T_a}} \leqslant {T_f},$ | (3) |
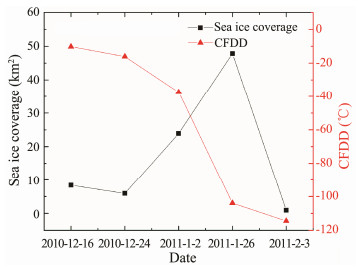
where Ta is the average daily air temperature, Tf is the freezing point, and Ds and De refer to the starting and ending dates of the specified period, respectively. We set the freezing point to −1.79℃, which corresponds to an average salinity of 30 PSU in JZB (Wang et al., 2009). In accordance with previous sea ice studies in the Bohai Sea (Su and Wang, 2012; Zhang et al., 2016), we considered the start date to be December 1 and the end date to be the end of the ice period. We could obtain just 1–7 images each winter for JZB (Table 1) because of Landsat's long revisit period and the typically cloudy conditions. Fig.6 shows the correlations between sea ice coverage and CFFD in the winter of 2011 for five satellite images.
|
Fig. 6 Sea ice coverages and CFDDs in JZB for five winter images in 2011. |
As shown in Fig.6, sea ice overage and CFDD in the winter of 2011 were negatively correlated (R = 0.33). From December 24, 2010 to January 26, 2011, a decline in CFDD coincided with an increase in sea ice coverage. The CFDD remained unchanged because the daily average temperature hovered around the freezing point (−1.79℃) on January 26, 2011, which caused a rapid decline in the ice area. This result suggests that the steady decline in CFDD facilitated the formation of sea ice, whereas equilibrium conditions favored sea ice melting. Similar phenomena were also observed for other years in the present study, and these results are consistent with the findings of recent studies (Su and Wang, 2012; Zhang et al., 2016).
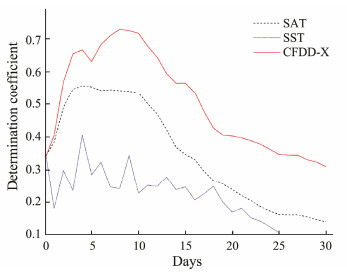
We found no robust correlation between sea ice area and CFDD because of the significant annual variations and lack of images. Therefore, the commonly used CFDD variable estimated from a fixed starting date may be an unsuitable index for predicting sea ice coverage in JZB. As a substitute, we utilized the CFDD estimated from 1 to 30 days (CFDD-X) before sea ice occurrence and investigated the correlations of sea ice coverage with SAT, SST, and CFDD-X, the results of which are presented in Fig.7.
|
Fig. 7 Determination coefficients of sea ice coverage versus SAT, SST, and CFDD-X. |
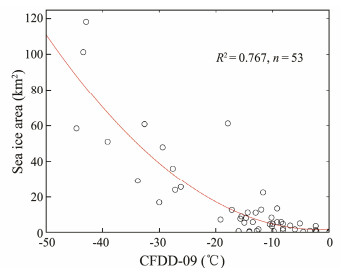
We found CFDD-X to be more strongly correlated with sea ice coverage than either SAT or SST. As shown in Fig.7, the determination coefficients were larger than 0.55 for a CFDD-X of 3 days to 15 days (CFDD-03 to CFDD-15) before sea ice occurrence. A CFDD of 16 days (CFDD-16) or more had an increasingly diminishing effect on sea ice coverage variability. In particular, a CFDD of 9 days (CFDD-09) before sea ice occurrence exhibited the most robust correlation with sea ice changes. Therefore, we derived the CFDD-09 for each satellite joouoc-18-2-349, and Fig.8 shows the corresponding scatter plot. In our analysis, we used a starting date nine days before the sea ice occurrence date and an end date of the sea ice occurrence date, and we established a correlation formula using regression analysis, as follows:
|
Fig. 8 Scatter plot of sea ice coverage versus CFDD-09. |
| $Y = 0.048{X^2}{\rm{ + }}0.194X{\rm{ + }}2.030,$ | (4) |
where Y is the predicted sea ice coverage, and X is CFDD-09, with R2 = 0.767 and P < 0.01. The obtained equation can be used to hindcast and forecast sea ice coverage in JZB.
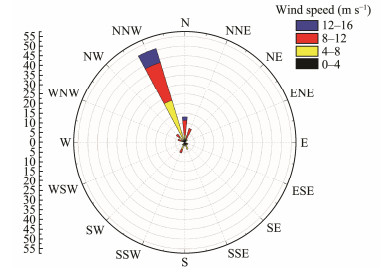
5.2 WindWinter cold snaps from the northwestern region resulted in obvious temperature drops in JZB, thereby resulting in large-scale sea ice occurrence, particularly near its northwestern coast. We examined the wind direction and speed during the periods of sea ice occurrence in JZB between 1986 and 2016, and Fig.9 presents the data. We can see that the north-northwest (NNW) winds appeared most often (accounting for 27 cases out of 53), followed by north (N) winds (7 cases) and north-northeast winds (4 cases). The wind speed varied between 3.6 m s−1 and 15.0 m s−1, and predominantly ranged between 8.0–12.0 m s−1.
|
Fig. 9 Wind frequency of sea ice occurrence in JZB between 1986 and 2016. |
Correlation analysis revealed that sea ice coverage was positively correlated with wind speed (R2 = 0.33) when the sea ice coverage was less than 2 km2. The squared correlations dropped to 0.18 and 0.21 when the sea ice coverage increased to 2–10 km2 and > 10 km2, respectively. By contrast, the correlation between sea ice coverage and CFDD-09 increased from 0.19 (for sea ice coverage < 2 km2) to 0.44 (for sea ice coverage: 2–10 km2), and 0.56 (for sea ice coverage > 10 km2). These results indicate that the NW wind caused deeper mixing and more heat loss at the sea surface during the early frozen period, which resulted in reduced temperature and increased sea ice coverage. As sea ice coverage increases, the effectiveness of wind speed is reduced, which leads to the increased role of surface air temperature in sea ice production.
5.3 Artificial FactorsAs discussed in Section 5.1, SAT and SST are key controlling factors in modulating sea ice coverage in JZB. From 1986 to 2006, we found that an increase in winter air temperature coincided with a decrease in the largest sea ice coverage in each meteorological year (Figs. 3a and 3b). However, this phenomenon has changed since 2007 due to the construction of the JZBB. The SATs and SSTs in winter hardly changed from 2007 to 2016, whereas sea ice coverage obviously increased during the same period (Fig.3a).
To ascertain the primary reason for the increased sea ice coverage in JZB, we removed extreme cases to obtain equivalent environmental conditions. For example, we eli-minated environmental parameters (air temperature, ma-ximum wind, and direction of maximum wind) beyond the scope of the mean value ± standard deviation. Thus, we found the mean sea ice coverage before and after the bridge construction to be 11.94 and 24.82 km2, respectively. The similar environmental conditions in the 1986– 2006 and 2007–2016 periods suggest that the changes in sea ice coverage were mainly due to the construction of the bridge rather than changes in air temperature or wind.
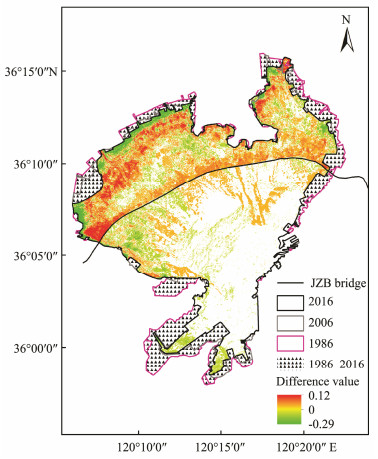
Fig.10 shows the spatial distribution of the differences in the sea ice frequency in JZB for the 1986–2006 and 2007–2016 periods, in which the red color indicates an increase in sea ice frequency and green denotes a decrease. We can see that variations in sea ice coverage mainly occurred in two subareas: the northwestern coastal and central areas of the bay along the bridge.
|
Fig. 10 Differences in sea ice frequency in JZB in the 2007–2016 (with bridge) and 1986–2006 (without bridge) periods. |
The obvious increases of sea ice frequency observed in the northern and central JZB indicates an overall increase in sea ice occurrence since bridge construction. The sea ice forms an 'ice bridge' mainly on the northern side of the JZBB, and more sea ice has appeared in this area of JZB since 2007. The simulation results of Li et al. (2014) and Zhang et al. (2015) revealed that bridge construction could cause considerable changes in the hydrodynamic environment, particularly on the northern side. Compared to the period before bridge construction, the flow velocity of JZB generally decreased by 10 cm s−1 and the overall tidal prism decreased by 1.71% after bridge construction. Moreover, after bridge construction, the number of residual current circles was reduced, and three major current circles were severely weakened (Li et al., 2014). This reported reduced water exchange has contributed to sea ice formation. The flow velocity has decreased on the northern side of the bridge, forming a weak flow area on the northern side of every pier (see Fig.11 of Li et al., 2014). Consequently, the lower flow velocity and tidal prism has favored sea ice formation on the northern side of the bridge. In addition, the sea ice frequency has significantly decreased in the northern coastal regions in JZB, indicating that more sea ice is being advected to the central area of JZB after bridge construction.
In summary, the bridge construction has significantly altered the kinetic conditions along the bridge and increased sea ice coverage in JZB. However, further in-depth analysis of the sea ice coverage variability is required once multiple platforms for remote sensing images and advanced hydrodynamic simulation become available.
6 DiscussionIn this study, by analyzing the observations of multiple Landsat satellites, we characterized for the first time the spatiotemporal changes in the sea ice in JZB over the past 30 years. However, there may be residual errors in the surface reflectance values despite our use of a sophisticated atmospheric correction method (Kaufman et al., 1997). Fortunately, the dense forest area near JZB provides dark pixels to improve the accuracy of the atmospheric correction (Kaufman et al., 1997; Han et al., 2015). In addition, utilizing the empirical line correction method proposed by Han et al. (2015), we adjusted the reflectance of different images to the same level as that in the OLI joouoc-18-2-349 in 2016. In this way, we compensated for any atmospheric correction errors and reduced the uncertainties of classification.
Ideally, to consider the daily sea ice changes, the sea ice of JZB should be studied with higher temporal resolution data than Landsat images. However, given its high spatial resolution (30 m) and long data record (> 30 years), Landsat provides the most comprehensive dataset of the long-term sea ice changes in JZB. In view of the JZB's small area and the coarse spatial resolution of other satellite data (such as 1 km and 250 m for MODIS and 500 m for GOCI), Landsat images can be used to effectively identify subtle sea ice changes in JZB. MODIS and GOCI data became available in 2000 and 2010, respectively, so they cannot be used to capture the characteristics of sea ice variability over several decades in JZB. By contrast, Landsat data have been recorded for more than 30 years and thereby provide a long-term record of the sea ice variations in the JZB.
Given its revisit period of 16 days, Landsat cannot provide the beginning date of sea ice formation each year. However, the derived CFDD-09 shows a fairly good correlation with sea ice coverage variations (R2 > 0.76). Overall, the Landsat images captured the approximate temporal variations of sea ice in JZB. More reliable results can be obtained by the use of satellite data with higher spatial and temporal resolutions and from different platforms.
7 ConclusionsIn this paper, we examined the temporal-spatial distribution and variation of sea ice in JZB from 1986 to 2016 using Landsat TM/ETM+ and OLI joouoc-18-2-349ry. We retrieved the sea ice coverage using a ratio-threshold segmentation method, and analyzed the interannual variability, spatial distribution, and occurrence time of sea ice in JZB. We outlined the main controlling factors of sea ice formation and variation, and discussed meteorological and artificial factors. The main conclusions are summarized as follows:
1) Sea ice coverage in JZB has undergone significant interannual variations. The largest sea ice coverage occurred in 1990, followed by 2016 and 2003. In terms of the largest sea ice coverage, a slight decrease occurred between 1986 and 2006, whereas an obvious increase trend has occurred since 2007.
2) The spatial distribution of sea ice frequency shows an intensive accumulation of sea ice along the shore, particularly along the northwestern coast of JZB. Over the study period, the sea ice in JZB expanded significantly in January, particularly from January 1 to February 5.
3) SAT, SST, and wind are vital factors causing changes in the sea ice coverage in JZB. We found sea ice coverage to be most strongly correlated with CFDD-09 (R2 > 0.76). This correlation can be used to retrieve the sea ice coverage in JZB. NNW wind has dominated the ice-formation period of JZB. Although we found the maximum wind speed to be strongly correlated with sea ice coverage, its impact progressively diminishes as the sea ice spreads out.
4) An artificial factor explains the gradual increase in the sea ice coverage since 2007. After the construction of the cross-bay bridge, the sea ice frequency has obviously increased in the northern and central areas of JZB. The bridge construction altered the kinetic conditions in the bay. Our results suggest that the smaller flow velocity and tidal prism has contributed to the formation of an ice bridge along the bridge, which promotes the accumulation and congestion of sea ice around the central area of JZB.
AcknowledgementsThis study is funded by the Shandong Provincial Natural Science Foundation, China (No. ZR2016DB23), the National Natural Science Foundation of China (Nos. 41706194, 41601408), and the Scientific Research Foundation of Shandong University of Science and Technology for Recruited Talents. We would like to thank the following data providers. Landsat products were provided by the United States Geological Survey (USGS) and the Geospatial Data Cloud, meteorological data were obtained from the China Meteorological Data Sharing Service System (CMDC) and the Jiaozhou Bay Marine Ecosystem Research Station.
Chander, G., Markham, B. L. and Helder, D. L., 2009. Summary of current radiometric calibration coefficients for Landsat MSS, TM, ETM+, EO-1 ALI sensors. Remote Sensing of Environment, 113: 893-903. DOI:10.1016/j.rse.2009.01.007 (  0) 0) |
Han, X., Chen, X. and Feng, L., 2015. Four decades of winterwetland changes in Poyang Lake based on Landsat observations between 1973 and 2013. Remote Sensing of Environment, 156: 426-437. DOI:10.1016/j.rse.2014.10.003 (  0) 0) |
Kang, D., Im, J., Lee, M. I. and Quackenbush, L. J., 2014. The MODIS ice surface temperature product as an indicator of sea ice minimum over the Arctic Ocean. Remote Sensing of Environment, 152: 99-108. DOI:10.1016/j.rse.2014.05.012 (  0) 0) |
Kaufman, Y., Tanré, D., Remer, L. A., Vermote, E., Chu, A. and Holben, B., 1997. Operational remote sensing of tropospheric aerosol over land from EOS moderate resolution imaging spectroradiometer. Journal of Geophysical Research -Atmo-spheres, 102: 17051-17067. DOI:10.1029/96JD03988 (  0) 0) |
Li, P., Li, G., Qiao, L., Chen, X., Shi, J., Gao, F., Wang, N. and Yue, S., 2014. Modeling the tidal dynamic changes induced by the bridge in Jiaozhou Bay, Qingdao, China. Continental Shelf Research, 84: 43-53. DOI:10.1016/j.csr.2014.05.006 (  0) 0) |
Ma, L. J., Yang, X. G., Qi, Y. L., Liu, Y. X. and Zhang, J. Z., 2014. Oceanic area change and contributing factor of Jiao-zhou Bay. Scientia Geographica Sinica, 34: 365-369 (in Chinese with English abstract). (  0) 0) |
Ning, L., Xie, F., Gu, W., Xu, Y., Huang, S., Yuan, S., Cui, W. and Levy, J., 2009. Using remote sensing to estimate sea ice thickness in the Bohai Sea, China based on ice type. International Journal of Remote Sensing, 30(17): 4539-4552. DOI:10.1080/01431160802592542 (  0) 0) |
Shi, W. and Wang, M., 2012a. Sea ice properties in the Bohai Sea measured by MODIS-Aqua: 1. Satellite algorithm development. Jounal of Marine Systems, 95: 32-40. DOI:10.1016/j.jmarsys.2012.01.012 (  0) 0) |
Shi, W. and Wang, M., 2012b. Sea ice properties in the Bohai Sea measured by MODIS-Aqua: 2. Study of sea ice seasonal and interannual variability. Jounal of Marine Systems, 95: 41-49. DOI:10.1016/j.jmarsys.2012.01.010 (  0) 0) |
Song, Z., Gong, L., Chen, Q., Gu, Z., Gao, L. and Huang, H., 2015. Influence on the environment of the coastal area in Jiao-zhou Bay of China. Environmental Engineering and Management Journal, 14(8): 1897-1903. DOI:10.30638/eemj.2015.202 (  0) 0) |
Su, H. and Wang, Y., 2012. Using MODIS data to estimate sea ice thickness in the Bohai Sea (China) in the 2009-2010 winter. Journal of Geophysical Research, 117. (  0) 0) |
Su, H., Wang, Y. and Yang, J., 2012. Monitoring the spatiotemporal evolution of sea ice in the Bohai Sea in the 2009-2010 winter combining MODIS and meteorological data. Estuaries and Coasts, 35: 281-291. DOI:10.1007/s12237-011-9425-3 (  0) 0) |
Su, H., Wang, Y., Xiao, J. and Li, L., 2013. Improving MODIS sea ice detectability using gray level co-occurrence matrix texture analysis method: A case study in the Bohai Sea. ISPRS Journal of Photogrammetry and Remote Sensing, 85: 13-20. DOI:10.1016/j.isprsjprs.2013.07.010 (  0) 0) |
Wang, X., Liu, X., Liang, S. and Shi, X., 2009. The effect of brine discharged from desalination plant on the distribution of the salinity in the Jiaozhou Bay. Acta Oceanologica Sinica, 31(1): 44-51 (in Chinese with English abstract). (  0) 0) |
Xie, F., Gu, W., Ha, S., Cui, W., Chen, W., Zhou, C., Huang, S. and Liu, Z., 2006. An experimental study on the spectral characteristics of one year-old sea ice in the Bohai Sea, China. International Journal of Remote Sensing, 27(14): 3057-3063. DOI:10.1080/01431160600589153 (  0) 0) |
Yang, D., Gao, Z., Chen, V., Wang, P. and Sun, P., 2004a. Influence of seawater temperature on phytoplankton growth in Jiaozhou Bay, China. Chinese Journal of Oceanology and Limnology, 2: 165-175. (  0) 0) |
Yang, S., Meng, Y. and Zhang, J., 2004b. Suspended particulate matter in Jiaozhou Bay: Properties and variations in response to hydrodynamics and pollution. Chinese Science Bulletin, 49(1): 91-97. DOI:10.1007/BF02901748 (  0) 0) |
Yuan, B., Cong, C., Shang, J. and Li, K., 2015. The research of sea ice in Jiaozhou Bay and its prevention countermeasures. Ocean Development and Management, 8: 35-38 (in Chinese with English abstract). (  0) 0) |
Yuan, S., Gu, W., Xu, Y., Wang, P., Huang, S., Le, Z. and Cong, J., 2012. The estimate of sea ice resources quantity in the Bohai Sea based on NOAA/AVHRR data. Acta Oceanologica Sinica, 31(1): 33-40. DOI:10.1007/s13131-012-0173-4 (  0) 0) |
Yuan, Y., Song, D., Wu, W., Liang, S., Wang, Y. and Ren, Z., 2016. The impact of anthropogenic activities on marine environment in Jiaozhou Bay, Qingdao, China: A review and a case study. Regional Studies in Marine Science, 8: 287-296. DOI:10.1016/j.rsma.2016.01.004 (  0) 0) |
Zhang, N., Wu, Y. and Zhang, Q., 2016. Forecasting the evolution of the sea ice in the Liaodong Bay using meteorological data. Cold Regions Science and Technology, 125: 21-30. DOI:10.1016/j.coldregions.2016.01.007 (  0) 0) |
Zhang, Q., 1986. The relationship between Bohai sea ice and its meteorological conditions. Marine Forecast, 3(1): 49-54 (in Chinese with English abstract). (  0) 0) |
Zhang, W., Chi, W., Hu, Z., Liu, J. and Zhang, Y., 2015. Numerical study on the effect of the Jiaozhou Bay bridge construction on the hydrodynamic conditions in the surrounding sea area. Coastal Engineering, 34(2): 40-50. (  0) 0) |
Zhao, K., Qiao, L., Shi, J., He, S., Li, G. and Yin, P., 2015. Evolution of sedimentary dynamic environment in the western Jiaozhou Bay, Qingdao, China in the last 30 years. Estuarine, Coastal and Shelf Science, 163: 244-253. DOI:10.1016/j.ecss.2014.12.011 (  0) 0) |
 2019, Vol. 18


