
Discovery of pyridomycin derivatives as InhA inhibitors from actinomycetes through molecular networking and an In-House tandem mass library

Abstract
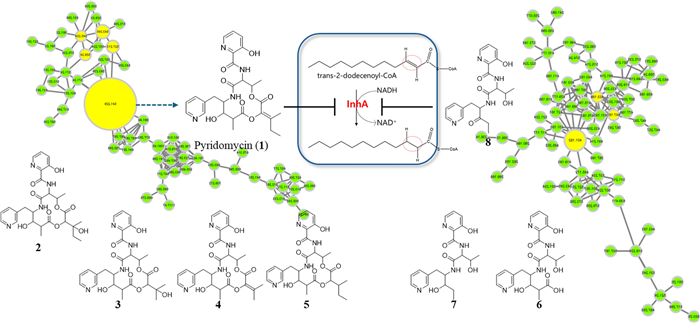
A screen of ~ 4000 actinomycetes strains identified Streptomyces sp. W3009 as a producer of the antituberculosis agent pyridomycin. Using a mass spectrometry-based metabolomics approach coupled with molecular networking, we identified seven pyridomycin derivatives, six of which were novel. Three of these novel compounds were linear, featuring a unique 3-hydroxypicolinic acid–L-threonine–3-(3-pyridyl)-L-alanine (3HP–T–3PA) scaffold. Their structures were elucidated via detailed NMR studies. While two cyclic derivatives (4 and 5) showed modest antitubercular activity, the three linear derivatives, despite possessing the key 3HP–T–3PA moiety, exhibited no inhibitory activity. This intensive MS-based approach demonstrates the important role of such techniques in the discovery of novel biologically active core structures and their natural derivatives.Graphical Abstract
Keywords
Tandem mass library Pyridomycin InhA inhibitor Antituberculosis agent Streptomyces1 Introduction
Mycobacterium tuberculosis, the causative agent of tuberculosis (TB), remains a leading cause of mortality worldwide, particularly in developing countries [1]. The emergence of resistance to multiple antibiotics has made TB increasingly difficult to control. Given the severity of the disease and the rising drug resistance, identifying new therapeutic solutions is imperative [2, 3]. Actinomycetes have long been recognized as prolific sources of antibiotics and are considered key producers of metabolites with anti-TB activity. Since the discovery of streptomycin from Streptomyces griseus, several actinomycete-derived anti-TB agents, such as rifamycins, capreomycin, and kanamycin, have been developed [4]. The global health crisis posed by the emergence of multidrug-resistant (MDR) and extensively drug-resistant (XDR) M. tuberculosis strains highlights the urgent need for novel TB agents. Integrating multidisciplinary approaches with modern technologies-especially focusing on underexplored actinomycete strains using targeted and integrative discovery platforms-offers a promising route toward the discovery of novel anti-TB compounds [5, 6].
Among known actinomycete-derived compounds, pyridomycin has garnered significant interest due to its potent and selective activity against M. tuberculosis. Produced by Streptomyces pyridomyceticus and Dactylosporangium fulvum, pyridomycin functions as a direct inhibitor of InhA, an enoyl-acyl carrier protein reductase essential for mycolic acid biosynthesis-one of the most well-validated targets in TB drug development [7–10]. Unlike isoniazid (INH) and ethionamide (ETH), which require activation by bacterial enzymes (KatG and EthA, respectively) to form NAD+ adducts that inhibit InhA, pyridomycin directly binds to the NADH-binding site of InhA. This mechanism provides a promising strategy to circumvent resistance pathways associated with prodrug activation [11–14].
Despite the promise of actinomycete-derived metabolites, their isolation and structural characterization remain challenging. The chemical complexity of microbial secondary metabolites often complicates their identification, and conventional bioactivity-guided fractionation methods are time-consuming and may overlook low-abundance, yet bioactive, compounds. Furthermore, the annotation of unknown metabolites in complex mixtures remains a major challenge in natural products research, particularly when isolation and purification are not feasible [15]. Recent advances in metabolomics, especially tandem mass spectrometry (MS/MS)-based molecular networking (MN), have greatly enhanced the capacity to explore microbial chemical diversity. Platforms such as the Global Natural Products Social Molecular Networking (GNPS) allow researchers to visualize relationships among metabolites, prioritize strains, and dereplicate known compounds based on shared fragmentation patterns [16–19]. However, effective use of such platforms can be limited by differences in analytical instrumentation, sample complexity, and experimental conditions [20]. These limitations reduce the reliability of cross-platform spectral matching and highlight the need for complementary in-house spectral libraries built from authentic reference compounds [21, 22].
To address these challenges and facilitate the discovery of new TB compounds, we implemented a comprehensive strategy combining metabolite profiling, GNPS-based molecular networking, and custom in-house MS/MS spectral databases (Fig. 1, S1, and S2). Through the screening of approximately 4000 actinomycete strains, we identified Streptomyces sp. W3009 as a new producer of pyridomycin (1). In addition to pyridomycin, seven structurally related derivatives were isolated, including three previously unreported linear analogs and four cyclized derivatives. All eight compounds shared a conserved 3-hydroxypicolinic acid–L-threonine–3-(3-pyridyl)-L-alanine (3HP–T–3PA) moiety but differed in the structure of their 3-methylpentanoic acid side chain. To evaluate their therapeutic potential, all eight compounds (1‒8) were tested for inhibitory activity against M. tuberculosis H37Rv expressing GFP (H37Rv-GFP) [23]. Pyridomycin (1) showed an MIC of 1.08 µM against H37Rv-GFP, while only compounds 4 and 5 exhibited MIC values of 6.9 and 9.14 µM against H37Rv-GFP, respectively. Importantly, the three linear derivatives, despite possessing the 3HP–T–3PA moiety, exhibited no inhibitory activity.
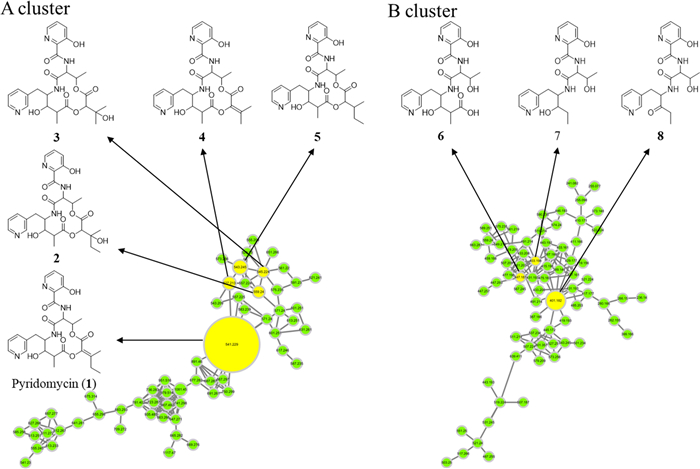
Molecular networking analysis of Streptomyces sp. W3009 extract. The molecular network is automatically classified by MolNetEnhancer. A The NAP analysis matched the structure of the representative node in Cluster A, which is identified as pyridomycin. B The candidate structure by in silico fragment analysis using Massfrontier 7.0 in Cluster B
2 Results
2.1 Targeted identification of pyridomycin derivatives from Streptomyces sp. W3009 via tandem mass analysis
To identify pyridomycin-producing strains, we employed a targeted tandem mass spectrometry (MS/MS) approach using Mass Frontier 7.0 software. Among approximately 4000 crude extracts derived from our in-house actinomycete culture collection, we identified the Streptomyces sp. W3009 extract, which exhibited more than 99% fragmentation similarity to authentic pyridomycin. The high-performance liquid chromatography (HPLC) and total ion current (TIC) chromatogram revealed a major peak eluting at 10.19 min (Fig. S1).
As previously reported, pyridomycin inhibits InhA through a unique mechanism by simultaneously occupying the NADH cofactor and lipid substrate-binding sites [24]. Specifically, the 3-hydroxypicolinic acid–L-threonine–3-(3-pyridyl)-L-alanine (3HP–T–3PA) moiety of pyridomycin interacts within the NADH and substrate-binding pocket of InhA [24]. The fragmentation pattern of pyridomycin, determined using the 'Fragments and Mechanisms' function in Mass Frontier 7.0, included characteristic fragments at m/z 429, 411, 373, and 207 corresponding to the 3HP–T–3PA moiety (Fig. S2 and S3). These fragments were reliably detected under optimized collision energy conditions (Fig. S4). Under these optimized analytical conditions, we applied molecular networking and in silico fragmentation analyses to the culture extract of the pyridomycin-producing strain Streptomyces sp. W3009 (Fig. 1).
Under these optimized conditions, LC-HRMS/MS data from Streptomyces sp. W3009 extract were analyzed via GNPS-based molecular networking and Network Annotation Propagation (NAP). Cluster A, classified as peptide-related by MolNetEnhancer (light green), included nodes that matched hybrid peptide–polyketide compounds. The major node, with the same molecular weight and fragmentation pattern as authentic pyridomycin, confirmed its identity (Fig. 2). Additional nodes within this cluster, showing characteristic fragment ions (m/z 429, 420, and 411), were indicative of pyridomycin derivatives (compounds 2–5), highlighted in yellow (Fig. 1).
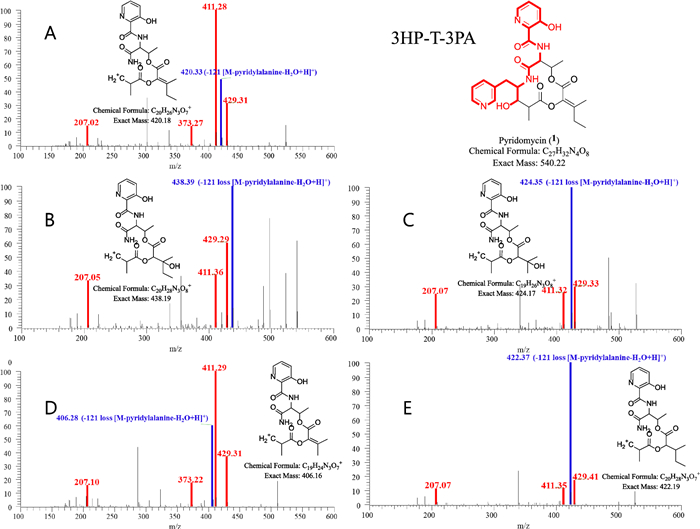
MS/MS spectra of pyridomycin and its derivatives annotated in the representative node in Cluster A. The red peak represents an MS2 fragment containing the entire 3-hydroxypicolinic acid‒L-threonine‒3-(3-pyridyl)-L-alanine (3HP–T–3PA) moiety, while the blue peak represents a fragment lacking the 3PA residue. In pyridomycin, the red peaks at m/z 207, 373, 411, and 429 confirm the intact 3HP–T–3PA moiety. The blue peak at m/z 420 indicates the loss of 3PA (121 Da) (A). In compounds 2–5, blue peaks at m/z 438, 424, 406 and 422 respectively show the absence of 3-PA, with predicted structures presented in panels B–E. These spectra reveal consistent fragmentation patterns that highlight the structural differences among the compounds
2.2 Discovery of linear pyridomycin derivatives via molecular networking
Unlike cluster A, cluster B was not merged in GNPS analysis but was also classified as peptide-related by MolNetEnhancer. A node in cluster B with a parent ion at m/z 447 displayed fragment ions at m/z 429 and 411, suggesting a shorter pyridomycin analog (compound 6, MW 446 Da) that retained the 3HP–T–3PA moiety. Two additional nodes at m/z 401 and 403, with characteristic fragments at m/z 178 and 223 in their MS/MS spectra, were identified (Figs. 1 and 3), leading to the discovery of two more derivatives (compounds 7 and 8; Fig. 3). Therefore, nodes within cluster B represented unusual linear pyridomycin derivatives that retained the essential 3HP–T–3PA moiety. By aligning retention times from the molecular networking analysis with peaks observed in the TIC chromatograms, we selectively targeted and isolated these derivatives for further characterization.
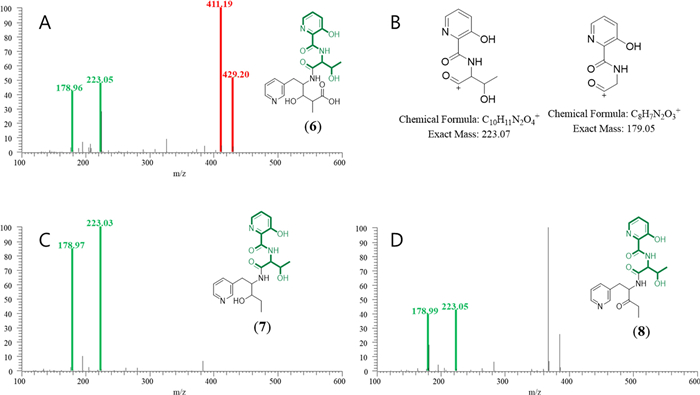
MS/MS spectra of linear pyridomycins annotated in the representative node in Cluster B. The MS2 spectrum of compound 6 features red peaks at m/z 411 and 429, consistent with the presence of the 3HP–T–3PA moiety (A). Green peaks (m/z 178 and 223) are attributed to fragment ions excluding the 3PA residue from the 3HP–T–3PA moiety (C & D). The expected structures of these ions are illustrated in panel (B)
2.3 Isolation and structural elucidation of pyridomycin derivatives
Guided by molecular networking, pyridomycin (1) and seven structurally related derivatives (2–8) were successfully isolated as white powders (Fig. 4 and Table 1). Compound 1 was confirmed as pyridomycin based on its molecular formula, MS/MS fragmentation pattern, and comparison of its NMR data with those previously reported and authentic compound [9, 25].
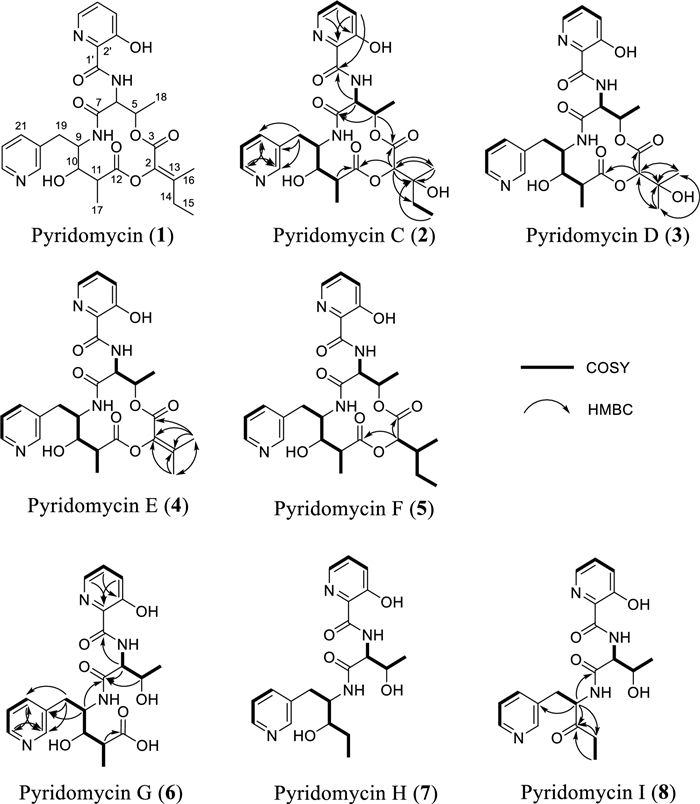
Structure and key correlation 2D NMR of isolated pyridomycin (1) and its derivatives (2‒8) from Streptomyces sp. W3009
NMR data for pyridomycin and its derivatives (1‒8) in methanol-d4
Pyridomycin C (2) exhibited a molecular formula C27H34N4O9, determined by high-resolution electrospray ionization mass spectrometry (HRESIMS). Its NMR spectra were highly similar to those of 1, with characteristic signals corresponding to four methyl groups (δH/C 0.97/6.5 (H-15), 1.27/21.5 (H-16), 1.34/13.8 (H-17), and 1.47/16.5 (H-18)), four oxygenated or nitrogenated methines (δH/C 4.67/53.6 (H-6), 4.29/55.7 (H-9), 4.78/78.4 (H-2), and 5.40/68.7 (H-5)), two distinct pyridine rings (δH/C 8.44/147.1 (H-21), 7.75/126.3 (H-22), 8.55/139.4 (H-23), 8.77/142.5 (H-25), 7.43/126.3 (H-4′), 7.54/129.4 (H-5′), and 8.18/139.8 (H-6′), and several aliphatic multiplets. However, the olefinic side-chain signals observed in 1 at C-2 were absent in 2. Instead, signals at δH/C 4.78/78.4 and δC 72.3 suggested the presence of an oxygenated methine and quaternary carbon, respectively. HMBC correlations from H-2 (δH 4.78) to C-13 (δC 72.3), C-14 (δC 30.9), C-16 (δC 21.5), and C-3 (δC 166.4), and C-12 (δC 176.7) supported a modified side-chain containing a tertiary alcohol carbon. ROESY spectra confirmed that the relative configuration of 2 was consistent with 1, except for the configurations at C-2 and C-13, which remained ambiguous. The absolute configuration at C-13 was determined using Mosher's ester derivatives prepared with (R)- and (S)-MPA, establishing the C-13S configuration based on Δδ [δ(R)—δ(S)] values (Fig. 5).
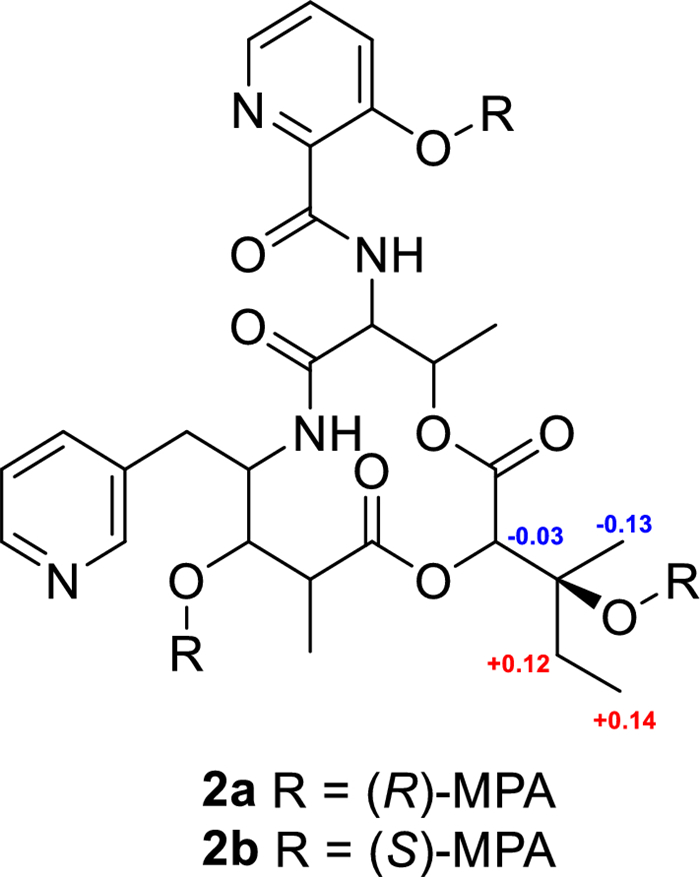
Modified Mosher's ester analysis of pyridomycin C (2)
Pyridomycin D (3) possessed the molecular formula C26H32N4O9. Its 1H and 13C NMR spectra closely resembled those of 2, with the key difference being the disappearance of the methylene signals at C-14 in compound 2 (δH/C 1.69 and 1.62/30.9), which were replaced by a methyl signal (δH/C 1.34/24.8) corresponding to a 3-hydroxy-3-methylbutanoic acid side chain in compound 3.
Pyridomycin E (4) exhibited a molecular formula C26H30N4O8, and its NMR spectra were similar to those of 1. However, compound 4 exhibited a modified side chain structure at the C-2 position. In compound 1, the C-2 side chain consists of an ethyl group (-CH2CH3) attached at C-13, whereas in compound 4, the chain terminates with a singlet methyl group at C-14 (δH/C 2.26/18.4), indicating a truncated side chain.
Pyridomycin F (5) displayed structural features consistent with a previously reported synthetic analog (compound 28d and 28e) described by Kienle et al. [26]. This compound shares the core structure with compound 2 but lacks the hydroxyl group at the C-13 position.
Pyridomycin G (6) was obtained as a white amorphous solid. The HRESIMS spectrum showed a pseudomolecular ion at m/z [M + H]+ consistent with the molecular formula C21H26N4O7, which requires 11 degrees of unsaturation. Comparative NMR and MS analyses confirmed that, similar to 1, 6 retains the characteristic pyridomycin backbone composed of 3-hydroxypicolinic acid, L-threonine, 3-(3-pyridyl)-L-alanine, and propionic acid units. The key difference is the absence of the 3-methylpent-2-enoic acid moiety observed in 1, resulting in a truncated open-chain structure in 6. In particular, the unprotected oxymethine resonance observed at C-5 (δC 68.5) and the carboxyl signal observed at C-12 (δC 179.2) support the presence of a hydroxylated methine and a terminal carboxyl functional group, respectively. These results confirm that 6 is a linear analog of pyridomycin without a terminal unsaturated acyl substituent.
Pyridomycin H (7) was obtained as a white amorphous solid. The HRESIMS spectrum displayed a pseudomolecular ion consistent with the molecular formula C20H26N4O5, corresponding to 10 degrees of unsaturation. The NMR spectral data of 7 closely resembled those of 6, indicating that both compounds share the same pyridomycin-derived core framework. The principal structural difference was observed at the terminal region of the side chain. In 6, a carboxyl resonance was present at C-12 (δC 179.2), whereas in 7 this carboxyl group was absent. Furthermore, C-11 in 7 resonated at δC 28.3, confirming its identity as a methylene group rather than a carboxyl-bearing carbon. These differences establish 7 as the decarboxylated analogue of 6, retaining the linear backbone but lacking the C-12 carboxyl substituent.
Pyridomycin I (8) was isolated as a white amorphous solid. The HRESIMS spectrum established its molecular formula as C20H24N4O5, requiring 11 degrees of unsaturation. The overall NMR spectral profile of 8 was highly similar to that of 7, suggesting a close structural relationship. The key difference was localized at C-10. In 7, C-10 (δH/C 3.63/75.2) appeared as an oxymethine, indicative of a hydroxylated methine carbon. In contrast, in 8 these resonances were replaced by a strongly deshielded carbonyl carbon at (δC 207.7), confirming oxidation of C-10 to a ketone functionality. Accordingly, 8 was defined as the C-10 oxidized analogue of 7.
2.4 Proposed biosynthetic pathway of the isolated pyridomycin derivatives
Pyridomycin (1) is a cyclodepsipeptide assembled via a hybrid nonribosomal peptide synthetase/polyketide synthase (NRPS/PKS) system (Fig. S5) [25, 27, 28]. Its 12-membered core ring comprises four structural units: 3-hydroxypicolinyl-L-threonine, 3-(3-pyridyl)-L-alanine, propionic acid, and 2-hydroxy-3-methylpent-2-enoic acid (the latter being a tautomeric form of α-keto-β-methylvaleric acid). Pyrdiomycin E (4) probably uses α-keto-valeric acid derived from leucine, whereas pyridomycin (1) uses α-keto-β-methylvaleric acid derived from isoleucine. This is presumed to be attributed to the relaxed substrate specificity of the terminal NRPS (NRPS4) [28]. Pyridomycin C (2) and D (3) may be derived from the hydration process of the C2-C13 enoyl group of 1 and 4, respectively. In contrast, linear derivatives (6–8) are proposed to be biosynthetic intermediates resulting from premature termination between the PKS and NRPS4 modules. These intermediates may undergo β-keto group at C-10 reduction catalyzed by the 3-oxoacyl ACP reductase (Pyr2), yielding hydroxylated products [27].
2.5 Anti-TB activity of pyridomycin (1) and its derivatives (2–8)
Pyridomycin (1) previously demonstrated minimum inhibitory concentrations (MIC) of 0.31–0.63 µg/mL against M. tuberculosis H37Rv and 0.62–1.25 µg/mL against M. smegmatis mc2155 [11]. Here, we evaluated the anti-TB activities of pyridomycin (1) and its derivatives (2–8) against M. tuberculosis H37Rv expressing GFP (H37Rv-GFP) [23]. The MIC of pyridomycin 1 was 1.08 µM against H37Rv-GFP, while only compounds 4 and 5 showed MIC values of 6.9 and 9.14 µM against H37Rv-GFP, respectively. Accordingly, the cyclic pyridomycin derivatives 4 and 5 exhibited approximately seven- and ninefold lower anti-TB activities compared to pyridomycin (1), respectively (Table 2 and Fig. S6). This finding is consistent with previous results indicating that the C2 = C13 double bond in pyridomycin (1) provides better anti-TB activity than the C2–C13 single bond found in derivative 5. Interestingly, new cyclic derivatives 2 and 3, which contain a hydroxyl group at the C-13 position, showed no significant anti-TB activity within our measurement range. This result contrasts with the previously reported structure–activity relationship for synthetic derivatives with lipophilic C13 substituents [26].
Comparison of MICs of pyridomycin (1) and its derivatives (2‒8) against H37Rv-GFP
3 Discussion
In recent years, MS/MS molecular networking has significantly accelerated the identification of natural products from complex mixtures such as crude extracts [15–19]. One factor contributing to its appeal is its accessibility through the web-based, open-source platform GNPS [16]. However, the reliability of spectral libraries is influenced by various factors, including the instrument type, compound concentration, sample composition, experimental conditions, and instrument performance. The tandem mass spectrum of a compound can vary based on these parameters, leading to differences in identification rates. To address the limitations of open-source databases, we utilized powerful algorithms and a broadly curated in-house database containing spectral and fragmentation data.
The Streptomyces sp. W3009 strain, which produces the potent anti-TB agent pyridomycin, was selected through LC–MS-guided screening of our in-house actinomycete library. The analysis revealed unknown derivatives exhibiting characteristic fragment ions (m/z 429, 420, and 411), which were presumed to involve a substitution at the C2 position of pyridomycin (Fig. 2). Additionally, a major node in Cluster B, with a parent ion at m/z 447 (compound 6, MW 446 Da), displayed fragment ions at m/z 429 and 411, confirming the retention of the 3HP–T–3PA moiety in pyridomycin node in Cluster A (Fig. 3). Two additional nodes in Cluster B were also identified that shared key MS/MS fragments (m/z 178 and 223) with compound 6 (Fig. 3). Consequently, the linear pyridomycin derivatives (6–8) isolated from nodes within Cluster B were confirmed to retain the essential 3HP–T–3PA moiety. These results demonstrate that the isolation of derivatives based solely on simple GNPS data have limitations in distinguishing between compounds with the same or similar core structural skeletons.
As summarized by the MIC values in Table 2, several pyridomycin derivatives (1, 4, and 5) showed anti-TB activity, whereas the linear derivatives (6–8) exhibited no activity. However, we screened the linear derivatives (6–8) for inhibitory activity against the M. tuberculosis InhA enzyme, which catalyzes NADH uptake, using His-tagged wild-type InhA and its pyridomycin-resistant mutant form, InhA(D148G) (Fig. S7). Notably, compound 8 showed better inhibitory activity against the InhA(D148G) mutant (86.2%) compared to pyridomycin (1) (77.7%) (Fig. S8 and S9). Despite this potent inhibition of InhA, none of the linear pyridomycin derivatives, including compound 8, showed anti-TB activity (Table 2). The absence of anti-TB activity in these linear compounds, which all share the 3HP–T–3PA moiety known to bind to the substrate and NADH binding sites of InhA [11, 24, 29], suggests that their inhibitory effect on the enzyme is insufficient to translate into a biological effect on the bacteria. The reason for this disconnects is not yet clear, but possible explanations include decreased cell membrane permeability or reduced in vivo stability. It is a well-established principle that linear peptide compounds often have limited biological efficacy due to issues with cell membrane permeability or reduced in vivo stability [30]. Future studies utilizing combinatorial biosynthesis and medicinal chemistry strategies are warranted to improve the stability, solubility, and biological activity of these linear pyridomycin.
4 Conclusion
Seven pyridomycin derivatives were isolated from Streptomyces sp. W3009 using a mass spectrometry-based metabolomics approach coupled with molecular networking. All isolated compounds contained a conserved 3HP–T–3PA moiety. The cyclic derivatives (2–5) varied in their 3-methylpentanoic acid side chain components compared to pyridomycin (1). However, only two cyclic derivatives (4 and 5) showed moderate efficacy against M. tuberculosis H37Rv compared to pyridomycin (1). Conversely, the linear derivatives (6–8), despite sharing the 3HP–T–3PA moiety and exhibiting expected InhA enzyme inhibitory activity, demonstrated no anti-TB activity.
5 Materials and methods
5.1 General experimental procedures
Optical rotations were measured using a JASCO P-1020 polarimeter. UV spectra were recorded on an Optizen 2120 UV spectrophotometer. Melting points were measured on an Electrothermal 9100 instrument without correction. NMR experiments were performed on a Bruker AVANCE HD 800 MHz NMR spectrometer (Bruker, Germany) at the Korea Basic Science Institute (KBSI) in Ochang, Korea. NMR spectra were recorded in CD3OD-d4. Column chromatography was performed on reversed phase silica gel (0.075 mm; Cosmosil, Japan). Analytical (Waters Sunfire, 5 μm, 4.6 × 150 mm) and semi-preparative (Waters Atlantis T3, 5 μm, 10 × 250 mm) C18 columns were used for reverse-phase HPLC on a 515 pump HPLC system (Waters) equipped with a 2996 PDA detector (Waters), using HPLC-grade solvents (Honeywell). Liquid chromatography-mass spectrometry (LC–MS) was performed using an LTQ XL linear ion trap (ThermoFisher Scientific, Rockford, IL, USA) equipped with an electrospray ionization (ESI) source coupled to a Rapid Separation LC (RSLC; Ultimate 3000, ThermoFisher Scientific) system (ESI-LC–MS). HR-ESI–MS and UPLC-MS/MS analyses were performed using an Orbitrap Exploris 120 mass spectrometer coupled with a Vanquish UHPLC system (ThermoFisher Scientific, USA).
5.2 Construction of In-House tandem mass spectral library
An in-house library of tandem mass spectral and fragmentation tree data was constructed using Mass Frontier 7.0 (ThermoFisher Scientific) (Fig S1). The program modules used were Chromatogram Processor and Database Manager. Mass Frontier software was then employed to interpret MS/MS spectrum by assigning structures to the fragment ions automatically. Experimental MS/MS spectra were imported and peaks were annotated either manually or using automated structure-assignment tools. Subsequently, in silico fragmentation predictions were generated and cross-validated against the experimental spectra. Annotated spectra, along with relevant metadata such as source organism, extraction method, and retention time, were systematically archived in the database.
5.3 LC–MS/MS-based molecular networking analysis
LC–MS/MS data were acquired using a Vanquish UHPLC-Orbitrap Exploris 120 system under the following conditions. Chromatographic separation was conducted at 30 ℃ using a YMC Triart C18 column (100 × 2.1 mm, 1.9 μm) with a flow rate of 0.3 mL/min. The mobile phase consisted of solvent A (water + 0.1% formic acid) and solvent B (acetonitrile + 0.1% formic acid), delivered in a linear gradient from 10 to 100% B over 10 min. Mass detection was carried out within the m/z range of 200–2000 at a resolution of 60,000 for full MS scans and 15,000 for data-dependent MS/MS (MS2) scans. Mass spectrometry parameters were optimized as follows: spray voltage, 3.5 kV (positive mode) and 2.5 kV (negative mode); ion transfer tube temperature, 320 ℃; heated electrospray ionization (HESI) probe temperature, 275 ℃; RF lens level, 70%. Ultrapure nitrogen (> 99.99%) was used as sheath and auxiliary gases at flow rates of 50 and 15 arbitrary units, respectively. Fragmentation was achieved using normalized higher-energy collisional dissociation (HCD) at 30%. The four most intense ions from each full MS spectrum were selected for data-dependent MS/MS fragmentation. Dynamic exclusion was set at 2.5 s to prevent repeated fragmentation of ions.
The resulting MS/MS spectra were uploaded to the GNPS platform (http://gnps.ucsd.edu) for classical molecular networking [16]. Additionally, in silico analyses were performed using the Network Annotation Propagation (NAP) tool within GNPS, applying parameters of 5 ppm mass tolerance, selection of the top 10 candidate structures, and database searches against GNPS and Natural Products Atlas (NPAtlas). Results from classical molecular networking and NAP analyses were integrated using the MolNetEnhancer module accessed through the "Advanced Views-Experimental Views" option in the GNPS interface [31–33]. After completion of these analyses, network files were exported to Cytoscape 3.9.1 [34], and structures were visualized using the ChemViz2 plugin.
5.4 Culture, extraction, and isolation
Approximately 4000 crude extracts of actinomycete culture broths from our in-house library were screened to identify strains producing pyridomycin. Streptomyces sp. W3009 was selected and cultured in yeast extract-maltose-glucose (YMG) broth at 28 ℃ with shaking at 165 rpm using baffled Erlenmeyer flasks. The cultured broth (10 L) was extracted three times using an equal volume of ethyl acetate (EtOAc). The combined EtOAc extracts were concentrated under reduced pressure to yield 3.1 g of crude extract. The crude extract was fractionated using a CombiFlash RF MPLC system (Teledyne ISCO) equipped with a Redisep RF C18 column (43 g) employing a stepwise gradient of MeOH–H2O (20:80, 30:70, 40:60, 60:40, 80:20 to 100:0; 200 mL per step). The bioactive fractions (fractions 4–7, eluted with 80% MeOH, 220.5 mg) were further purified by reversed-phase HPLC (Atlantis T3 C18, 5 μm, 10 × 250 mm) using a linear gradient of 40–80% acetonitrile in water (with 0.05% formic acid) at a flow rate of 3 mL/min. This purification afforded eight compounds: pyridomycin (1, 35.7 mg, tR 9.5 min), 2 (2.7 mg, tR 10.5 min), 3 (3.7 mg, tR 11.5 min), 4 (1.8 mg, tR 8.0 min), 5 (2.2 mg, tR 8.5 min), 6 (15.1 mg, tR 5.5 min), 7 (1.7 mg, tR 6.5 min), and 8 (15.1 mg, tR 6.3 min).
Pyridomycin (1). White powder; [α]25D -13.9 (c 0.1, MeOH); UV (MeOH) λmax (log ε) 222 (45,000), 264 (18,000), 304 (19,000), 354 (9000); mp 231–233 ℃; 1H and 13C NMR data, Table 1; HRESIMS m/z 541.2289 [M + H]+ (calculated for C27H33N4O8, 541.2293).
Pyridomycin C (2). White powder; [α]25D + 13.7 (c 0.1, MeOH); UV (MeOH) λmax (log ε) 222 (45,000), 264 (18,000), 304 (19,000), 354 (9000); mp 231–233 ℃; 1H and 13C NMR data, Table 1; HRESIMS m/z 559.2401 [M + H]+ (calculated for C27H35N4O9, 559.2399).
Pyridomycin D (3). White powder; [α]25D + 6.2 (c 0.1, MeOH); UV (MeOH) λmax (log ε) 222 (44,000), 264 (18,000), 304 (19,000), 354 (9000); mp 231–233 ℃; 1H and 13C NMR data, Table 1; m/z 545.2238 [M + H]+ (calculated for C26H33N4O9, 545.2242).
Pyridomycin E (4). White powder; [α]25D + 29.5 (c 0.1, MeOH); UV (MeOH) λmax (log ε) 222 (46,000), 264 (17,000), 304 (20,000), 360 (8000); mp 231–233 ℃; 1H and 13C NMR data, Table 1; m/z 527.2135 [M + H]+ (calculated for C26H31N4O8, 527.2136).
Pyridomycin F (5). White powder; [α]25D + 26.2 (c 0.1, MeOH); UV (MeOH) λmax (log ε) 222 (45,000), 264 (15,000), 304 (20,000), 356 (9000); mp 231–233 ℃; 1H and 13C NMR data, Table 1; HRESIMS m/z 543.2445 [M + H]+ (calculated for C27H35N4O8, 543.2449).
Pyridomycin G (6). White powder; [α]25D -48.1 (c 0.1, MeOH); UV (MeOH) λmax (log ε) 226 (26,000), 262 (19,000), 304 (19,000), 352 (7000); mp 231–233 ℃; 1H and 13C NMR data, Table 1; m/z 447.1874 [M + H]+ (calculated for C21H27N4O7, 447.1874).
Pyridomycin H (7). White powder; [α]25D -36.2 (c 0.1, MeOH); UV (MeOH) λmax (log ε) 226 (25,000), 264 (18,000), 304 (19,000), 354 (9000); mp 231–233 ℃; 1H and 13C NMR data, Table 1; m/z 403.1978 [M + H]+ (calculated for C20H27N4O5, 403.1976).
Pyridomycin I (8). White powder; [α]25D -32.3 (c 0.1, MeOH); UV (MeOH) λmax (log ε) 226 (25,000), 262 (21,000), 304 (19,000), 352 (10,000); mp 231–233 ℃; 1H and 13C NMR data, Table 1; m/z 401.1818 [M + H]+ (calculated for C20H25N4O5, 401.1819).
5.5 Mosher's ester derivatization
Compound 2 (3.0 mg) was divided equally into two portions, each dissolved in 0.4 mL of anhydrous CH2Cl2. To each solution, N,N′-dicyclohexylcarbodiimide (DCC, 4.6 mg in 0.2 mL anhydrous CH2Cl2) and 4-dimethylaminopyridine (DMAP, 1.9 mg in 0.2 mL anhydrous CH2Cl2) were added. After stirring the solutions for 5 min, either (R)- or (S)-α-methoxyphenylacetic acid (MPA, 2.6 mg in 0.2 mL anhydrous CH2Cl2) was introduced. Each reaction mixture was stirred at room temperature for 24 h. Reaction progress was monitored by LC–MS, showing formation of the desired derivatives (ESIMS m/z 1003.38 [M + H]+). The reactions were quenched by addition of 50 μL of H2O. The resulting Mosher's esters, 2a (0.6 mg, tR 45.5 min) and 2b (0.7 mg, tR 43.4 min) were purified by reversed-phase HPLC using an Atlantis T3 C18 column under gradient conditions (70–90% CH3CN/H2O, flow rate 3 mL/min).
R-MPA ester of compound 2 (2a): 1H NMR (DMSO-d6, 700 MHz) δH 7.49−7.38 (15H, m, aromatic), 4.86 (1H, s, H-2), 3.86 (3H, s, OMe), 3.50 (3H, s, OMe), 3.46 (3H, s, OMe), 3.45 (3H, s, OMe), 1.98 (1H, br s), 1.94 (1H, br s), 1.92 (1H, m), 1.83 (2H, m, H-14), 1.60 (2H, m), 1.31−1.22 (12H, m), 1.37 (3H, s, H-16), 1.19 (3H, t, J = 7.2 Hz, H-15).
S-MPA ester of compound 2 (2b): 1H NMR (DMSO-d6, 700 MHz) δH 7.51−7.42 (15H, m, aromatic), 4.89 (1H, s, H-2), 3.95 (3H, s, OMe), 3.49 (3H, s, OMe), 3.48 (3H, s, OMe), 3.45 (3H, s, OMe), 1.98 (1H, br s), 1.95 (1H, br s), 1.85 (1H, m), 1.71 (2H, m, H-14), 1.55−1.41 (4H, m), 1.50 (3H, s, H-16), 1.05 (3H, t, J = 7.3 Hz, H-15) 1.16−1.02 (8H, m).
5.6 Anti-TB assay with M. tuberculosis H37Rv-GFP
The recombinant M. tuberculosis strain H37Rv expressing green fluorescent protein (H37Rv-GFP), which carries an integrative plasmid harboring the constitutively expressed gfp gene under the pBlaF promoter, was cultured at 37 ℃ in Middlebrook 7H9 broth (Difco) supplemented with 10% OADC, 0.05% Tween 80, and 0.5% glycerol for 1 weeks [23]. The culture was then diluted in fresh medium to an OD600 of 0.1 and incubated for an additional week under the same conditions. Bacteria were harvested at early log-phase by centrifugation at 3000 × g for 10 min, washed twice with PBS, and resuspended in fresh medium. For the assay, bacterial suspensions (5 × 10⁵ CFU/mL, OD600 = 0.03) were dispensed into 384-well plates using an automated dispenser (Wellmate, ThermoFisher). Test compounds were added to a final volume of 50 μL, maintaining 1% DMSO. Plates were incubated at 37 ℃ with 5% CO2 for 5 days. Fluorescence intensity (Ex. 480 nm, Em. 530 nm) was measured using a plate reader (Nivo, Perkin Elmer). Relative fluorescence units (RFU) were normalized against plate-specific positive (1 mg/mL rifampin, Euromedex) and negative (1% DMSO) controls. Compounds exhibiting less than 50% bacterial growth inhibition at the highest concentration (20 μM) were classified as inactive (Fig. S6).
Notes
Acknowledgements
This work was supported by the National Research Foundation (RS-2024-00398073 and RS-2024-00440614), the National Research Council of Science & Technology grant (CAP23013-000), and the KRIBB Research Initiative Program (KGM1272511) funded by the MSIT of the Republic of Korea. We thank the Korea Basic Science Institute, Ochang, Korea, for providing the NMR (700 MHz) and HRESIMS data.
Author contributions
B.L., G.J.H., and J-P.J. contributed equally. The manuscript was written through contributions of all authors. All authors have given approval to the final version of the manuscript.
Data availability
Data will be made available on request.
Declarations
Competing interests
The authors declare no competing financial interest.
References
-
1.de Almeida LLC, Fernandes SP, de Oliveira GD, et al. Harnessing actinobacteria secondary metabolites for tuberculosis drug discovery: historical trends, current status and future outlooks. Nat Prod Bioprospect. 2025;15: 52. CrossRef PubMed Google Scholar
-
2.Dong M, Pfeiffer B, Altmann KH. Recent developments in natural product-based drug discovery for tuberculosis. Drug Discov Today. 2017;22(3): 585-91. CrossRef PubMed Google Scholar
-
3.Zumla A, George A, Sharma V, Herbert RH. Baroness Masham of, I.; Oxley, A.; Oliver, M. The WHO 2014 global tuberculosis report–further to go. Lancet Glob Health. 2015;3: e10-12. PubMed Google Scholar
-
4.Janin YL. Antituberculosis drugs: ten years of research. Bioorg Med Chem. 2007;15: 2479-513. CrossRef PubMed Google Scholar
-
5.Grzelak EM, Hwang C, Cai G, Nam JW, Choules MP, Gao W, et al. Bioautography with TLC-MS/NMR for rapid discovery of anti-tuberculosis lead compounds from natural sources. ACS Infect Dis. 2016;2: 294-301. CrossRef PubMed Google Scholar
-
6.Hussain A, Hassan QP, Shouche YS. New approaches for antituberculosis leads from Actinobacteria. Drug Discov Today. 2020;25: 2335-42. CrossRef PubMed Google Scholar
-
7.Banerjee A, Dubnau E, Quemard A, Balasubramanian V, Um KS, Wilson T, et al. inhA, a gene encoding a target for isoniazid and ethionamide in Mycobacterium tuberculosis. Science. 1994;263: 227-30. CrossRef PubMed Google Scholar
-
8.Vilcheze C, Wang F, Arai M, Hazbon MH, Colangeli R, Kremer L, et al. Transfer of a point mutation in Mycobacterium tuberculosis inhA resolves the target of isoniazid. Nat Med. 2006;12: 1027-9. CrossRef PubMed Google Scholar
-
9.Maeda K, Kosaka H, Okami Y, Umezawa H. A new antibiotic, pyridomycin. J Antibiot. 1953;6: 140. PubMed Google Scholar
-
10.Shomura T, Amano S, Yoshida J, Kojima M. Dactylosporangium fulvum sp. nov. Int J Syst Evol Microbiol. 1986;36: 166-9. PubMed Google Scholar
-
11.Hartkoorn RC, Sala C, Neres J, Pojer F, Magnet S, Mukherjee R, et al. Towards a new tuberculosis drug: pyridomycin-nature's isoniazid. EMBO Mol Med. 2012;4: 1032-42. CrossRef PubMed Google Scholar
-
12.Vilcheze C, Jacobs WR, Jr. Resistance to isoniazid and ethionamide in Mycobacterium tuberculosis: Genes, mutations, and causalities. Microbiol Spectr. 2014;2: MGM2–0014-2013. PubMed Google Scholar
-
13.Rozman K, Sosic I, Fernandez R, Young RJ, Mendoza A, Gobec S, et al. A new 'golden age' for the antitubercular target InhA. Drug Discov Today. 2017;22: 492-502. CrossRef PubMed Google Scholar
-
14.Wright GD. Back to the future: a new 'old' lead for tuberculosis. EMBO Mol Med. 2012;4: 1029-31. CrossRef PubMed Google Scholar
-
15.Luo Y, Cobb RE, Zhao H. Recent advances in natural product discovery. Curr Opin Biotechnol. 2014;30: 230-7. CrossRef PubMed Google Scholar
-
16.Wang M, Carver JJ, Phelan VV, Sanchez LM, Garg N, Peng Y, et al. Sharing and community curation of mass spectrometry data with global natural products social molecular networking. Nat Biotechnol. 2016;34: 828-37. CrossRef PubMed Google Scholar
-
17.Forner D, Berrue F, Correa H, Duncan K, Kerr RG. Chemical dereplication of marine actinomycetes by liquid chromatography-high resolution mass spectrometry profiling and statistical analysis. Anal Chim Acta. 2013;805: 70-9. CrossRef PubMed Google Scholar
-
18.Yang JY, Sanchez LM, Rath CM, Liu X, Boudreau PD, Bruns N, et al. Molecular networking as a dereplication strategy. J Nat Prod. 2013;76: 1686-99. CrossRef PubMed Google Scholar
-
19.Lee B, Son S, Lee JK, Jang M, Heo KT, Ko SK, et al. Isolation of new streptimidone derivatives, glutarimide antibiotics from Streptomyces sp. W3002 using LC-MS-guided screening. J Antibiot. 2020;73: 184-8. CrossRef PubMed Google Scholar
-
20.Hoang C, Uritboonthai W, Hoang L, Billings EM, Aisporna A, Nia FA, et al. Tandem mass spectrometry across platforms. Anal Chem. 2024;96: 5478-88. CrossRef PubMed Google Scholar
-
21.Bocker S. Searching molecular structure databases using tandem MS data: are we there yet? Curr Opin Chem Biol. 2017;36: 1-6. CrossRef PubMed Google Scholar
-
22.Clark TN, Houriet J, Vidar WS, Kellogg JJ, Todd DA, Cech NB, et al. Interlaboratory comparison of untargeted mass spectrometry data uncovers underlying causes for variability. J Nat Prod. 2021;84: 824-35. CrossRef PubMed Google Scholar
-
23.Christophe T, Jackson M, Jeon HK, Fenistein D, Contreras-Dominguez M, Kim J, et al. High content screening identifies decaprenyl-phosphoribose 2' epimerase as a target for intracellular antimycobacterial inhibitors. PLoS Pathog. 2009;5: e1000645. CrossRef PubMed Google Scholar
-
24.Hartkoorn RC, Pojer F, Read JA, Gingell H, Neres J, Horlacher OP, et al. Pyridomycin bridges the NADH- and substrate-binding pockets of the enoyl reductase InhA. Nat Chem Biol. 2014;10: 96-8. CrossRef PubMed Google Scholar
-
25.Huang T, Wang Y, Yin J, Du Y, Tao M, Xu, et al. Identification and characterization of the pyridomycin biosynthetic gene cluster of Streptomyces pyridomyceticus NRRL B-2517. J Biol Chem. 2011;286: 20648-57. CrossRef PubMed Google Scholar
-
26.Kienle M, Eisenring P, Stoessel B, Horlacher OP, Hasler S, van Colen G, et al. Synthesis and structure-activity relationship studies of C2-modified analogs of the antimycobacterial natural product pyridomycin. J Med Chem. 2020;63: 1105-31. CrossRef PubMed Google Scholar
-
27.Huang T, Zhou Z, Wei M, Chen L, Xiao Z, Deng Z, et al. Characterization of pyridomycin B reveals the formation of functional groups in antimycobacterial pyridomycin. Appl Environ Microbiol. 2022;88: e0203521. CrossRef PubMed Google Scholar
-
28.Huang T, Li L, Brock NL, Deng Z, Lin S. Functional characterization of PyrG, an unusual nonribosomal peptide synthetase module from the pyridomycin biosynthetic pathway. ChemBioChem. 2016;17: 1421-5. CrossRef PubMed Google Scholar
-
29.Hartkoorn RC, Pojer F, Read JA, Gingell H, Neres J, Horlacher OP, et al. Pyridomycin bridges the NADH- and substrate-binding pockets of the enoyl reductase InhA. Nat Chem Biol. 2014;10(2): 96-8. CrossRef PubMed Google Scholar
-
30.Lamers C. Overcoming the shortcomings of peptide-based therapeutics. Future Drug Discov. 2022;4: FDD75. CrossRef PubMed Google Scholar
-
31.da Silva RR, Wang M, Nothias LF, van der Hooft JJ, Caraballo-Rodriguez AM, Fox E, et al. Propagating annotations of molecular networks using in silico fragmentation. PLoS Comput Biol. 2018;14: e1006089. CrossRef PubMed Google Scholar
-
32.Ernst M, Kang KB, Caraballo-Rodriguez AM, Nothias LF, Wandy J, Chen C, et al. MolNetEnhancer: enhanced molecular networks by integrating metabolome mining and annotation tools. Metabolites. 2019;9: 144. CrossRef PubMed Google Scholar
-
33.Nothias LF, Petras D, Schmid R, Duhrkop K, Rainer J, Sarvepalli A, et al. Feature-based molecular networking in the GNPS analysis environment. Nat Methods. 2020;17: 905-8. CrossRef PubMed Google Scholar
-
34.Shannon P, Markiel A, Ozier O, Baliga NS, Wang JT, Ramage D, et al. Cytoscape: a software environment for integrated models of biomolecular interaction networks. Genome Res. 2003;13: 2498-504. CrossRef PubMed Google Scholar
Copyright information
© The Author(s) 2026
Open Access This article is licensed under a Creative Commons Attribution 4.0 International License, which permits use, sharing, adaptation, distribution and reproduction in any medium or format, as long as you give appropriate credit to the original author(s) and the source, provide a link to the Creative Commons licence, and indicate if changes were made. The images or other third party material in this article are included in the article's Creative Commons licence, unless indicated otherwise in a credit line to the material. If material is not included in the article's Creative Commons licence and your intended use is not permitted by statutory regulation or exceeds the permitted use, you will need to obtain permission directly from the copyright holder. To view a copy of this licence, visit http://creativecommons.org/licenses/by/4.0/.