
Xylanins A–P, sixteen new guaiane-type dimers from the branches and leaves of Xylopia vielana with anti-proliferative activity against PANC-1 cell line
Abstract
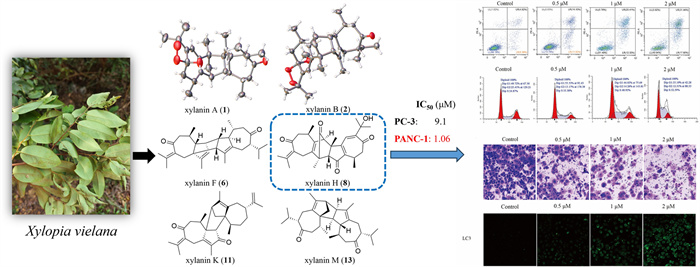
Sixteen previously undiscovered guaiane-type sesquiterpene dimers, xylanins A–P (1–16), along with six known analogues (17–22), were isolated from the branches and leaves of Xylopia vielana with chromatographic techniques. Their structures including absolute configurations were determined by high-resolution electrospray ionization mass spectrometry (HR-ESI–MS), nuclear magnetic resonance (NMR) data, electron circular dichroism (ECD) spectra, as well as X-ray crystallographic analysis. In cytotoxicity test, we found that five compounds (6, 7, 8, 9 and 12) had cytotoxic activities in vitro against the human pancreatic cancer (PANC-1) and human prostate cancer (PC-3) cell lines. Of these compounds, compound 8 showed a relatively greater cytotoxic effect against PANC-1 cell lines with half maximal inhibitory concentration (IC50) value of 1.06 μM. Flow cytometry analysis showed that the apoptosis rate of PANC-1 cells increased with increasing concentrations of compound 8, and also demonstrated that the cell cycle of PANC-1 cells was arrested at S phase by the treatment of compound 8. By the invasion test, compound 8 was found to restrain the invasion of PANC-1 cells. In autophagy assay, we observed increased microtubule-associated protein 1 light chain 3 (LC3) by immunofluorescence in the compound 8-treated group.Graphical Abstract
Keywords
Structural identification Sesquiterpenes Xylopia vielana branches and leaves Anti-proliferative activity1 Introduction
Xylopia vielana, belonging to the genus Xylopia (Annonaceae), produced in southern Guangxi, Vietnam and Cambodia. So far, there are about 73 compounds, including sesquiterpene dimers and alkaloids with anti-inflammatory, antitumor and multidrug resistance reversal activities, found in X. vielana [1–13]. In order to understand the chemical substances of X. vielana and enrich the compound library of this genus, the chemical constituents of the branches and leaves of X. vielana were isolated and identified in this study. We isolated 16 new guaiane-type dimers (xylanins A–P, 1–16, Fig. 1) and 6 known compounds (17–22) from X. vielana extracts. To find the potentially active compounds, all the new sesquiterpene dimers were tested for cytotoxic activities and five of them (6, 7, 8, 9 and 12) showed cytotoxic activities in vitro against the PANC-1 and PC-3 cell lines. Within these five compounds, compound 8 had a relatively stronger cytotoxic effect against PANC-1 and PC-3 cell lines with IC50 values of 1.06 and 9.1 μM, respectively. Further flow cytometry analysis, transwell assay and immunofluorescence technique revealed that compound 8 had an inhibitory effect in PANC-1 cells. The details of isolation, structure identification and biological evaluation of these sesquiterpene dimers are reported here.
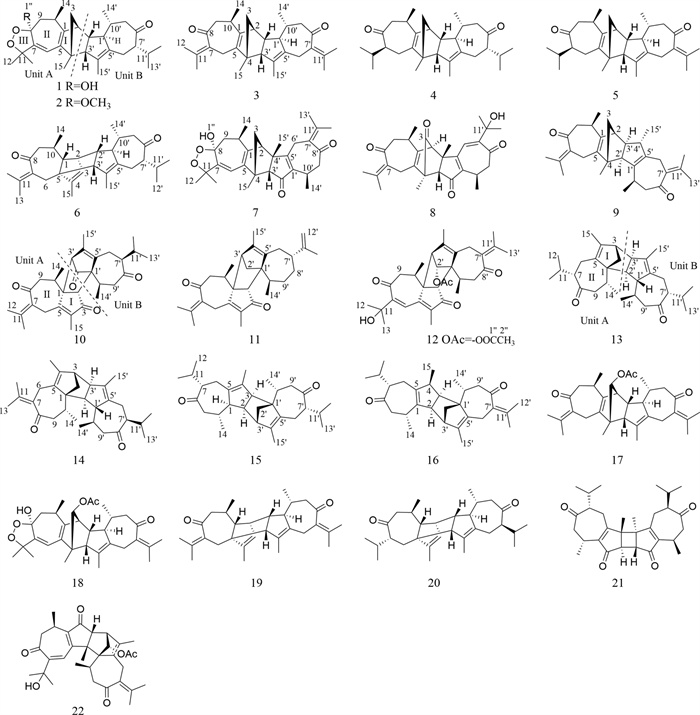
Structures of compounds 1–22
2 Results and discussion
2.1 Structure elucidation
Xylanin A (1) was obtained as colorless needle crystals. The molecular formula of 1 was found to be C30H42O4 (HR-ESI–MS [M + Na] + at m/z 489.2977; calcd for 489.2975), indicating 10 degrees of unsaturation. The 13C NMR and DEPT data (Table 1) revealed the presence of 30 carbons, comprising eight methyls, four methylenes, eight methines and ten quaternary carbons. The 1D NMR data (Table 1) revealed the presence of two guaiane units (A and B), which was further confirmed by 2D NMR experiments (Fig. 3). In the HMBC spectrum, the five-membered ring (Ⅰ) was deduced by the cross-peaks from H2-3 to C-1/C-5, from H3-15 to C-3/C-4/C-5, and from H-2 to C-5 in unit A. Moreover, the HMBC cross-peaks from H-6 to C-1/C-4/C-7/C-8, from H-10 to C-1/C-5/C-9/C-14, and from H2-9 to C-1/C-7/C-8/C-10/C-14 indicated that the seven-membered ring (Ⅱ) was fused with the five-membered ring (Ⅰ) via the double bond (C-1/C-5). Furthermore, another five-membered ring (Ⅲ) was connected to the seven-membered ring (Ⅱ) through a C-7/C-8 single bond. This was based on the key HMBC correlations from H-6 to C-7/C-8/C-11, from H2-9 to C-7/C-8, from H3-12 to C-7, and from H3-13 to C-11. The presence of a dioxygen bridge in the five-membered ring (Ⅲ) was determined on the basis of the chemical shifts of C-8 (δc 103.3) and C-11 (δc 85.3). The above results were used to elucidate the structure of unit A, which was shown to be a guaiane-type sesquiterpene. Similarly, unit B was assigned as a guaiane-type based on the key HMBC cross-peaks. The linkage of unit A and unit B via two direct C–C bonds (C-2 to C-2′ and C-4 to C-3′) was deduced from the key HMBC cross-peaks from H3-15 to C-3′, from H-1′ to C-2, and from H-2 to C-2′/C-3′. Consequently, the planar structure of 1 was confirmed (Fig. 3). The relative configuration of 1 was identified by the key NOESY correlations (Fig. 4). The key NOESY correlations of H-1′/H3-14′, H-2/H3-14′ and H-10/H-1′ suggested that these protons shared the same spatial orientation and were assigned as α-oriented. The correlations of H-2′/H-10′, H3-14/H-2′, H-3′/H-10′ and H-10′/H-7′ indicated that H-2′, H-3′, H-10′ and H-7′ were β-oriented. Finally, the absolute configuration of 1 (Fig. 2) was determined by single-crystal X-ray diffraction analysis as 2S, 4R, 8S, 10R, 1′R, 2′R, 3′R, 7′S, 10′R.
1H (400 MHz) and 13C (100 MHz) NMR data for compounds 1–4 in CDCl3
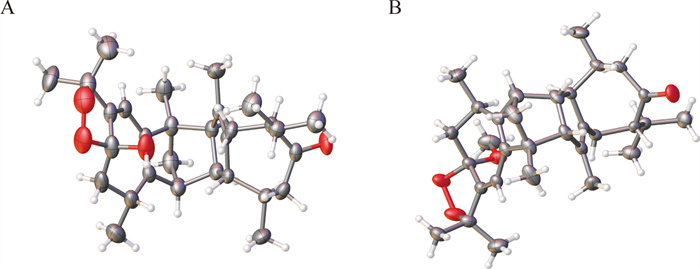
X-ray structures of 1 (A) and 2 (B)
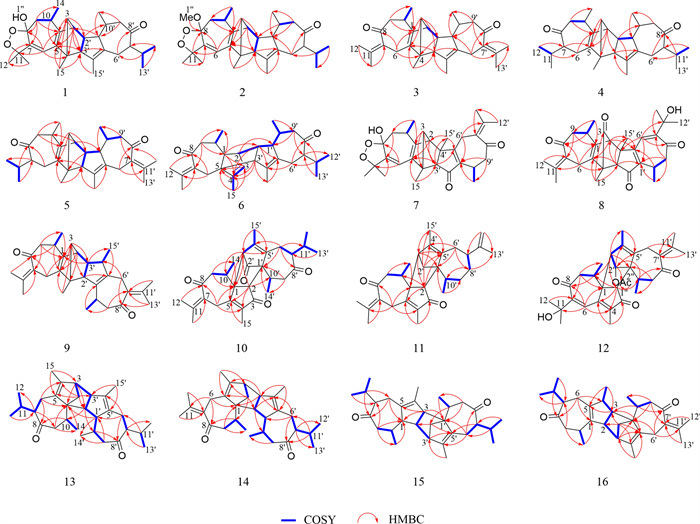
Key HMBC and 1H-1H COSY correlations of 1–16
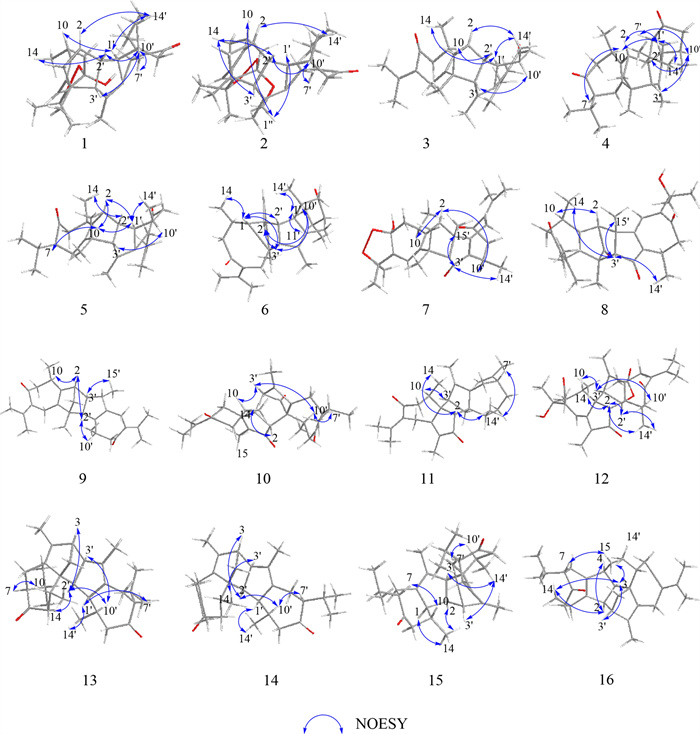
Key NOESY correlations of 1–16
Xylanin B (2) was obtained as colorless crystals. The molecular formula of 2 was found to be C31H44O4 (HR-ESI–MS [M + Na]+ at m/z 503.3130; calcd 503.3132), requiring 10 degrees of unsaturation. The 13C NMR and DEPT data (Table 1) of 2 exhibited 31 carbons signals that were almost identical to those of 1. The only difference found between 1 and 2 was the replacement of a hydroxyl group at C-8 by a methoxy moiety (Fig. 1). The HMBC cross-peak from H3-1′′ [δH 3.36 (3H, s), δC 49.3] to C-8 (δC 106.1) suggested that the methoxy was assigned to C-8 (Fig. 3). The NOESY correlations of H-2/H3-14′, H-2′/H-10′, H3-14/H-2′ and H-10′/H-7′ indicated that the relative configurations of these chiral centers were identical to those of 1. Furthermore, the NOESY correlation of H3-1′′/H-10 and H-1′/ H3-1′′ indicated that H-1′, H3-1′′ and H-10 were α-oriented. The correlation of H-3′/H3-14 suggested that H-3′ was β-oriented. Consequently, the absolute configuration of 2 was the same as that of 1 owing to the similar ECD effects (Fig. 5).
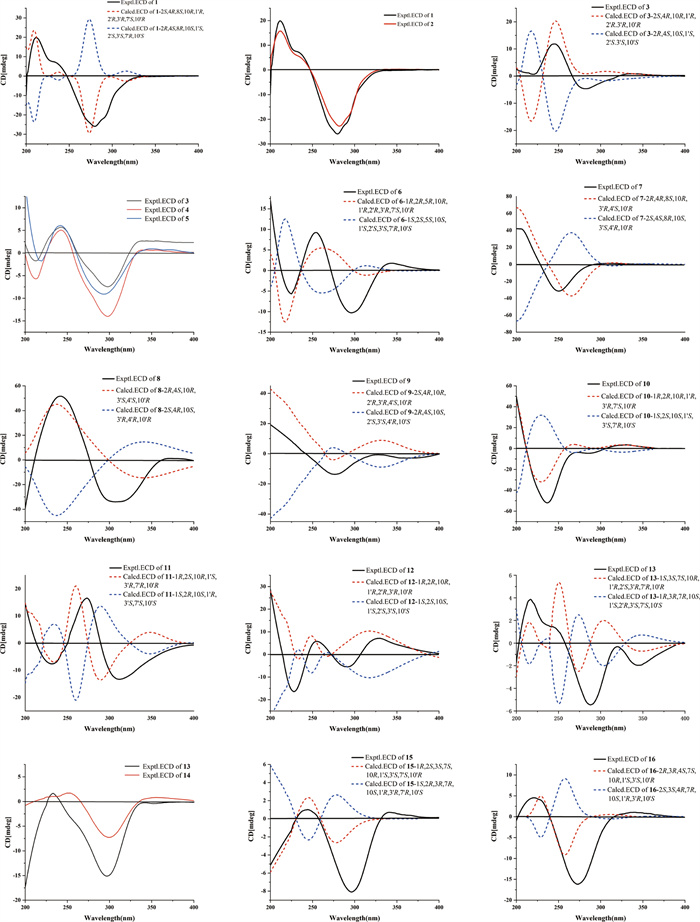
Calculated and experimental ECD spectra of 1–16
Xylanin C (3) was obtained as yellow oil. The molecular formula of 3 was found to be C30H40O2 (HRESIMS [M + H]+ at m/z 433.3101; calcd 433.3101), indicating 11 degrees of unsaturation. The comparison of the 1D NMR and 2D NMR data (Table 1) showed that 3 had the same skeleton as 1. The primary differences observed were the absence of a five-membered ring (Ⅲ) at unit A and the olefinic bond at C-6/C-7 in 3, which were supported by the changes of chemical shifts at C-6 (δC 25.9), C-7 (δC 135.4), C-8 (δC 204.7), and C-11 (δC 139.7) (Table 1). The analysis of the NMR data revealed that 3 possessed two additional double bonds compared to 1. These were unambiguously assigned to the positions C-7 (δC 135.4)/C-11 (δC 139.7) and C-7′ (δC 133.8)/C-11′ (δC 139.2), based on a detailed comparison of their respective chemical shifts. The key NOESY correlations of H-2/H3-14′, H-1′/H3-14′ and H-1′/H-10 indicated that these protons shared the same spatial orientation and were assigned as α-oriented. Additionally, the correlations of H-2′/H3-14 and H-3′/H-10′ suggested that H-2′, H-3′ and H-10′ were β-oriented (Fig. 4). Furthermore, experimental and calculated ECD results were highly similar (Fig. 5). Above of all, the absolute configuration for 3 was determined as 2S, 4R, 10R, 1′R, 2′R, 3′R, 10′R.
Xylanin D (4) was obtained as colorless oil. Its molecular formula C30H44O2 was established by HR-ESI–MS: m/z 437.3417 [M + H] + (calcd for 437.3414), containing 9 degrees of unsaturation. The comparison of the 1D NMR and 2D NMR data (Table 1) indicated that 4 possessed the same structural framework as 3. The main differences were the absence of olefinic bonds at C-7/C-11 and C-7′/C-11′ in 4, and the chemical shifts of C-7 (δC 58.4), C-11 (δC 30.6), C-7′ (δC 58.9) and C-11′ (δC 31.8) shifted to higher field values (Table 1). The relative configuration of 4 matched that of 3, as supported by their identical NOESY cross-peaks. The relative configurations of H-2, H-1′, H-7 and H-10 were assigned as α-orientation due to the NOESY cross-peaks of H-2/H-1′ and H-7/H-10. In addition, the NOESY correlation between H-10′ and H-7′ indicated that H-7′ was β-oriented. Consequently, the absolute configuration of 4 was assigned as 2S, 4R, 7S, 10R, 1′R, 2′R, 3′R, 7′S, 10′R owing to the similar ECD spectra of 4 and 3 (Fig. 5).
Xylanin E (5), obtained as white powder. The molecular formula of 5 was found to be C30H42O2 (HR-ESI–MS [M + H]+ at m/z 435.3254; calcd 435.3258), requiring 10 degrees of unsaturation. The 1D and 2D NMR data (Table 2) of 5 exhibited a high degree of similarity to those of 4 except for the appearance of a double bond at C-7′ (δC 133.1)/C-11′ (δC 140.2). The relative configuration of 5 was identical to 4 by analyzing their NOESY interactions. Furthermore, the small coupling constant between H-2′ and H-3′ (J3′ = 2.1 Hz) indicated that they adopted a coaxial configuration, thereby assigning the β-orientation to H-2′ and H-3′. Additionally, the observed NOESY correlations of H-2′/H3-14, H-3′/H-10′ and H-7/H-10 allowed for the assignment of a β-orientation of H3-14 and H-10′, and an α-orientation of H-7 (Fig. 4). The similar ECD spectra of 5 and 4 indicated that the absolute configuration of 5 was identical to 4 (Fig. 5). Accordingly, the structure of 5 was defined as 2S, 4R, 7S, 10R, 1′R, 2′R, 3′R, 10′R.
1H (400 MHz) and 13C (100 MHz) NMR data for compounds 5—8 in CDCl3
Xylanin F (6) was obtained as yellow powder. Its molecular formula was deduced as C30H42O2 from HR-ESI–MS m/z 435.3264 [M + H] + (calcd. for 435.3258), accounting 10 degrees of unsaturation. The comparison of the 1D NMR and 2D NMR data (Table 2) revealed that the structure of 6 was similar to that of 4, with the exception of the presence of a double bond at C-7 (δC 134.9)/C-11 (δC 140.5). Additionally, modifications were made to the linkage between unit A and unit B, and the position of the double bond in unit A was adjusted. The 1H-1H COSY correlations from H-2′ to H-2/H-1′ and the crucial HMBC cross-peaks from H-2 to C-1′, and from H-3′ to C-4/C-5 (Fig. 3) indicated that unit A and unit B were linked by two direct C–C bonds (C-2 to C-2′ and C-5 to C-3′). The HMBC correlations from H-1 to C-3 (δC 126.4)/C-4 (δC 142.9), from H-2′ to C-4 (δC 142.9), from H-3′ to C-4 (δC 142.9), and from H3-15 to C-3 (δC 126.4)/C-4 (δC 142.9) suggested that C-3/C-4 were a double bond in unit A (Fig. 3). The NOESY cross-peaks of H-1/H-2′, H-1/H3-14, H-3′/H-1, H-2/H-3′, H-10′/H-3′ and H-1′/H3-14′ were used to assign a β-orientation of H-1, H-2′, H3-14 H-3′, H-2 and H-10′, and an α-orientation of H-1′ (Fig. 4). Furthermore, the NOESY correlation between H-11′ and H-1′ confirmed the α-orientation of H-11′, which consequently required the β-orientation of H-7′. By comparing its experimental and calculated ECD spectra (Fig. 5), the absolute configuration of 6 was determined to be 1R, 2R, 5R, 10R, 1′R, 2′R, 3′R, 7′S, 10′R.
Xylanin G (7) was obtained as yellow oil. Its molecular formula C30H38O5 was established by HR-ESI–MS: m/z 501.2675 [M + Na] + (calcd for 501.2670), containing 12 degrees of unsaturation. The 1D NMR and 2D NMR data (Table 2) of 7 closely matched those of 1, with the exception of the significant downfield shifts observed for C-2′ (δC 206.7), C-7′ (δC 132.2), C-11′ (δC 143.9), C-1′ (δC 145.4) and C-5′ (δC 171.5). Based on the aforementioned information, a carbonyl group was identified at C-2′, a double bond was observed between C-7′ and C-11′, and the position of the double bond in unit B was altered. The key HMBC cross-peaks from H-3′ to C-5′ (δC 171.5), from H2-6′ to C-1′ (δC 145.4)/C-5′ (δC 171.5), and from H2-9 to C-1′ (δC 145.4) confirmed the presence of a double bond between C-1′ and C-5′ in unit B (Fig. 3). Furthermore, the connection between unit A and unit B was different. The key HMBC cross-peaks from H-2 to C-3′/C-4′, from H2-3 to C-4/C-3′, from H3-15 to C-4/C-3′, and from H3-15′ to C-2 were used to infer that unit A and unit B were linked by two direct C–C bonds (C-2 to C-4′ and C-4 to C-3′). The key NOESY signals (Fig. 4) of H-2/H-10 and H-10′/H-2 confirmed that these protons were co-facial and were assigned as α-oriented. The relative configurations of H-3′ and H3-15′ were assigned as β-orientation due to the NOESY cross-peaks of H-3′/H3-15′ and H-3′/H3-14′. Thus, the absolute configuration of 7 was defined as 2R, 4R, 8S, 10R, 3′R, 4′S, 10′R for the calculated ECD spectrum matched well with the experimental result.
Xylanin H (8) was obtained as colorless oil. Its molecular formula was determined to be C30H36O5 based on the positive HR-ESI–MS at m/z 477.2625 [M + H] + (calcd for 477.2636), requiring 13 degrees of unsaturation. Its NMR data (Table 2) resembled that of 7, with the presence of additional signals attributable to two carbonyl groups (δC 199.8 and 202.1) and a hydroxyl group [δH 3.46 (1H, s)]. Notably absent were the signals characteristic of a five-membered ring (Ⅲ). The HMBC cross-peaks from H3-15 to C-3 (δC 199.8), from H-10 to C-8 (δC 202.1), from H2-6 to C-8 (δC 202.1), from H3-12′ to C-11′ (δC 73.6), and from H3-13′ to C-11′ (δC 73.6) revealed that the carbonyl groups were located at C-3 and C-8, and that there was a hydroxyl group at C-11′ (Fig. 3). In the NOESY spectrum, the β-orientation of H-3′, H3-14, H3-14′ and H3-15′ was determined by the key correlations of H-3′/H3-14, H-3′/H3-14′ and H3-15′/H-3′. Meanwhile, the α-orientation of H-2 was determined by the key correlation of H-2/H-10 (Fig. 4). Analyses of its experimental and calculated ECD spectra (Fig. 5) suggested that the absolute configuration of 8 was defined as 2R, 4S, 10R, 3′S, 4′S, 10′R.
Xylanin I (9) was obtained as white powder. Its molecular formula C30H40O2 was established by HR-ESI–MS: m/z 433.3103 [M + H] + (calcd for 433.3101), containing 11 degrees of unsaturation. The 1D and 2D NMR data (Table 3) of 9 were similar to those of 8, except for the absence of two carbonyls at C-3 (δC 52.3) and C-2′ (δC 58.7) and a shift in the position of a double bond in unit B. The significant HMBC correlations from H2-6′ to C-7′ (δC 134.0), from H3-12′ to C-7′ (δC 134.0)/C-11′ (δC 143.9), and from H3-13′ to C-7′ (δC 134.0)/C-11′ (δC 143.9) confirmed that C-7′/C-11′ were a double bond in unit B (Fig. 3). The two units were linked via direct C–C bonds (C-2 to C-3′ and C-4 to C-2′), as indicated by the key HMBC correlations from H2-3 to C-2′/C-3′, and from H-2′ to C-4 (Fig. 3). The α-orientation of H-2, H-2′, H-10, H-10′, H-3′ and H3-15′ was indicated by the NOESY cross-peaks of H-2/H-2′, H-10/H-2, H-2′/H-10′ and H-3′/H3-15′ (Fig. 4). The absolute configurations of 9 (2S, 4R, 10R, 2′R, 3′R, 4′S, 10′R) were finally determined by a similar ECD experiment (Fig. 5).
1H (400 MHz) and 13C (100 MHz) NMR data for compounds 9—12 in CDCl3
Xylanin J (10) was obtained as white powder. The molecular formula of 10 was found to be C30H38O4 (HR-ESI–MS [M + H]+ at m/z 463.2840; calcd 463.2843), requiring 12 degrees of unsaturation. The 13C NMR spectrum (Table 3), interpreted with the assistance of the HSQC spectrum, revealed the presence of 30 carbon atoms within 6 different groups, consisting of eight methyls, four methylenes, six methines, four carbonyls, six olefins, and two quaternary carbons. The 1D NMR data (Table 3) exhibited two guaiane units (A and B) in the structure of 10, which was further confirmed by 2D NMR experiments (Fig. 3). In unit A, the HMBC cross-peaks from H-2 to C-1/C-3/C-4/C-5, and from H3-15 to C-4/C-5 suggested the appearance of a five-membered ring (Ⅰ). Moreover, a seven-membered ring (Ⅱ) was fused with five-membered ring (Ⅰ) at C-1 and C-5 by analyses of the HMBC cross-peaks from H2-6 to C-1/C-4/C-5/C-8, from H2-9 to C-1/C-8/C-10/C-14, and from H3-14 to C-1/C-9/C-10. Following the analysis of the above spectra, it was determined that the unit A was to be designated a guaiane unit. Similarly, unit B was also assigned as a guaiane unit. The linkage of unit A and unit B via two direct C–C bonds (C-1 to C-3′ and C-2 to C-1′) was deduced from the key HMBC cross-peaks from H-2 to C-3′/C-10′, and from H-3′ to C-1/C-5/C-10 (Fig. 3). The key NOESY correlations of H-3′/H-10, H-7′/H-10′ and H-10′/H-3′ indicated that these protons shared the same spatial orientation and were assigned as α-oriented. The correlation of H-2/H3-14′ revealed that H-2 was β-oriented (Fig. 4). The absolute configuration of 10 was defined as 1R, 2R, 10R, 1′R, 3′R, 7′S, 10′R by a similar ECD experiment (Fig. 5).
Xylanin K (11) was obtained as yellow oil. Its molecular formula C30H40O2 was established by HR-ESI–MS: m/z 455.2916 [M + Na] + (calcd for 455.2921), containing 11 degrees of unsaturation. Comparison of the 13C NMR and DEPT data (Table 3) revealed that 11, in contrast to 10, lacked two carbonyl groups at C-2′ (δC 48.1)/C-8′ (δC 36.8), and exhibited an additional double bond at C-11′ (δC 151.6)/C-12′ (δC 108.3). These differences were further supported by the HMBC correlations from H2-2′ to C-2/C-4′/C-5′, from H2-8′ to C-10′, and from H2-12′ to C-7′/C-13′. In the NOESY spectrum of 11, the key NOESY correlations of H-2/H3-14, H-2/H3-14′ and H-7′/H3-14′ indicated that H-2, H3-14, H3-14′ and H-7′ were β-oriented. The correlation of H-3′/H-10 suggested that H-3′ and H-10 were α-oriented (Fig. 4). Furthermore, the calculated ECD spectrum of 11 (Fig. 5) was similar with the experimental data closely. Therefore, the absolute configuration of 11 was assigned as 1R, 2S, 10R, 1′S, 3′R, 7′R, 10′R.
Xylanin L (12) was obtained as colorless oil. Its molecular formula C32H40O6 was established by HR-ESI–MS: m/z 543.2720 [M + Na] + (calcd for 543.2717), requiring 13 degrees of unsaturation. The comparison of the 1D NMR and 2D NMR data (Table 3) revealed that 12 shared a similar skeletal structure with 10, with the exception of several significant differences. These included the presence of a hydroxyl group [δH 3.45 (1H, s)], an acetoxy group [δH 2.02 (3H, s), δC 21.4, -OOCCH3, δC 171.2, -OOCCH3], and a double bond at C-7′ (δC 133.3)/C-11′ (δC 133.8), as well as a shift in the position of a double bond in unit A. The chemical shift of C-11 (δc 73.5) was consistent with the presence of a hydroxyl group. The key HMBC correlations from H-2′ [δH 4.94 (1H, s)] to C-1′′ (δC 171.2, -OOCCH3), and from H-2′′ [δH 2.02 (3H, s)] to C-1′′ (δC 171.2, -OOCCH3), along with the chemical shift of C-2′ (δc 85.2), implied that C-2′ was connected to an acetoxy group. The key HMBC correlations from H3-12′ to C-7′ (δc 133.3)/C-11′ (δc 133.8), from H3-13′ to C-7′ (δc 133.3)/C-11′ (δc 133.8), from H-6 to C-7(δc 153.0), and from H2-9 to C-7(δc 153.0) could be speculated to that C-7′/C-11′ and C-6/C-7 were double bonds (Fig. 3). The linkage of unit A and unit B via two direct C–C bonds (C-1 to C-3′ and C-2 to C-1′) was similar to 10. Furthermore, the key NOESY signals (Fig. 4) of H-2/H3-14, H-2/H3-14′, H-2′/H-2 and H-2′/H3-14′ confirmed that these protons were co-facial and were assigned as β-oriented. The correlation of H-3′/H-10 indicated that H-3′ and H-10 were α-oriented. The absolute configuration of 12 (1R, 2R, 10R, 1′R, 2′R, 3′R, 10′R) was identified from the similarity between the experimental and calculated ECD spectra (Fig. 5).
Xylanin M (13) was obtained as white amorphous powder. Its molecular formula was established to be C30H44O2 by HR-ESI–MS (m/z 437.3404 [M + H] +; calcd 437.3414), corresponding to an index of hydrogen deficiency of 9. The 1D NMR data (Table 4) indicated the presence of two guaiane units (A and B) in the structure of 13, which was further confirmed by 2D NMR experiments. In unit A, the key HMBC cross-peaks from H3-15 to C-3/C-4/C-5, and from H2-2 to C-1/C-3/C-4/C-5 established the presence of a five-membered ring (Ⅰ). The presence of a seven-membered ring (Ⅱ) fused with a five-membered ring (Ⅰ) in unit A at C-1 and C-5 was revealed by the key HMBC cross-peaks from H2-6 to C-1/C-4/C-5/C-8, from H2-9 to C-1/C-8/C-10/C-14, and from H3-14 to C-1/C-8/C-9/C-10. As with unit A, unit B was also identified as a guaiane sesquiterpene with the aid of key HMBC cross-peaks. The 1H-1H COSY correlations from H-3′ to H-3/H-2′ and the crucial HMBC cross-peaks from H-3 to C-2′, from H-1′ to C-1, and from H-2′ to C-1/C-10 (Fig. 3) indicated that unit A and unit B were linked by two direct C–C bonds (C-3 to C-3′ and C-1 to C-2′). In the NOESY spectrum, H-3, H-2′, H-3′, H-10′ and H3-14 were determined to be α-oriented by the key correlations of H-3/H-2′, H-2′/H3-14, H-3′/H-10′ and H-2′/H-10′, while the β-orientation of H-7, H-10, H-1′, H3-14′ and H-7′ was determined by the key cross-peaks of H-7/H-10, H-1′/H3-14′ and H-7′/H-1′ (Fig. 4). The absolute configuration of 13 was established via ECD calculation which closely matched the experimental data (Fig. 5), allowing the assignment of the absolute configuration as 1S, 3S, 7S, 10R, 1′R, 2′S, 3′R, 7′R, 10′R.
1H (400 MHz) and 13C (100 MHz) NMR data for compounds 13—16 in CDCl3
Xylanin N (14) was obtained as white powder. The molecular formula of 14 was found to be C30H42O2 (HR-ESI–MS [M + Na] + at m/z 457.3077; calcd 457.3077), requiring 10 degrees of unsaturation. The 1D and 2D NMR data (Table 4) of 14 were similar to those of 13, with the exception of the appearance of a double bond at C-7 (δc 133.0)/C-11 (δc 142.1). The key HMBC correlations from H2-6 to C-7/C-11, from H3-12 to C-7/C-11, and from H3-13 to C-7/C-11 verified the aforementioned conclusion. The relative configuration of 14 was determined by analyzing its NOESY data. The key NOESY cross-peak of H-1′/H3-14′ indicated that H-1′ was β-oriented. In contrast, the key NOESY cross-peaks of H-2′/H-3, H-2′/H-10′, H-3′/H3-14 and H-7′/H-10′ suggested that H-2′, H-3, H-10′, H-3′ and H-7′ were α-oriented. Consequently, the ECD spectrum of 14 was in accordance with that of 13. Therefore, the absolute configuration of 14 was established as 1S, 3S, 10R, 1′R, 2′S, 3′R, 7′S, 10′R.
Xylanin O (15) was obtained as white powder. Its molecular formula C30H44O2 was established by HR-ESI–MS: m/z 459.3225 [M + Na] + (calcd for 459.3234), containing 9 degrees of unsaturation. The comparison of the 1D NMR and 2D NMR data (Table 4) revealed that 15 closely resembled 14, with the exception of the absence of a double bond at C-7 (δc 58.0)/C-11 (δc 30.1) and the alteration in the linkage between unit A and unit B. The linkage between unit A and unit B via two direct C–C bonds (C-2 to C-3′ and C-3 to C-1′) was due to the key 1H-1H COSY correlations from H-2 to H-3/H-3′, and the key HMBC correlations from H-3 to C-1′, and from H2-2′ to C-2/C-3′. The NOESY correlations of H-1/H3-14, H-2/H3-14, H-3/H3-14′ and H-3′/H3-14′ indicated the α-orientation of H-1, H-2, H-3 and H-3′. Similarly, the α-orientation of H-7 and H-7′ was defined by the correlations of H-7/H-10 and H-10′/H-7′. The overall pattern of the experimental spectrum was in reasonable agreement with the calculated ECD spectrum of 15 (Fig. 5), which indicated the 1R, 2S, 3S, 7S, 10R, 1′S, 3′S, 7′S, 10′R absolute configuration of 15.
Xylanin P (16) was obtained as yellow powder. The molecular formula of 16 was found to be C30H42O2 (HR-ESI–MS [M + Na] + at m/z 457.3076 calcd for 457.3077), accounting 10 degrees of unsaturation. The comparison of the 1D NMR and 2D NMR data (Table 4) revealed that the structure of 16 was similar to that of 15, except for the presence of a double bond at C-7′/C-11′ and a shift in the location of a double bond within unit A. The HMBC correlations from H2-6′ to C-7′ (δC 132.8)/C-11′ (δC 142.9), from H3-12′ to C-7′ (δC 132.8)/C-11′ (δC 142.9), from H3-13′ to C-7′ (δC 132.8)/C-11′ (δC 142.9), from H3-15 to C-5 (δC 143.8), from H-2 to C-1 (δC 138.7), from H-3 to C-5 (δC 143.8), and from H2-6 to C-1 (δC 138.7) could be speculated that C-7′/C-11′ and C-1/C-5 were double bonds (Fig. 3). The key NOESY signals (Fig. 4) of H-3/H3-14, H-3/H3-14′, H-2/H-4, H-2/H3-14 and H-3′/H-3 revealed that these protons were co-facial and were assigned as α-oriented. The correlation of H-7/H3-15 indicated that H-7 was β-oriented. The absolute configuration of 16 was established by comparison of the experimental and calculated ECD data. The calculated ECD spectrum of 16 (Fig. 5) was in accordance with the experimental data closely, pointing toward an absolute configuration of 2R, 3R, 4S, 7S, 10R, 1′S, 3′S, 10′R for 16.
In addition, six known compounds, xylopins A and B (17 and 18) [9], xylopsides C and D (19 and 20) [6], xylopidimer D (21) [3] and vieloplain B (22) [10], were characterized by comparison of their spectroscopic data with the reported values.
2.2 Cytotoxicity
In the bioactivity assessment, compounds 1—16 were tested for their cytotoxic effects in vitro against the PANC-1 and PC-3 cell lines. As shown in Table 5, compound 8 had a relatively stronger cytotoxic effect on the PANC-1 and PC-3 cell lines at IC50 values of 1.06 and 9.1 μM, respectively. Compounds 6, 7, 9 and 12 showed a moderate cytotoxic activity against PANC-1 and PC-3 cell lines with IC50 values ranged from 5.5—20.5 μM. Therefore, compound 8 was further studied for its induction of apoptosis, cell cycle analysis, cell invasion and autophagy according to its potent cytotoxic effect against PANC-1 cells.
Cytotoxic effects of compounds 1—16 with IC50 values (μM)
2.3 Effect of compound 8 on apoptosis and cell cycle of PANC-1 cells
To determine if the decreased cell viability was linked to apoptosis, the Annexin fluorescein isothiocyanate (V-FITC)/propidium iodide (PI) double staining was performed to detect the apoptosis rate. We found that the apoptosis rate of PANC-1 cells increased with the concentration of compound 8 (Fig. 6A), and the apoptosis rate was 49.24% at a concentration of 2 μM.
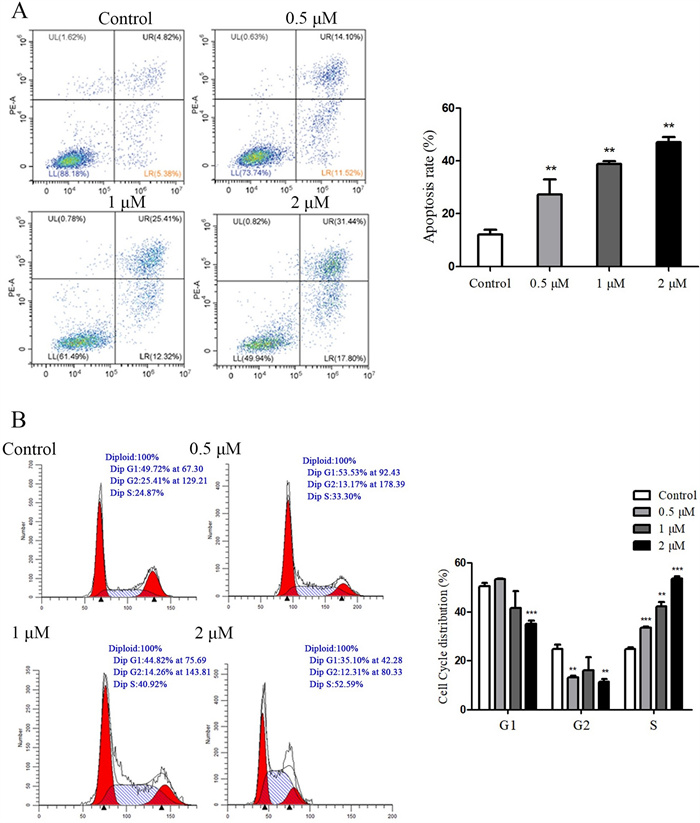
A Effect of compound 8 on apoptosis of PANC-1 cells. B Effect of compound 8 on the cell cycle distribution of PANC-1 cells
To examine whether compound 8 inhibited cell growth by arresting the cell cycle in PANC-1 cells, the cell distribution at different phases of the cell cycle was analyzed by flow cytometry, in which PANC-1 cells were incubated in the presence of different concentrations of compound 8 for 48 h. As shown in Fig. 6B, the percentage of cells in S phase increased corresponding to the increase of the concentration of compound 8. Compared to the control group, the compound 8-treated group displayed more S distribution and less G1 and G2 distributions, indicating that compound 8 could change the cell cycle by arresting the progression of the S phase.
2.4 Effect of compound 8 on invasion and autophagy of PANC-1 cells
We performed cell invasion by transwell test. Transwell assay (Fig. 7A) showed that PANC-1 cells had a strong invasive ability in the control group but compound 8 significantly inhibited PANC-1 cell invasion. Immunofluorescence staining showed that LC3 protein expression was increased in the compound 8-treated group compared with the control group (Fig. 7B).
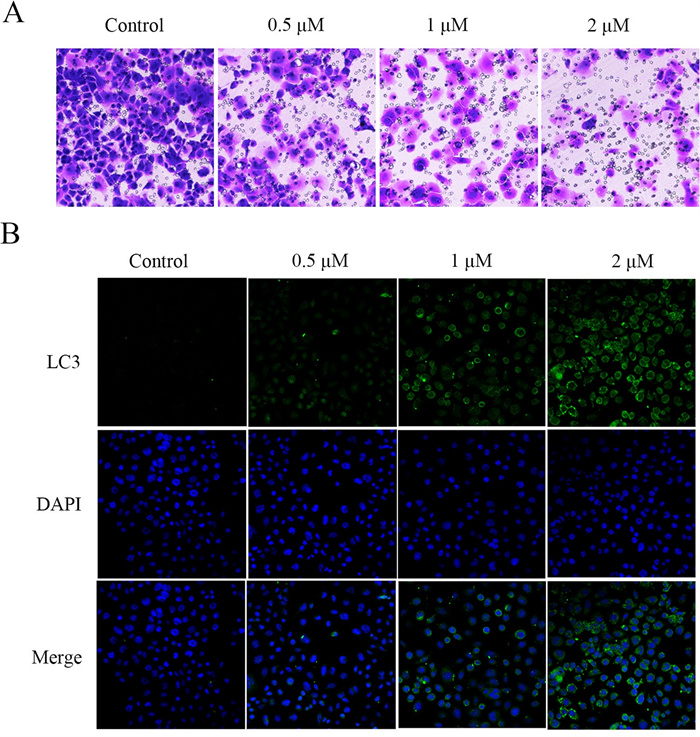
A Transwell assay of PANC-1 cells incubated with compound 8 (0.5, 1 and 2 μM) for 48 h. B Representative images of LC3 and DAPI immunofluorescence staining in the control group and compound 8-treated group
3 Experimental section
3.1 General experimental procedures
Optical rotation data were acquired on a WZZ-3 polarimeter (Shanghai, China). NMR data were obtained using a Bruker AV-400 spectrometer (Fallanden, Switzerland). HR-ESI–MS analyses were measured on a Bruker micOTOF Ⅱ and SolariX 7.0 spectrometer (Bruker, Karlsruhe, Germany). High performance liquid chromatography (HPLC) analysis was performed on a SHIMADZU chromatography equipped with LC-20AD pumps, SPD-20A detector and a 250 mm × 10 mm YMC-Pack ODS-A column (YMC, Kyoto, Japan) and a 250 mm × 4.6 mm SHIMADZU-GL column (Shimadzu, Japan).
3.2 Plant material
The branches and leaves of X. vielana were collected from Dongxing city, Guangxi province, P. R. China, in September 2018. The identification of the plant material was authenticated by Prof. Chen Min, Southwest University, China. A voucher specimen (No. KMZF2018M001A) has been deposited in School of Pharmacy, Southwest University.
3.3 Extraction and isolation
The sun-dried (5 kg) plant branches and leaves were crushed into small pieces. The plant material was soaked with 95% EtOH (30 L) for 24 h and then extracted three times at 60 ℃ under reflux. The combined EtOH extracts were concentrated under vacuum to yield a crude residue (163.2 g), which was suspended in water, and subsequently partitioned with petroleum ether, dichloromethane and ethyl acetate. The dichloromethane portion (55.1 g) was subjected to silica gel column chromatography eluting with a step-wise gradient of ethyl acetate (PE)/petroleum ether (EA) (v/v, 100:1, 80:1, 60:1, 40:1, 20:1, 10:1, 5:1, 2:1, 1:1) to obtain thirteen fractions (A–M) (monitored by thin layer chromatography).
The Fr. E (3.089 g) was chromatographed on ODS column with a step gradient mixture of MeOH/H2O to obtain fractions E1-E12. The Fr. E4 (204 mg) was separated by semi-preparative HPLC (MeOH/H2O, 80:20) to yield compounds 2 (tR 33 min, 43 mg), 12 (tR 29 min, 23 mg) and 19 (tR 25 min, 8 mg). Compounds 3 (tR 34 min, 33 mg), 13 (tR 38 min, 19 mg) and 21 (tR 43 min, 5 mg) were obtained from Fr. E6 (287 mg) by semi-preparative HPLC (MeOH/H2O, 85:15). The Fr. E9 (136 mg) was separated by semi-preparative HPLC (MeOH/H2O, 88:12) to yield compounds 22 (tR 43 min, 4.5 mg). The Fr. E8 (1.598 g) was subjected to silica gel column using a gradient of PE/EA (v/v, 100: 1, 50: 1, 20: 1, 10: 1, 5: 1, 2: 1, 1: 1, 1: 2) to yield seven subfractions E8a-E8g. The Fr. E8c (141 mg) was separated by semi-preparative HPLC (MeOH/H2O, 80:20) to yield compounds 1 (tR 35 min, 56 mg), 6 (tR 26 min, 8 mg) and 18 (tR 43 min, 6 mg). The Fr. E8d (390 mg) was separated by semi-preparative HPLC (MeOH/H2O, 85:15) to yield compounds 11 (tR 35 min, 12 mg), 14 (tR 38 min, 13 mg) and 20 (tR 29 min, 9 mg).
The Fr. H (1.705 g) was chromatographed on ODS column with a step gradient mixture of MeOH–H2O to obtain fractions H1-H7. The Fr. H3 (177 mg) was separated by semi-preparative HPLC (MeOH/H2O, 78:22) to yield compounds 5 (tR 37.5 min, 35 mg), 7 (tR 31 min, 8 mg), 9 (tR 43 min, 7 mg) and 17 (tR 28 min, 11 mg). Compounds 4 (tR 24 min, 29 mg), 8 (tR 40.5 min, 21 mg) and 16 (tR 36 min, 6 mg) were obtained from Fr. H6 (459 mg) by semi-preparative HPLC (MeOH/H2O, 90:10). The Fr. H7 (159 mg) was separated by semi-preparative HPLC (MeOH/H2O, 90:10) to yield compounds 10 (tR 42 min, 26 mg) and 15 (tR 35 min, 11 mg).
3.4 Spectroscopic data of compounds
Xylanin A (1): colorless needle crystals; [α]D20 − 69.9 (c 0.3 CH2Cl2); mp 190–191 ℃; UV (MeOH) λmax (log ε) 221 (0.46) nm; for 1H NMR and 13C NMR spectroscopic data, see Table 1; HR-ESI–MS (positive): m/z 489.2977 [M + Na]+ (calcd for C30H42O4Na, 489.2975).
Xylanin B (2): colorless crystals; [α]D20 − 56.9 (c 0.3 CH2Cl2); mp 178–179 ℃; UV (MeOH) λmax (log ε) 232 (0.29) nm; for 1H NMR and 13C NMR spectroscopic data, see Table 1; HR-ESI–MS (positive): m/z 503.3130 [M + Na]+ (calcd for C31H44O4Na, 503.3132).
Xylanin C (3): yellow oil; [α]D20 + 38.1 (c 0.3 CH2Cl2); UV (MeOH) λmax (log ε) 243 (1.23) nm; ECD (1.2 × 10⁻⁵ M, MeOH) λ (Δ ε) 244 (+ 12.86), 282 (− 5.13); for 1H NMR and 13C NMR spectroscopic data, see Table 1; HR-ESI–MS (positive): m/z 433.3101 [M + H]+ (calcd for C30H41O2, 433.3101).
Xylanin D (4): colorless oil; [α]D20 − 96.0 (c 0.3 CH2Cl2); UV (MeOH) λmax (log ε) 231 (0.85) nm; ECD (1.2 × 10⁻⁵ M, MeOH) λ (Δ ε) 245 (+ 5.76), 298 (− 14.12); for 1H NMR and 13C NMR spectroscopic data, see Table 1; HR-ESI–MS (positive): m/z 437.3417 [M + H]+ (calcd for C30H45O2, 437.3414).
Xylanin E (5): white powder; [α]D20–28.1 (c 0.3 CH2Cl2); UV (MeOH) λmax (log ε) 245 (0.85) nm; ECD (1.2 × 10⁻⁵ M, MeOH) λ (Δ ε) 245 (+ 6.30), 291 (− 9.26); for 1H NMR and 13C NMR spectroscopic data, see Table 2; HR-ESI–MS (positive): m/z 435.3254 [M + H]+ (calcd for C30H43O2, 435.3258).
Xylanin F (6): yellow powder; [α]D20 + 41.9 (c 0.3 CH2Cl2); UV (MeOH) λmax (log ε) 241 (0.29) nm; ECD (1.2 × 10⁻⁵ M, MeOH) λ (Δ ε) 221 (− 6.89), 255 (+ 10.53), 295 (− 10.28), 341 (+ 1.73); for 1H NMR and 13C NMR spectroscopic data, see Table 2; HR-ESI–MS (positive): m/z 435.3264 [M + H]+ (calcd for C30H43O2, 435.3258).
Xylanin G (7): yellow oil; [α]D20–145.3 (c 0.3 CH2Cl2); UV (MeOH) λmax (log ε) 216 (0.63) nm; ECD (1.2 × 10⁻⁵ M, MeOH) λ (Δ ε) 249 (− 50.98), 312 (+ 1.13); for 1H NMR and 13C NMR spectroscopic data, see Table 2; HR-ESI–MS (positive): m/z 501.2675 [M + Na]+ (calcd for C30H38O5Na, 501.2670).
Xylanin H (8): colorless oil; [α]D20 –51.3 (c 0.3 CH2Cl2); UV (MeOH) λmax (log ε) 249 (1.47) nm; ECD (1.2 × 10⁻⁵ M, MeOH) λ (Δ ε) 243 (+ 57.18), 312 (− 34.33); for 1H NMR and 13C NMR spectroscopic data, see Table 2; HR-ESI–MS (positive): m/z 477.2625 [M + H]+ (calcd for C30H37O5, 477.2636).
Xylanin I (9): white powder; [α]D20 –91.7 (c 0.3 CH2Cl2); UV (MeOH) λmax (log ε) 234 (0.62) nm; ECD (1.2 × 10⁻⁵ M, MeOH) λ (Δ ε) 274 (− 15.13), 326 (− 0.08); for 1H NMR and 13C NMR spectroscopic data, see Table 3; HR-ESI–MS (positive): m/z 433.3103 [M + H]+ (calcd for C30H41O2, 433.3101).
Xylanin J (10): white powder; [α]D20 –124.76 (c 0.3 CH2Cl2); UV (MeOH) λmax (log ε) 241 (1.14) nm; ECD (1.2 × 10⁻⁵ M, MeOH) λ (Δ ε) 236 (− 53.56), 277 (− 3.90); for 1H NMR and 13C NMR spectroscopic data, see Table 3; HR-ESI–MS (positive): m/z 463.2840 [M + H]+ (calcd for C30H39O4, 463.2843).
Xylanin K (11): yellow oil; [α]D20 + 88.4 (c 0.3 CH2Cl2); UV (MeOH) λmax (log ε) 248 (0.63) nm; ECD (1.2 × 10⁻⁵ M, MeOH) λ (Δ ε) 232 (− 6.21), 275 (+ 17.35), 311 (− 13.32); for 1H NMR and 13C NMR spectroscopic data, see Table 3; HR-ESI–MS (positive): m/z 455.2916 [M + Na]+ (calcd for C30H40O2Na, 455.2921).
Xylanin L (12): colorless oil; [α]D20 + 82.8 (c 0.3 CH2Cl2); UV (MeOH) λmax (log ε) 296 (2.51) nm; ECD (1.2 × 10⁻⁵ M, MeOH) λ (Δ ε) 229 (− 16.30), 258 (+ 5.78), 290 (− 14.7), 328 (+ 21.88); for 1H NMR and 13C NMR spectroscopic data, see Table 3; HR-ESI–MS (positive): m/z 543.2720 [M + Na]+ (calcd for C32H40O6Na, 543.2717).
Xylanin M (13): white amorphous powder; [α]D20 –84.1 (c 0.3 CH2Cl2); UV (MeOH) λmax (log ε) 237 (0.84) nm; ECD (1.2 × 10⁻⁵ M, MeOH) λ (Δ ε) 227 (+ 2.81), 299 (− 15.83); for 1H NMR and 13C NMR spectroscopic data, see Table 4; HR-ESI–MS (positive): m/z 437.3404 [M + H]+ (calcd for C30H45O2, 437.3414).
Xylanin N (14): white amorphous powder; [α]D20 –51.6 (c 0.3 CH2Cl2); UV (MeOH) λmax (log ε) 236 (0.19) nm; ECD (1.2 × 10⁻⁵ M, MeOH) λ (Δ ε) 231 (+ 3.91), 300 (− 7.61); for 1H NMR and 13C NMR spectroscopic data, see Table 4; HR-ESI–MS (positive): m/z 457.3077 [M + Na]+ (calcd for C30H42O2Na, 457.3077).
Xylanin O (15): white powder; [α]D20 –69.6 (c 0.3 CH2Cl2); UV (MeOH) λmax (log ε) 237 (0.26) nm; ECD (1.2 × 10⁻⁵ M, MeOH) λ (Δ ε) 216 (− 3.35), 248 (+ 1.38), 298 (− 8.21); for 1H NMR and 13C NMR spectroscopic data, see Table 4; HR-ESI–MS (positive): m/z 459.3225 [M + Na]+ (calcd for C30H44O2Na, 459.3234).
Xylanin P (16): yellow powder; [α]D20 –87.9 (c 0.3 CH2Cl2); UV (MeOH) λmax (log ε) 228 (0.61) nm; ECD (1.2 × 10⁻⁵ M, MeOH) λ (Δ ε) 211 (+ 2.66), 226 (+ 6.08), 278 (− 17.73); for 1H NMR and 13C NMR spectroscopic data, see Table 4; HR-ESI–MS (positive): m/z 457.3076 [M + Na]+ (calcd for C30H42O2Na, 457.3077).
3.5 X-ray crystallographic analysis of compounds 1 and 2
A suitable crystal was selected and then performed on a SuperNova, Dual, Cu at home/near, EosS2 diffractometer. The crystal was kept at 294.5 K during data collection. The structure was then solved utilizing the ShelXS structure solution program in conjunction with direct methods, and further refined using the ShelXL refinement package through least squares minimization.
Crystal data for compound 1: C30H42O4, M=466.64, a=16.6944(3) Å, b=17.4380(3) Å, c=19.0842(2) Å, α=90°, β=90°, γ=90°, V=5555.75(14) Å3, T=295 K, space group P21, Z=4, μ (Cu Kα)=0.567 mm−1, 53,317 reflections collected, 10,784 independent reflections (Rint=0.0412). The goodness of fit on F2 was 1.035. Flack parameter=−0.15(12). The final R1 values were 0.0463 (I > 2σ(I)). The final wR (F2) values were 0.1220 (I > 2σ(I)). The final R1 values were 0.0582 (all data). The final wR (F2) values were 0.1297 (all data). CCDC deposition number was 2267636.
Crystal data for compound 2: C31H44O4, M=480.66, a=10.06326(10) Å, b=16.21942(18) Å, c=17.23224(18) Å, α=90°, β=90°, γ=90°, V=2812.65(5) Å3, T=180 K, space group P21, Z=4, μ (Cu Kα)=0.573 mm−1, 52,884 reflections collected, 5507 independent reflections (Rint=0.0897). The goodness of fit on F2 was 1.026. Flack parameter=−0.04(10). The final R1 values were 0.0392 (I > 2σ(I)). The final wR (F2) values were 0.1051 (I > 2σ(I)). The final R1 values were 0.0401 (all data). The final wR (F2) values were 0.1063 (all data). CCDC deposition number was 2267637.
3.6 ECD calculations
Firstly, we needed to search random conformation by SYBYL X 2.0 program using MMFF94s molecular force field, with an energy cutoff of 10 kcal mol−1 to the global minima [14]. Subsequently, the geometric structure and frequency analysis of the molecular conformation were optimized using density functional theory (DFT) under the B3LYP/6–31 + G(d,p) method. Next, the electron circular dichroism (ECD) of compounds was calculated using time dependent density functional theory (TDDFT) at the same group level. Finally, the ECD spectra calculated by quantum chemistry were compared with those measured by experiment, and the absolute configurations of the compounds were determined [15–17].
3.7 Cytotoxicity assay
The details of the cytotoxicity assay on two human tumor cell lines (PANC-1 and PC-3) were described below. Briefly, 1 × 10⁴ cells/mL were seeded in 96 well plates and incubated for 24 h. Then, cells were treated with different concentrations of the tested compounds in the growth medium for 48 h. After that, 10 μL of cell counting kit-8 (CCK-8, Targetmol) was added to each well and incubation was conducted 90 min at 37 ℃. The absorbance was measured using Synergy H4 Hybrid Microplate Reader (BioTek) at 450 nm. The absorbance of cells treated with 0.1% DMSO was considered as 100% and the IC50 represented the concentration that inhibited cell proliferation by 50%. Taxol was used as the positive control [18–20].
3.8 Cell apoptosis
Apoptosis was determined by flow cytometric analysis of Annexin V-FITC/PI staining [21]. Briefly, the PANC-1 cells were cultured for 24 h in 6 well plates. When the cells grew to a density of 2 × 10⁵ cells/mL, compound 8 (0.5, 1 and 2 μM) was added for 48 h. The cells were washed 1–2 times with phosphate buffered saline (PBS) and then centrifuged at 3400 r/min for 5 min. The cells were suspended with 195 μL Annexin V-FITC binding solution, 5 μL Annexin V-FITC, and 10 μL PI staining solution, and mixed gently. After that, the cells were incubated at room temperature for 20 min under light protection and detected by flow cytometer [22, 23].
3.9 Cell cycle
Different phases of the cell cycle distribution were determined by the PI Flow Cytometry Kit, based on the manufacturer’s protocol. Briefly, after incubated with compound 8 (0.5, 1 and 2 μM) for 48 h, cells were washed twice with PBS, and fixed with ice-cold 70% ethanol. After rinsed with PBS, cells were further treated with RNase and PI at room temperature for 30 min in the dark. Then, the flow cytometer was used to analyze samples [24, 25].
3.10 Transwell assay
Transwell assay was used to evaluate the ability of compound 8 to prevent PANC-1 cell invasion in vitro. Cells were inoculated on 12 well plates with 1 × 10⁵ cells/mL per well. After 48 h treatment with 0.5, 1 and 2 μM compound 8, the cells were digested and transferred to the upper compartment of the transwell cell coated with matrix glue. The medium containing 20% fetal bovine serum was added to the lower chamber, and it was discarded after 24 h culture. Afterwards, the invaded cells were added with 4% paraformaldehyde for fixation for 15 min, 0.1% crystal violet for staining for 30 min at room temperature and washed with PBS buffer for 3 times. The cells were observed under the optical microscope [26, 27].
3.11 Immunofluorescence analysis
Compound 8-treated PANC-1 cells were washed twice with cold PBS, fixed with 4% cold paraformaldehyde for 15 min, and permeated with 0.1% Triton X-100 for 15 min. Next, the cells were blocked with 5% BSA for 1 h and incubated with primary antibody overnight at 4 ℃. Alexa-conjugated secondary antibodies were applied and incubated at room temperature for 1 h. Cell nuclei were stained with 4,6-diamino-2-phenyl indole (DAPI, Cell Signaling Technology, MA, USA) for 10 min. Finally, the cell images were analyzed by ImageXpress® Micro Confocal [11, 28].
3.12 Statistical analysis
All the experiments were carried out in triplicate and the data were carefully analyzed with the statistical software GraphPad Prism. The data were statistically analyzed with one-way ANOVA followed by the Dunnett's posthoc test, and the level of statistical significance was considered to be P < 0.05. The data were expressed as mean ± SD.
4 Conclusion
Sesquiterpenoids and their dimers were reported to exhibit diverse pharmacological activities, including antitumor and anti-inflammatory effects, and they were a group of effective and low-toxicity natural small molecules [29–31]. Guaiane-type dimers were primarily isolated from plants of the Inula and Artemisia genera [32]. Lavandiolide H, isolated from Artemisia atrovirens, exerted anti-hepatoma effects via inhibition of cell migration and invasion, and induction of G2/M phase cell cycle arrest and apoptosis. The molecular mechanism involved the downregulation of BCL-2 and PARP-1 expression, and PARP-1 activation, leading to the accumulation of cleaved-PARP-1 [33]. Pharmacological studies revealed that lineariifolianoid A, isolated from Inula lineariifolia, inhibited breast cancer proliferation by targeting the p53-independent NFAT1-MDM2 pathway. It also displayed modulatory effects on the expression of key proteins involved in cell cycle progression, apoptosis, and DNA damage [34, 35]. Inulanolide A, isolated from Inula japonica, was also identified as a dual inhibitor of the NFAT1-MDM2 pathway. It demonstrated potent anti-proliferative and anti-metastatic activities against breast and prostate cancer in both in vitro and in vivo models [36]. Due to their potential anti-tumor activity and complex structures, guaiane-type dimers attracted considerable research interest.
In this study, twenty-two dimeric guaianes including sixteen new compounds were isolated from branches and leaves of X. vielana and identified by NMR spectroscopic data, HR-ESI–MS data, X-ray diffraction analyses, and ECD spectra. Sixteen new compounds were tested for their cytotoxic activities and five of them showed good cytotoxic activities. Compound 8 had a relatively stronger cytotoxic effect against PANC-1 and PC-3 cell lines with IC50 values of 1.06 and 9.1 μM, respectively.
In apoptosis assay, compound 8 could induce PANC-1 cell apoptosis. Next, we found that the cell cycle of PANC-1 cells was arrested at S phase by the treatment of compound 8. By the invasion test, compound 8 was found to restrain the invasion of PANC-1 cells. In autophagy assay, we observed increased LC3 by immunofluorescence in the compound 8-treated group. In conclusion, compound 8 had a relatively good cytotoxic effect on PANC-1 cells and could be considered as a potential candidate compound.
The structure–activity relationships (SAR) were analyzed based on the cytotoxicity data of the compounds. The activity of compound 7, compared to the inactive compound 1, underscored the necessity of the double bond in unit B for cytotoxic activity. The contrast between the active compound 9 and the inactive compound 3 established the absolute configuration of unit B as a critical determinant of activity. Furthermore, the activity of compound 12 relative to compound 10 demonstrated the central role of the C-2' acetoxy group in suppressing the proliferation of PANC-1 and PC-3 cell lines. The analysis of the structure–activity relationships provides a foundation for the enhancement of the activity of such dimers through structural modification. In summary, the guaiane-type dimers represent a class of promising antitumor lead compounds.
Notes
Acknowledgements
This work was sponsored by the National Natural Science Foundation of China (Grant Number 82073724), Sub-project of Joint Funds of National Natural Science Foundation of China (Grant Number U20A20401), and Special Fund for Youth Team of Southwest University (Grant Number SWU—XJLJ202306).
Author contributions
Xianglian Jiang: writing, original draft, validation, data curation, formal analysis; Ting Zhang: writing, original draft, investigation, methodology, software; Fancheng Meng: software, methodology; Min Chen: resources, conceptualization; Guowei Wang: writing, review and editing, formal analysis, supervision, funding acquisition. All authors read and approved the final manuscript.
Data availability
Data will be made available on request.
Declarations
Competing interests
The authors declare that they have no known competing financial interests or personal relationships that could have appeared to influence the work reported in this paper.
References
-
1.Chen L, Yang P, Zhang M, Dai WF. Two new sesquiterpenes from Xylopia vielana. Nat Prod Res. 2023;37(7): 1199-204. CrossRef PubMed Google Scholar
-
2.Guo YG, Ding YH, Wu GJ, Zhu SL, Sun YF, Yan SK, et al. Three new alkaloids from Xylopia vielana and their antiinflammatory activities. Fitoterapia. 2018;127: 96-100. CrossRef PubMed Google Scholar
-
3.Guo YG, Xie YG, Wu GJ, Cheng TF, Zhu SL, Yan SK, et al. Xylopidimers A-E, five new guaiane dimers with various carbon skeletons from the roots of Xylopia vielana. ACS Omega. 2019;4(1): 2047-52. CrossRef PubMed Google Scholar
-
4.Kamperdick C, Phuong NM, Van Sung T, Adam G. Guaiane dimers from Xylopia vielana. Phytochemistry. 2001;56: 335-40. CrossRef PubMed Google Scholar
-
5.Kamperdick C, Phuong NM, Adam G, Van Sung T. Guaiane dimers from Xylopia vielana. Phytochemistry. 2003;64: 811-6. CrossRef PubMed Google Scholar
-
6.Xie YG, Guo YG, Wu GJ, Zhu SL, Cheng TF, Zhang Y, et al. Xylopsides A-D, four rare guaiane dimers with two unique bridged pentacyclic skeletons from Xylopia vielana. Org Biomol Chem. 2018;16(37): 8408-12. CrossRef PubMed Google Scholar
-
7.Xie YG, Wu GJ, Cheng TF, Zhu SL, Yan SK, Jin HZ, et al. Vielopsides A-E, five new guaiane-type sesquiterpenoid dimers from Xylopia vielana. Fitoterapia. 2018;130: 43-7. CrossRef PubMed Google Scholar
-
8.Xie YG, Zhang WY, Zhu SL, Cheng TF, Wu GJ, Muhammad I, et al. Xyloplains A-F, six new guaiane-type sesquiterpenoid dimers from Xylopia vielana. RSC Adv. 2018;8(45): 25719-24. CrossRef PubMed Google Scholar
-
9.Xie YG, Yan R, Zhong XL, Piao H, Muhammad I, Ke XS, et al. Xylopins A-F, six rare guaiane dimers with three different connecting modes from Xylopia vielana. RSC Adv. 2019;9(16): 9235-42. CrossRef PubMed Google Scholar
-
10.Xie YG, Zhong XL, Xiao YZ, Zhu SL, Muhammad I, Yan SK, et al. Vieloplains A-G, seven new guaiane-type sesquiterpenoid dimers from Xylopia vielana. Bioorg Chem. 2019;88: 102891. CrossRef PubMed Google Scholar
-
11.Xu QQ, Zhang C, Zhang YL, Lei JL, Kong LY, Luo JG. Dimeric guaianes from leaves of Xylopia vielana as snail inhibitors identified by high content screening. Bioorg Chem. 2021;108: 104646. CrossRef PubMed Google Scholar
-
12.Zhang YL, Zhou XW, Wang XB, Wu L, Yang MH, L J, et al. Xylopiana A, a dimeric guaiane with a case-shaped core from Xylopia vielana: structural elucidation and biomimetic conversion. Org Lett. 2017;9(11): 3013-6. CrossRef PubMed Google Scholar
-
13.Zhang YL, Xu QQ, Zhou XW, Wu L, Wang XB, Yang MH, et al. Rare dimeric guaianes from Xylopia vielana and their multidrug resistance reversal activity. Phytochemistry. 2019;158: 26-34. CrossRef PubMed Google Scholar
-
14.Halgren TA. MMFF Ⅵ. MMFF94s option for energy minimization studies. J Comput Chem. 1999;20(7): 720-9. PubMed Google Scholar
-
15.Bruhn T, Schaumoffel A, Hemberger Y, Bringmann G. SpecDis: quantifying the comparison of calculated and experimental electronic circular dichroism spectra. Chirality. 2013;25(4): 243-9. CrossRef PubMed Google Scholar
-
16.Wu WY, Wei X, Liao Q, Fu YF, Wu LM, Li L, et al. Structurally diverse polyketides and alkaloids produced by a plant-derived fungus Penicillium canescens L1. Nat Prod Bioprospect. 2025;15(1): 22. CrossRef PubMed Google Scholar
-
17.Chen YM, Cao NK, Zhu SS, Ding M, Liang HZ, Zhao MB, et al. Euchrestifolines A-O, fifteen novel carbazole alkaloids with potent anti-ferroptotic activity from Murraya euchrestifolia. Nat Prod Bioprospect. 2025;15(1): 5. CrossRef PubMed Google Scholar
-
18.Gao HL, Xia YZ, Zhang YL, Yang L, Kong LY. Vielanin P enhances the cytotoxicity of doxorubicin via the inhibition of PI3K/Nrf2-stimulated MRP1 expression in MCF-7 and K562 DOX-resistant cell lines. Phytomedicine. 2019;58: 152885. CrossRef PubMed Google Scholar
-
19.Tan Q, Hu K, Li XN, Yang XZ, Sun HD, Puno PT. Cytotoxic C-20 non-oxygenated ent-kaurane diterpenoids from Isodon wardii. Bioorg Chem. 2023;135: 106512. CrossRef PubMed Google Scholar
-
20.Wu Y, Zhang B, Li W, Peng L, Qiao W, Li W, et al. Asprecosides A-J, ten new pentacyclic triterpenoid glycosides with cytotoxic activity from the roots of Ilex asprella. Nat Prod Bioprospect. 2025;15(1): 18. CrossRef PubMed Google Scholar
-
21.Wei R, Zhao Y, Wang J, Yang X, Li S, Wang Y, et al. Tagitinin C induces ferroptosis through PERK-Nrf2-HO-1 signaling pathway in colorectal cancer cells. Int J Biol Sci. 2021;17(11): 2703-17. CrossRef PubMed Google Scholar
-
22.Kim GJ, Yang EJ, Kim YS, Moon J, Son YK, Nam JW, et al. Diterpene and biflavone derivatives from Thuja koraiensis and their cytotoxicities against A549 cells. Phytochemistry. 2023;211: 113711. CrossRef PubMed Google Scholar
-
23.Liu L, Shi D, Xia ZY, Wang BW, Wang XL, Wang XT, et al. Gamabufotalin induces apoptosis and cytoprotective autophagy through the mTOR signaling pathway in hepatocellular carcinoma. J Nat Prod. 2023;86(4): 966-78. CrossRef PubMed Google Scholar
-
24.Matthews HK, Bertoli C, de Bruin RAM. Cell cycle control in cancer. Nat Rev Mol Cell Biol. 2022;23(1): 74-88. CrossRef PubMed Google Scholar
-
25.Yang C, Chen XC, Li ZH, Wu HL, Jing KP, Huang XR, et al. SMAD3 promotes autophagy dysregulation by triggering lysosome depletion in tubular epithelial cells in diabetic nephropathy. Autophagy. 2021;17(9): 2325-44. CrossRef PubMed Google Scholar
-
26.He XF, Li QH, Li TZ, Ma YB, Dong W, Yang KX, et al. Artemeriopolides A-D, two types of sesquiterpenoid dimers with rare carbon skeletons from Artemisia eriopoda and their antihepatoma cytotoxicity. Org Chem Front. 2023;10(11): 2635-41. CrossRef PubMed Google Scholar
-
27.Xu HY, Liu JQ, Li XK, Li JW, Lin X, Li ZW, et al. Instrumental and transcriptome analysis reveals the chemotherapeutic effects of doxorubicin-loaded black phosphate nanosheets on abiraterone-resistant prostate cancer. Bioorg Chem. 2023;137: 106583. CrossRef PubMed Google Scholar
-
28.Lee SY, Choi SH, Kim Y, Ahn HS, Ko YG, Kim K, et al. Migrasomal autophagosomes relieve endoplasmic reticulum stress in glioblastoma cells. BMC Biol. 2024;22(1): 23. CrossRef PubMed Google Scholar
-
29.Hilmi F, Gertsch J, Bremner P, Valovic S, Heinrich M, Sticher O, et al. Cytotoxic versus anti-inflammatory effects in HeLa, Jurkat T and human peripheral blood cells caused by guaianolide-type sesquiterpene lactones. Bioorg Med Chem. 2003;11(17): 3659-63. CrossRef PubMed Google Scholar
-
30.Rozenblat S, Grossman S, Bergman M, Gottlieb H, Cohen Y, Dovrat S. Induction of G2/M arrest and apoptosis by sesquiterpene lactones in human melanoma cell lines. Biochem Pharmacol. 2008;75(2): 369-82. CrossRef PubMed Google Scholar
-
31.Xue GM, Zhu DR, Zhu TY, Wang XB, Luo JG, Kong LY. Lactone ring-opening seco-guaianolide involved heterodimers linked via an ester bond from Artemisia argyi with NO inhibitory activity. Fitoterapia. 2019;132: 94-100. CrossRef PubMed Google Scholar
-
32.Ma LF, Chen YL, Shan WG, Zhan ZJ. Natural disesquiterpenoids: an update. Nat Prod Rep. 2020;37(7): 999-1030. CrossRef PubMed Google Scholar
-
33.Su L, Zhang X, Ma Y, Geng C, Huang X, Hu J, et al. New guaiane-type sesquiterpenoid dimers from Artemisia atrovirens and their antihepatoma activity. Acta Pharm Sin B. 2021;11(6): 1648-66. CrossRef PubMed Google Scholar
-
34.Qin JJ, Sarkar S, Voruganti S, Agarwal R, Wang W, Zhang R. Identification of lineariifolianoid A as a novel dual NFAT1 and MDM2 inhibitor for human cancer therapy. J Biomed Res. 2016;30(4): 322-33. CrossRef PubMed Google Scholar
-
35.Qin JJ, Li X, Wang W, Zi X, Zhang R. Targeting the NFAT1-MDM2-MDMX network inhibits the proliferation and invasion of prostate cancer cells, independent of p53 and androgen. Front Pharmacol. 2017;8: 917. CrossRef PubMed Google Scholar
-
36.Qin JJ, Wang W, Sarkar S, Voruganti S, Agarwal R, Zhang R. Inulanolide A as a new dual inhibitor of NFAT1-MDM2 pathway for breast cancer therapy. Oncotarget. 2016;7(22): 32566-78. CrossRef PubMed Google Scholar
Copyright information
© The Author(s) 2026.
Open Access This article is licensed under a Creative Commons Attribution 4.0 International License, which permits use, sharing, adaptation, distribution and reproduction in any medium or format, as long as you give appropriate credit to the original author(s) and the source, provide a link to the Creative Commons licence, and indicate if changes were made. The images or other third party material in this article are included in the article’s Creative Commons licence, unless indicated otherwise in a credit line to the material. If material is not included in the article’s Creative Commons licence and your intended use is not permitted by statutory regulation or exceeds the permitted use, you will need to obtain permission directly from the copyright holder. To view a copy of this licence, visit http://creativecommons.org/licenses/by/4.0/.