
Novel polycyclic meroterpenoids with protein tyrosine phosphatase 1B inhibitory activity isolated from desert-derived fungi Talaromyces sp. HMT-8

Abstract
Seven previously undescribed polycyclic meroterpenoids talarines K–Q (1–7), along with five known ones (8–12), were isolated from desert-derived fungi Talaromyces sp. HMT-8. The structure of the novel compounds were elucidated using spectroscopic methods, including electronic circular dichroism (ECD), HRESIMS and nuclear magnetic resonance (NMR) spectroscopy. Among the isolated meroterpenoids, compounds 3, 5, and 7 exhibited rare chlorine substitution patterns. Halogenation, particularly chlorination, is uncommon in natural meroterpenoids and implies the involvement of halogenase enzymes during biosynthesis. Compounds 1–12 were evaluated for their inhibitory activity against protein tyrosine phosphatase 1B (PTP1B). Compounds 1–4 and 12 exhibited inhibitory activity against PTP1B with IC₅₀ values ranging from 1.74 to 17.60 μM. Among them, compounds 2 and 12 displayed significant inhibitory effects with an IC₅₀ value of 1.74 and 3.03 μM, respectively. Furthermore, Molecular docking analysis revealed that compounds 2 and 12 bind tightly to the catalytic site of PTP1B, forming key hydrogen bonding and hydrophobic interactions. Enzyme kinetics studies further demonstrated that both compounds act as competitive inhibitor.Graphical Abstract
Keywords
Talaromyces sp. Polycyclic meroterpenoids PTP1B Enzyme kinetics Molecular docking1 Introduction
The meroterpenoids are a highly diverse class of natural products. They are hybrid natural products, partially derived from the terpenoid biosynthetic pathway, exhibiting diverse core structures, among which some feature a C3-oxidized drimane skeleton [1, 6]. Recently, meroterpenoids have attracted attention due to their rich chemical diversity and biological activities. In the past decade, only 26 methoxysteroids, constructed from drimane-type sesquiterpenoid units and C10 polyketide moieties, have been reported [2-7]. Previous studies have indicated that Talaromyces sp. could produce secondary metabolites such as meroterpenoids, polyketides and furanosteroids with novel chemical structures. The meroterpenoids isolated from Talaromyces sp. contain polycyclic skeletons and exhibit significant in vitro enzyme inhibitory and antiviral activities [8, 9] (Figs. 1, 2, 3, 4, 5, 6).
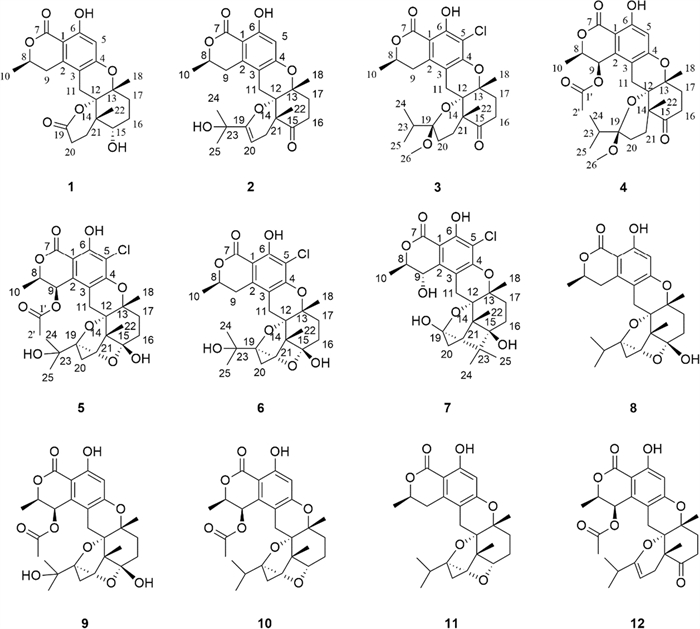
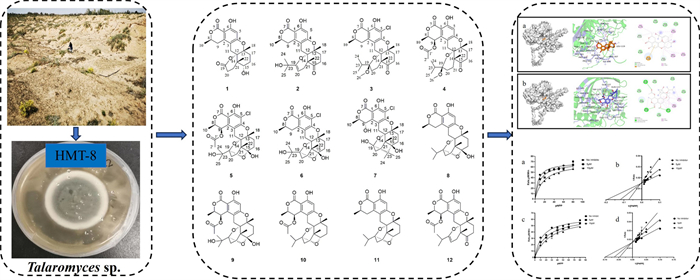
Chemical structures of 1–12 isolated from HMT-8
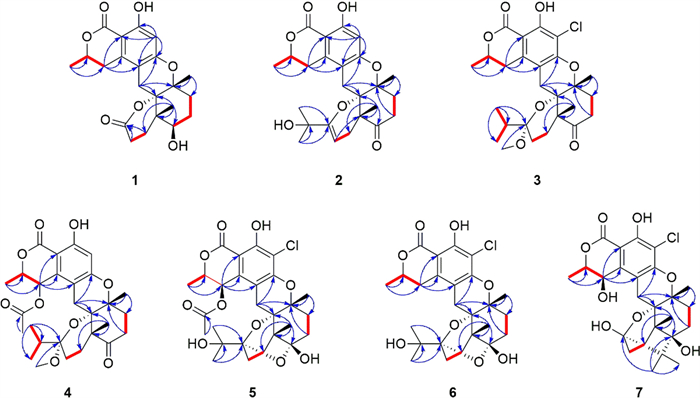
Key HMBC (blue arrow) and1H-1H COSY (bold red line) correlations of 1–7
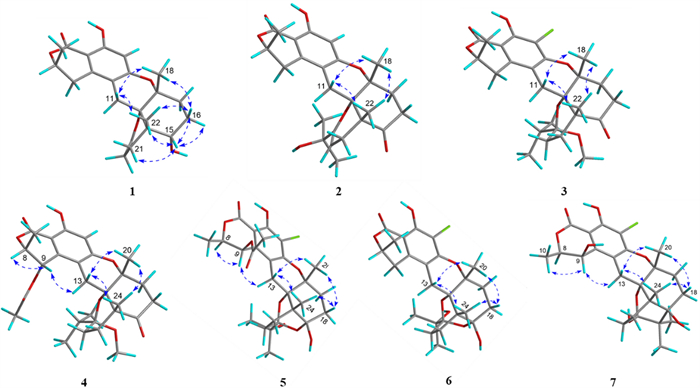
Key NOESY (double blue arrows) correlations of 1–7
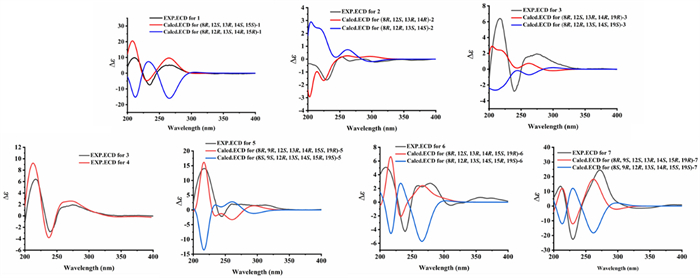
Comparison of experimental and calculated ECD spectra of 1–7
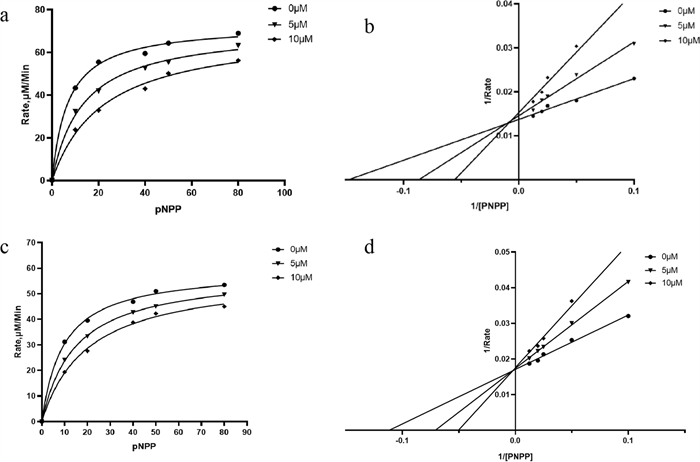
Kinetic analysis of the inhibition of PTP1B by 2 (a, b) and 12 (c, d)
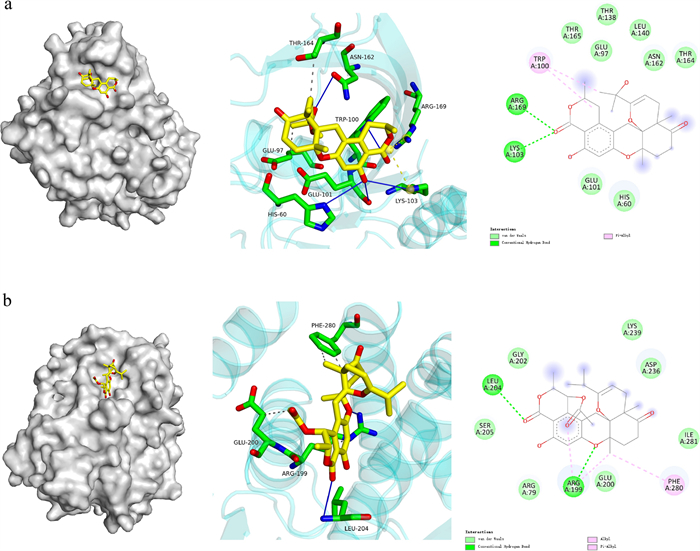
Molecular docking pictures of compounds 2 (a) and 12 (b)
Protein tyrosine phosphatase-1B (PTP1B) is a member of the protein tyrosine phosphatase (PTP) family and is localized in the endoplasmic reticulum of cells in tissues such as adipose and liver [10]. PTP1B plays an essential role across various physiological pathways, including cell proliferation, apoptosis, and differentiation [11]. The PTP1B functions by dephosphorylating insulin and leptin receptors, thereby inducing their inactivation [12, 13]. Inhibitors targeting this enzyme hold therapeutic promise for managing type 2 diabetes and obesity. Therefore, bioactive compounds with PTP1B inhibitory activity may exhibit enhanced therapeutic efficacy in the treatment of type 2 diabetes.
Finding bioactive compounds from natural products has become one of the important ways to develop innovative drugs. The extensive pharmacological activities and structural diversity of fungal natural products have attracted the attention of researchers [14]. We have been dedicated to discovering novel bioactive compounds from fungi. In this work, a desert-derived fungi Talaromyces sp. HMT-8 was isolated from soil collected in Alashan region in the west of Inner Mongolia Autonomous Region of China. The chemical investigation on HMT-8 led to the identification of seven novel polycyclic meroterpenoids talarines K–Q (1–7) and five known ones (8–12). All the isolated compounds were tested for their inhibitory activities against PTP1B. Many of these meroterpenoids exhibited inhibitory activities. This paper reports on the isolation, structural elucidation and PTP1B inhibitory activity of polycyclic meroterpenoids extracted from Talaromyces sp. HMT-8.
2 Results and discussion
2.1 Structure elucidation
Compound 1 displayed the molecular formula, C22H26O7, by analysis of its HREISMS data ([M + H]+ m/z 403.1748, calcd for C22H27O7, 403.1757), indicating 10 degrees of unsaturation. The1H NMR data (Table 2) of 1 showed resonances for one aromatic proton at δH 6.24 (1H, s, H-5), two oxygenated methine protons at δH 4.66 (1H, m, H-8) and 3.67 (1H, t, J = 3.0 Hz, H-15), and three methyl groups at δH 1.51 (3H, d, J = 6.5 Hz, H3-10), 1.40 (3H, s, H3-18), and 1.04 (3H, s, H3-22). The13C NMR data (Table 1) of 1 showed a total of 22 carbon signals, including two ester carbonyls at δC 176.7 (C-19) and 171.9 (C-7), six aromatic carbons assignable to a benzene ring, six methylenes, two methines (including one oxygenated), three non-protonated carbons (including two oxygenated), and three methyls. The planar structure of 1 was further elucidated by 2D-NMR spectroscopic analysis. The1H−1H COSY correlations (Fig. 2) of H3-10/H-8/H-9 together with the HMBC correlations (Fig. 2) from H-9 to C-2, C-3, and C-11, and from H-5 to C-1, C-3, C-4, and C-6 confirmed the presence of the isochromanone moiety. The HMBC correlations from H2-11 to C-4, C-12, and C-13, from H3-18 to C-13 and C-17, from H3-22 to C-12, C-14, C-15, and C-21, and from H2-20 to C-19, along with the1H −1H COSY correlations of H2-17/H2-16/H-15 and H2-10/H2-21 established the remaining nor-sesquiterpene moiety. Therefore, the planar structure of 1 was determined, as depicted in Fig. 1.
The13C NMR (150 MHz, CD3OD) spectroscopic data for compounds 1–7
The relative configuration of 1 was determined by NOESY experiment. The NOESY cross peaks (Fig. 3) of H3-22/H-16β (δH 1.97), H3-18/H-16β, H3-18/H-11β (δH 2.68), H3-22/H-11β, and H3-22/H-15 indicated that H-15, H3-18, and H3-22 were β-orientations; simultaneously, C-12 was assigned as S*-configuration. The absolute configuration at C-8 was proposed as R based on the biosynthetic origin [5, 15]. The calculated electronic circular dichroism (ECD) curve (Fig. 4) for compound 1 corresponded well with the experimental ECD curve, indicating its absolute configuration as 8R,12S,13R,14S,15S. Therefore, compound 1 was named talarine K.
Compound 2 possessed a molecular formula C25H30O7, as determined by the HRESIMS data ([M + H]+ m/z 443.2061, calcd for C25H31O7, 443.2070). The1H NMR spectrum of 2 displayed characteristic signals including one oxygen-bearing methine proton at δH 4.57 (1H, m, H-8), and five distinct methyl signals (four singlets and one doublets). The13C NMR spectra of 2 showed 25 carbon resonances, including two carbonyl carbons (one ester carbonyl at δC 171.7 and one keto carbonyl δC 211.1), eight olefinic carbons containing a benzene ring, four nonprotonated carbons at δC 81.0 (C-12), 79.1 (C-13), 71.5 (C-23), and 50.4 (C-14), five methylenes at δC 34.7 (C-16), 34.5 (C-17), 31.9 (C-9), 28.7 (C-21), and 22.6 (C-11), one oxygenated methine at δC 76.5 (C-8), and five methyls at δC 27.9 (C-25), 27.8 (C-24), 24.3 (C-22), 23.5 (C-18), and 20.9 (C-10). The NMR data (Tables 1 and 2) of 2 closely resembled those of talaromyolide I [6], with the main difference being the presence of an oxygenated non-protonated carbon (C-23) and the absence of an oxygenated methine group (C-9), as supported by the HMBC correlations (Fig. 2) from H3-25 to C-23 and the1H−1H COSY correlations (Fig. 2) of H3-10/H-8/H2-9. The cross-peaks of H3-18/H3-22/H-11β (δH 2.84) established the relative configuration of 2. The absolute configuration of compound 2 was determined by comparing its experimental ECD spectrum with the calculated spectra (Fig. 4), confirming the assignment as 8R, 12S, 13R, 14R. Accordingly, it was named talarine L.
The1H NMR (600 MHz, CD3OD, J in Hz)) spectroscopic data for compounds 1–7
Compound 3 was purified as a colorless oil, and its HRESIMS analysis ([M − H]− m/z 491.1837, calcd for C26H32ClO7, 491.1843) indicated a molecular formula C26H33ClO7. The1H NMR spectral data (Table 2) of 3 showed one oxygenated methine proton at δH 4.72 (1H, m, H-8), five methyl signals (two singlets and three doublets), as well as a methoxyl signal at δH 2.57 (3H, s, H3-26). The13C NMR spectrum (Table 1) revealed the presence of 26 carbon signals, including two carbonyl carbons (one ester carbonyl and one keto carbonyl), six aromatic carbons, one ketal carbon at δC 104.4 (C-19), one oxygenated methine at δC 76.7 (C-8), six methylenes, three nonprotonated carbons containing two oxygenated at δC 81.5 (C-13) and 79.1 (C-12), and six methyls including an oxygenated at δC 48.7 (C-26). Detailed analyses of the above NMR data suggested that the structure of 3 was similar to that of 2, with the main difference being the presence of a methoxyl group (C-26), a methine group (C-23), and a methylene group (C-20), coupled with the absence of two olefinic carbons and the singlet H-5 proton signal, as supported by the HMBC correlations (Fig. 2) from H3-24 to C-19, C-23, and C-25, and the1H−1H COSY correlations (Fig. 2) of H3-24/H-23/H3-25, combined with the molecular formula. Finally, the relative configuration of 3 was determined by the cross peaks of H3-18/H-11β (δH 2.85)/H3-22. To determine the configuration at C-19, DFT calculations of1H and13C NMR chemical shifts were performed for four possible diastereomers (see SI). Subsequent DP4 + analysis (Fig. S50) revealed that the C-19 stereocenter as R. The absolute configuration of 3 was determined from ECD spectrum in comparison to calculated spectra (Fig. 4), confirming the absolute configuration of (8R,12S,13R,14R,19R)-3. Therefore, compound 3 was named talarine M.
Compound 4 had a molecular formula C28H36O9, as disclosed by the HRESIMS spectrum ([M + H]+ m/z 517.2438, calcd for C28H37O9, 517.2435). The1H NMR spectral data (Table 2) of 4 showed two oxygen-bearing methine protons at δH 6.19 (1H, d, J = 2.0 Hz, H-9) and 4.85−4.79 (1H, m, H-8), an aromatic proton signal at δH 6.46 (1H, s, H-5), five methyl signals (two singlets and three doublets), as well as a methoxyl signal at δH 2.59 (3H, s). The13C NMR spectrum (Table 1) showed a total of 28 carbon signals, including three carbonyl carbons (two ester carbonyls and one keto carbonyl), six aromatic carbons, one ketal carbon at δC 104.4 (C-19), two oxygen-bearing methines at δC 77.5 (C-9) and 65.6 (C-8), five methylenes at δC 36.1 (C-16), 32.8 (C-17), 26.7 (C-21), 26.2 (C-11), and 24.7 (C-20), three nonprotonated carbons containing two oxygenated at δC 80.7 (C-13) and 78.9 (C-12), and six methyls including an oxygenated at δC 49.0 (C-26). These1H and13C NMR data closely resembled those of 3, suggesting that their structures were closely related. The key structural distinction was characterized by the presence of an acetyl group, an oxygenated methine group, and the H-5 singlet proton signal, concomitant with the absence of both a methylene group and a non-protonated aromatic carbon in 4. The HMBC correlations (Fig. 2) from H3-2′ to C-1′, and from H-9 to C-1′, as well as the1H −1H COSY correlations (Fig. 2) of H3-10/H-8/H-9, confirmed that the C-9 methylene group in 3 was replaced by an acetyl group in 4. Therefore, the planar structure of 4 was assigned, and its relative configuration was determined according to the NOESY correlations (Fig. 3) of H3-18/H-11β (δH 2.78)/H3-22, H-9/H-11α (δH 3.72), and H-9/H-8. A strong NOE correlation is observed between H-9 and H-8, along with a weak correlation between H-9 and H-10, implying that H-9 and H-8 reside on the same face of the six-membered ring. The configuration at C-19 was established by DP4 + probability analysis based on calculated1H and13C NMR chemical shifts of four possible diastereomers, which indicated that structure 4–2 (see SI) best matched the experimental data with 100% probability, supporting the assignment of the C-19 stereocenter as R. The similar ECD spectra of indicated that compounds 3 and 4 share absolute configurations, so confirming the absolute configuration of (8R,12S,13R,14R,19R)-4. Therefore, compound 4 was named talarine N.
Compound 5 was isolated as a colorless oil, whose molecular formula was established as C27H33ClO10 by the HRESIMS data ([M + H]+ m/z 553.1841, calcd for C27H34O10Cl, 553.1829), bearing one more chlorine substituent than talaromyolide H [7]. The1H NMR data (Table 2) of 5 showed two oxygen-bearing methine protons at δH 6.25 (1H, d, J = 1.9 Hz, H-9) and 4.84 (1H, m, H-8), one acetyl signal at δH 2.12 (3H, s, H-2’), and five methyl signals (four singlets and one doublet). The13C NMR data of 5 (Table 1) exhibited 27 carbon resonances, including two ester carbonyl carbons at δC 171.8 (C-1’) and 170.6 (C-7), six aromatic carbons assignable to a benzene ring, two ketal carbons at δC 100.5 (C-19) and 99.8 (C-15), two oxygen-bearing methines at δC 77.8 (C-8) and 65.4 (C-9), five methylenes at δC 32.8 (C-17), 32.1 (C-16), 28.1 (C-11), 25.3 (C-20), and 23.7 (C-21), four nonprotonated carbons including three oxygenated at δC 81.9 (C-13), 78.5 (C-12), and 74.5 (C-23), and six methyls at δC 24.8 (C-24), 24.6 (C-25), 24.0 (C-18), 20.4 (C-2’), 19.2 (C-22), and 16.5 (C-10). These data suggested that 5 was a polycyclic meroterpenoid possessing a seco-drimane unit and an isocoumarin core structure, similar to that of talaromyolide H. The main difference between them lied in the disappearance of the singlet proton signal. HMBC correlations from H-9 to C-1, C-2, and C-3, and from H2-11 to C-4, C-12, and C-13, along with the1H−1H COSY correlations of H3-10/H-8/H-9 were observed. The above data, with the aid of a molecular formula that showed the presence of a Cl atom, assigned 5 as 5-chlorotalaromyolide H. The relative configuration of 5 was determined to be the same as that of talaromyolide H based on the key NOESY correlations (Fig. 3) of H3-18/H-11β (δH 2.90), H3-22/H-11β, H3-18/H-16β (δH 1.97), H3-22/H-16β, and H-9/H-11α (δH 3.02). A strong NOE between H-9 and H-8, together with a weaker interaction with H-10, indicates that H-9 and H-8 are located on the same face of the six-membered ring. The absolute configuration of compound 5 was determined as 8R, 9R, 12S, 13R, 14R, 15S, 19R through comparative analysis of the experimental ECD spectrum (Fig. 4) with the calculated ECD spectrum. Therefore, compound 5 was named talarine O.
Compound 6, a colorless oil, exhibited the molecular formula C25H31ClO8 according to the HRESIMS data ([M + H]+ m/z 495.1775, calcd for C25H32O8Cl, 495.1786). The1H NMR data (Table 2) displayed resonances for one oxygen-bearing methine protons at δH 4.70 (1H, m, H-8), and five methyl protons (four singlets and one doublet). The13C NMR data (Table 1) showed a total of 25 carbon signals, including an ester carbonyl carbon at δC 171.7 (C-7), six aromatic carbons at δC 158.7 (C-6), 156.9 (C-4), 139.3 (C-2), 111.8 (C-3), 108.5 (C-5), and 103.0 (C-1), two ketal carbons at δC 100.5 (C-19) and 99.9 (C-15), one oxygen-bearing methine at δC 76.8 (C-8), six methylenes at δC 32.9 (C-17), 32.1 (C-16), 31.6 (C-9), 28.4 (C-11), 25.4 (C-20), and 23.7 (C-21), four nonprotonated carbons including three oxygenated at δC 81.5 (C-13), 78.8 (C-12), and 74.6 (C-23), and five methyls at δC 24.8 (C-24), 24.5 (C-25), 23.9 (C-18), 20.9 (C-10), and 19.2 (C-22). These data were nearly identical with those of 5, except for the absence of an acetyl group at C-9, as proved by the1H−1H COSY correlations (Fig. 2) of H3-10/H-8/H2-9 along with the HMBC correlations from H3-10 to C-8 and C-9. Additionally, the NOESY correlations (Fig. 3) of H3-18/H-11β (δH 2.92), H3-22/H-11β, H3-18/H-16β (δH 1.97), and H3-22/H-16β indicated that 6 and 5 had similar relative configurations. The absolute configuration of 6 was determined by the experimental ECD spectrumin comparison to calculated spectra (Fig. 4), confirming the absolute configuration of (8R,12S,13R,14R,15S,19R)-6. Therefore, compound 6 was named talarine P.
Compound 7 was isolated as a colorless oil, whose molecular formula was established as C25H31ClO8 by HRESIMS ([M + H]+ m/z 495.1779, calcd for C25H32O8Cl, 495.1786). The1H NMR spectral data (Table 2) of 7 showed two oxygen-bearing methine protons at δH 4.70 (1H, d, J = 2.0 Hz, H-9) and 4.62 (1H, qd, J = 6.7, 1.8 Hz, H-8), as well as five methyl signals including four singlets at δH 1.35 (3H, s, H3-18), 1.19 (3H, s, H3-25), 1.06 (3H, s, H3-24), 1.02 (3H, s, H3-22), and one doublet at δH 1.57 (3H, d, J = 6.6 Hz, H3-10). The13C NMR data (Table 1) showed 25 carbons, containing one ester carbonyl carbon at δC 171.4 (C-7), six aromatic carbons, one ketal carbon at δC 100.9 (C-19), two oxygen-bearing methines at δC 79.4 (C-8) and 63.9 (C-9), five methylenes at δC 35.1 (C-17), 30.8 (C-20), 30.4 (C-16), 28.2 (C-11), and 26.6 (C-21), five nonprotonated carbons containing three oxygen-bearing at δC 82.3 (C-13), 79.4 (C-12), and 76.5 (C-15), and five methyls at δC 25.0 (C-24), 24.5 (C-18), 19.6 (C-22), 18.7 (C-25), and 16.5 (C-10). The comparative NMR analysis (Tables 1 and 2) between 7 and 6 demonstrated their structural congruence, with the notable exceptions of an oxygenated methine and nonprotonated carbon appearing in 7, while the ketal carbon and methylene group present in 6 were absent.1H−1H COSY correlations (Fig. 2) of H3-10/H-8/H-9 and HMBC correlations from H-9 to C-1, C-2, and C-3, indicated that C-9 methylene in 6 was replaced by the oxygenated methine in 7. Furthermore, the HMBC correlations from H3-24 to C-15, C-19, C-23, C-25, and H3-25 to C-15, C-23 suggested the linkage of C-15 and C-23. Finally, the relative configuration of 7 was further identified through the NOESY correlations (Fig. 3) of H3-10/H-9, H3-18/H-11β (δH 3.13), H-11β/H3-22, H3-18/H-16β (δH 1.81), H3-22/H-16β, and H-9/H-11α (δH 3.06). The absolute configuration of 7 was determined by the experimental ECD spectrumin comparison to calculated spectra (Fig. 4), confirming the absolute configuration of (8R,9S,12S,13R,14S,15R,19R)-7. Therefore, compound 7 was named talarine Q.
In addition to the seven novel compounds described above, five known compounds were also isolated (Fig. 1), including talaromyolide C (8) [6], talaromyolide H (9) [7], talarine C (10) [16], talarine A (11) [16] and talaromyolide J (12) [7]. All of these compounds were identified by comparing their1H and13C NMR data with those reported in the literatures.
2.2 PTP1B inhibitory activity evaluation
This study systematically investigated the antidiabetic potential of compounds (1–12) by evaluating their inhibitory activity against PTP1B (Table 3). The results revealed that compounds 2, 3, 5 and 12 exhibited significant inhibitory effects with IC50 values of 1.74, 8.54, 6.57, and 3.03 μM, respectively. Compared to the positive control sodium vanadate (Na3VO4, IC50 = 0.83 μM), compound 2 (IC50 = 1.74 μM) displayed superior inhibitory efficacy. Notably, compounds 1–4 and 12 (IC50 = 1.74–17.60 μM) feature a pentacyclic system, while other compounds form peroxide rings at the C-15 and C-19. The former group demonstrated higher inhibitory activity compared to the latter. This observation suggests that the presence of peroxide rings at the C-15 and C-19 diminishes the inhibitory effects on PTP1B (Table 3).
Inhibitory activities for compounds against PTP1B
2.3 Kinetic analysis and molecular docking
To further elucidate the inhibitory mechanisms of 2 and 12, which exhibit significant inhibitory activity against PTP1B (Table 3), kinetic analysis and molecular docking simulations were performed.
In the absence of the inhibitor, PTP1B catalyzed p-NPP with a Km of 6.82 μM (Fig. 5a). However, addition of compound 2 to the reaction shifted the Km to the right without affecting the Vmax. Accordingly, the Km was 13.31 μM and 22.13 μM at 5 μM and 10 μM compound 2, respectively. The Lineweaver–Burk or double-reciprocal plot further showed that 2 inhibits PTP1B competitively (Fig. 5b). These findings demonstrate that 2 was indeed a competitive PTP1B inhibitor. In the case of 12, PTP1B catalyzed p-NPP with a Km of 9.56 μM in control group (Fig. 5c). The trend lines (Fig. 5b and d) of 2 and 12 exhibit similarity and intersected on the Y-axis. A gradual increase in Km values accompanied by an unchanged Vmax indicated that compounds 2 and 12 were competitive inhibitors of PTP1B.
The binding interactions of 2 and 12 with PTP1B are depicted in Fig. 6. The molecular docking analysis of 2 (Fig. 6a) against PTP1B revealed a thermodynamically favorable binding profile (ΔG = − 8.0 kcal/mol), indicative of strong target engagement. Key stabilizing interactions included that 2 formed Van der Waals interactions with THR165/GLU97/THR138/LEU140/ASN162/THR164 /GLU101/HIS60. This indicated a π-alkyl interactions with TRP100, and established hydrogen bonds with ARG169/LYS103. In the case of 12 (Fig. 6b), the hydroxyl group and two carbonyl groups established hydrogen bonds with residues LEU204/ARG199, respectively. Additionally, A hydrophobic cluster comprising ARG199 (alkyl) and PHE280 (π-alkyl), and formed Van der Waals interactions with GLY202/LYS239/ASP236/ILE281/GLU200/ARG79.
3 Conclusions
In this study, twelve polycyclic meroterpenoids, including seven previously undescribed compounds (talarines K–Q), were isolated from the desert-derived fungus Talaromyces sp. HMT-8. Comprehensive structural elucidation was conducted using NMR, HRESIMS, and ECD techniques. Bioactivity assays demonstrated that several of these compounds exhibit notable inhibitory effects against PTP1B, an important therapeutic target for type 2 diabetes and obesity. Notably, compounds 2 and 12 showed potent PTP1B inhibition with IC₅₀ values of 1.74 and 3.03 μM, respectively, and were identified as competitive inhibitors through kinetic and molecular docking studies. These findings not only expand the chemical diversity of fungal meroterpenoids, but also highlight their potential as promising lead compounds for the development of novel antidiabetic agents.
4 Materials and methods
4.1 General experimental procedures
ECD spectra were measured on Bio-Logic MOS-450 spectropolarimeter. IR spectra were recorded on a Thermo Nicolet iS 10 spectrometer. The NMR spectra were recorded on a Bruker AM-600 spectrometer with TMS as an internal standard. HRESIMS spectra were obtained on a Thermo U3000 spectrometer fitted with an ESI source. Semipreparative HPLC was carried out using an ODS column (YMC-pack ODS-A, 10 × 250 mm, 5 μm, 2.5 mL/min). All solvents used were of analytical and chromatographic grade. Silica gel (200–300 mesh; Qingdao Haiyang Chemical Co., Ltd., Qingdao, Shandong, China), C18 reversed-phase silica gel (YMC ODS-A gel, YMC Co., Ltd., Kyoto, Japan).
4.2 Fungal material
The HMT-8 was isolated from the desert soil in Alashan region in the west of Inner Mongolia Autonomous Region of China. The strain was identified as Talaromyces sp. based on microscopic examination and by internal transcribed spacer (ITS1–4) sequencing. The ITS sequence has been deposited in GenBank (http://www.ncbi.nlm.nih.gov) with accession number No. PV436706. The purified strain was cultivated in a PDA medium plate (containing 200 g potatoes, boil 20 min, take filtrate; 20 g glucose; 20 g agar in 1 L water) at 28 ℃ for 7 days. Then, it was cut into small pieces and cultured in PDB medium plate (containing 200 g potatoes, boil 20 min, take filtrate; 20 g glucose; in 1 L water) for 5 days.
4.3 Fermentation, Extraction and Isolation
The fermentation was carried out in 400 flasks (500 mL), each containing 100 g of rice and 80 mL H2O, autoclaving at 15 psi for 30 min. After cooling to room temperature, each flask was inoculated with 20 mL of the spore inoculum and incubated at room temperature for 30 days.
The fermented material was extracted with EtOAc for three times, then the EtOAc solutions were combined and evaporated under reduced pressure to get 210 g of crude extract. The extract was fractionated by a silica gel VLC column using different solvents of increasing polarity, from EtOAc-petroleum ether (PE) to yield eleven fractions (Fr.1–11). Fr.4 was eluted with EtOAc-PE to obtain ten subfractions (Fr.4.1–4.10). Fr 4.3 was purified by a semipreparative reversed-phase (RP) HPLC column using MeCN/H2O = 43:57 (3 mL/min) to afford 7 (3.6 mg), 8 (4.9 mg) and 9 (6.2 mg). Fr 4.6 also purified by semi-preparative RP-HPLC using MeCN/H2O = 70:30 (3 mL/min) to yield 10 (5.7 mg) and 11 (4.8 mg). Fr.6 was separated using a silica gel VLC column (EtOAc-PE) to yield nine subfractions (Fr.6.1–6.9). Fr.6.2 was chromatographed by C18 reversed-phase (RP-18) silica gel using MeOH/H2O to collect subfractions (Fr.6.2.1–6.2.12). Fr.6.2.8 was separated by semi-preparative RP-HPLC using MeCN/H2O = 64:36 (3 mL/min) to afford 1 (5.4 mg), 2 (6.2 mg), 3 (5.7 mg), 4 (3.8 mg) and 5 (4.0 mg). Fr.6.2.11 was purified by semi-preparative RP-HPLC column using MeCN/H2O = 60:40 (4 mL/min) to afford 6 (4.6 mg). Fr.10 was purified by RP-18 using MeOH/H2O to collect six subfractions (Fr.10.1–10.6). Fr.10.3 and Fr.10.4 were also purified by semi-preparative RP-HPLC column using MeCN/H2O = 20:80 (3 mL/min) to afford 12 (5.2 mg).
Talarine K (1), yellow amorphous powder; [α]D25 –102 (c 0.1, MeOH); UV (MeOH) λmax (log ε): 223 (3.21) nm, 274 (4.01) nm, 309 (3.22) nm; ECD (MeOH) λmax (∆ε): 211 (+ 9.80), 235 (–7.50), 265 (5.13) nm; IR (KBr) νmax (cm−1): 2933, 1701, 1478, 1326, 1165;1H and13C NMR data, see Tables 1 and 2; HR-ESI–MS m/z: 403.1748 [M + H]+ (Calcd. for C22H27O7, 403.1757).
Talarine L (2), yellow amorphous powder; [α]D25 –93 (c 0.1, MeOH); UV (MeOH) λmax (log ε): 222 (3.01) nm, 278 (4.76) nm, 314 (3.15) nm; ECD (MeOH) λmax (∆ε): 229 (–1.62), 253 (+ 0.16), 267 (–0.14) nm; IR (KBr) νmax (cm−1): 2951, 1743, 1633, 1365, 1201;1H and13C NMR data, see Tables 1 and 2; HR-ESI–MS m/z: 443.2061 [M + H]+ (Calcd. for C25H31O7, 443.2070).
Talarine M (3), yellow amorphous powder; [α]D25 –112 (c 0.1, MeOH); UV (MeOH) λmax (log ε): 219 (3.33) nm, 277 (4.15) nm, 313 (3.66) nm; ECD (MeOH) λmax (∆ε): 217 (+ 2.40), 239 (− 2.80), 275 (+ 1.94) nm; IR (KBr) νmax (cm−1): 2941, 1745, 1620, 1255, 1113;1H and13C NMR data, see Tables 1 and 2; HR-ESI–MS m/z: 491.1837 [M − H]+ (Calcd. for C26H32ClO7, 491.1843).
Talarine N (4), yellow amorphous powder; [α]D25 – 87 (c 0.05, MeOH); UV (MeOH) λmax (log ε): 220 (3.16) nm, 277 (4.11) nm, 315 (3.01) nm; ECD (MeOH) λmax (∆ε): 212 (+ 9.20), 238 (– 3.81), 272 (+ 2.59) nm; IR (KBr) νmax (cm−1): 2930, 1712, 1689, 1257, 1099;1H and13C NMR data, see Tables 1 and 2; HR-ESI–MS m/z: 517.2438 [M + H]+ (Calcd. for C28H37O9, 517.2435).
Talarine O (5), white powder; [α]D25 – 121 (c 0.1, MeOH); UV (MeOH) λmax (log ε): 223 (3.78) nm, 274 (4.66) nm, 319 (3.24) nm; ECD (MeOH) λmax (∆ε): 227 (+ 14.07), 245 (− 2.18) nm, 260 (+ 1.97); IR (KBr) νmax (cm−1): 2914, 1764, 1636, 1358, 1150;1H and13C NMR data, see Tables 1 and 2; HR-ESI–MS m/z: 553.1841 [M + H]+ (Calcd. for C27H34O10Cl, 553.1829).
Talarine P (6), white powder; [α]D25 –79 (c 0.05, MeOH); UV (MeOH) λmax (log ε): 222 (4.01) nm, 269 (4.31) nm, 311 (3.11) nm; ECD (MeOH) λmax (∆ε): 209 (+ 5.07), 239 (− 4.29), 278 (+ 2.74) nm; IR (KBr) νmax (cm−1): 2942, 1733, 1616, 1369, 1104;1H and13C NMR data, see Tables 1 and 2; HR-ESI–MS m/z: 495.1775 [M + H]+ (Calcd. for C25H32O8Cl, 495.1786).
Talarine Q (7), white powder; [α]D25 – 67(c 0.1, MeOH); UV (MeOH) λmax (log ε): 211 (+ 13.42) nm, 230 (–22.63) nm, 272 (24.49) nm; ECD (MeOH) λmax (∆ε): 221 (7.04), 239 (− 2.33) nm; IR (KBr) νmax (cm−1): 2913, 1688, 1436, 1356, 1138, 1007;1H and13C NMR data, see Tables 1 and 2; HR-ESI–MS m/z: 495.1779 [M + H]+ (Calcd. for C25H32O8Cl, 495.1786).
4.4 Quantum chemistry calculations
The theoretical calculations of compounds were performed using Gaussian 09 [17]. The possible conformations were initially obtained from the program Spartan’14 and then optimized at B3LYP/6-31G* level in the gas phase. Room-temperature equilibrium populations were calculated according to the Boltzmann distribution law. The ECD calculations were performed using Time Dependent Density Functional Theory (TDDFT) [18] at wB97xd/ 6-311G** level in methanol with PCM model. The ECD spectra of compounds were obtained by weighing the Boltzmann distribution rate of each geometric conformation, and the sigma/gamma value for processing the calculated ECD was 0.3 eV [19]. All calculated curves were shifted + 15 nm to better simulate experimental spectra. The NMR calculations were performed using GIAO method at MPW1PW91/6-311G**// B3LYP/6-31G* level in METHANOL with PCM model [20]. The shielding constants (including13C and1H) obtained were directly performed statistical analyses with experimental chemical shifts by using DP4 + probability [21].
4.5 PTP1B inhibitory assay
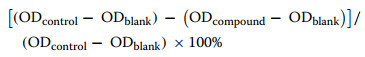
The p-nitrophenyl phosphate (p-NPP) was used as a substrate to evaluate enzyme inhibition assays, following a previously established protocol. The final assay volume was 100 μL. The 75 μL reaction buffer containing 50 mM HEPES, 100 mM NaCl, 1 mM EDTA, and 1 mM dithiothreitol, 10 μL protein, and 5 μL sample were added to a 96-well plate and incubated at room temperature for 15 min. Subsequently, 10 μL of reaction buffer containing p-NPP was added to the reaction system. Sodium orthovanadate (Na3VO4) and dimethyl sulfoxide (DMSO) were used as the positive and negative controls, respectively. Enzymatic activity was determined by measuring absorbance at 405 nm. The half-maximal inhibitory concentration (IC50) values were obtained from three independent experiments. The percentage of inhibition was calculated using the following equation:
|
4.6 Inhibition kinetic analysis
To determine the type of inhibition exerted by the most effective compound against PTP1B, enzyme kinetics analyses were performed using varying concentrations of the substrate (2, 1,0.5, 0.25, 0.125, 0.0625, 0.03125 mM p-NPP for PTP1B) in the presence of different concentrations of the inhibitor. The experimental procedure followed that described in the enzyme inhibition assay. The data were represented using Lineweaver–Burk double-reciprocal plots. The inhibition constants (Ki and Kis) were determined from the secondary plots of the slopes and intercepts derived from the Lineweaver–Burk plots.
4.7 Molecular docking
Molecular docking studies were carried out using the AutoDock software suite. The 3D conformations of compounds were generated and energy-minimized using the MM2 force field in Chem3D Ultra 11.0. The crystal structure of PTP1B (PDB ID: 2NT7) was retrieved from the RCSB Protein Data Bank. Prior to docking. All water molecules and co-crystallized ligands were removed. The hydrogen atoms were added to the protein structures using AutoDock tools (v1.5.6). Docking using AutoDock Vina 1.1.2. Default docking parameters were employed throughout the process. Visualization and analysis of docking poses were conducted using PyMOL 2.3.0 (https://pymol.org).
4.8 Statistical analysis
All experiments were repeated three times (n = 3). The results are expressed as mean ± SD. Statistical analysis was performed using GraphPad Prism 8.0. The two-tailed Student’s t-test was used to assess significance.
Notes
Acknowledgements
This work was supported by the Science Research Start-up Fund for Doctor of Hebei Normal University (grant numbers L2023B22 and L2024B16); Hebei Province Agricultural Science and Technology Achievement Transformation Fund Project (grant numbers 2025JNZ-S25); and the HeBei Edible Fungi Innovation Team of Modern Seed Industry Science and Technology (grant numbers 21326315D).
Author contributions
Xin-Yi Zhai conducted the experiments; Jin-Jie Liu, Cui-Duan Wang and Yi-Fan Dou participated in the experiments; Jian-Hua Lv performed the ECD calculations; Li-An Wang collected the samples; Jin-Xiu Zhang drafted the manuscript; Zhuang Li designed the experiments and revised the manuscript. All authors reviewed and approved the final manuscript.
Data availability
The datasets used or analyzed during the current study are available from the corresponding author on reasonable request.
Declarations
Competing interests
These authors have no competing interests to declare.
References
-
1.Matsuda Y, Abe I. Biosynthesis of fungal meroterpenoids. Nat Prod Rep 2016;33(1): 26-53. CrossRef PubMed Google Scholar
-
2.Yamazaki H, Nakayama W, Takahashi O, Kirikoshi R, Izumikawa Y, Iwasaki K, Toraiwa K, Ukai K, Rotinsulu H, Wewengkang DS, Sumilat DA, Mangindaan RE, Namikoshi M. Verruculides A and B, two new protein tyrosine phosphatase 1B inhibitors from an Indonesian ascidian-derived Penicillium verruculosum. Bioorg Med Chem Lett 2015;25(16): 3087-90. CrossRef PubMed Google Scholar
-
3.Zhou H, Li L, Wang W, Che Q, Li D, Gu Q, Zhu T. Chrodrimanins I and J from the Antarctic moss-derived fungus Penicillium funiculosum GWT2-24. J Nat Prod 2015;78(6): 1442-5. CrossRef PubMed Google Scholar
-
4.Kong FD, Ma QY, Huang SZ, Wang P, Wang JF, Zhou LM, Yuan JZ, Dai HF, Zhao YX. Chrodrimanins K-N and related meroterpenoids from the fungus Penicillium sp. SCS-KFD09 isolated from a marine worm, Sipunculus nudus. J Nat Prod 2017;80(4): 1039-47. CrossRef PubMed Google Scholar
-
5.Bai T, Quan Z, Zhai R, Awakawa T, Matsuda Y, Abe I. Elucidation and heterologous reconstitution of chrodrimanin B biosynthesis. Org Lett 2018;20(23): 7504-8. CrossRef PubMed Google Scholar
-
6.Cao X, Shi Y, Wu X, Wang K, Huang S, Sun H, Dickschat JS, Wu B. Talaromyolides A-D and talaromytin: polycyclic meroterpenoids from the fungus Talaromyces sp. CX11. Org Lett 2019;21(16): 6539-42. CrossRef PubMed Google Scholar
-
7.Cao X, Shi YT, Wu SH, Wang KW, Sun HX, He S, Diskschat JS, Wu B. Polycyclic meroterpenoids, talaromyolides E-K for antiviral activity against pseudorabies virus from the endophytic fungus Talaromyces purpureogenus. Tetrahedron 2020;76(30): 131349-57. CrossRef PubMed Google Scholar
-
8.Ding HE, Yang ZD, Sheng L, Zhou SY, Li S, Yao XJ, Zhi KK, Wang YG, Zhang F. Secovironolide, a novel furanosteroid scaffold with a five-membered B ring from the endophytic fungus Talaromyces wortmannii LGT-4. Tetrahedron Lett 2015;56(48): 6754-7. CrossRef PubMed Google Scholar
-
9.Kaur A, Raja HA, Swenson DC, Agarwal R, Deep G, Falkinham JO 3rd, Oberlies NH. Talarolutins A-D: meroterpenoids from an endophytic fungal isolate of Talaromyces minioluteus. Phytochemistry 2016;126: 4-10. CrossRef PubMed Google Scholar
-
10.Clark TA, Heyliger CE, Edel AL, Goel DP, Pierce GN. Codelivery of a tea extract prevents morbidity and mortality associated with oral vanadate therapy in streptozotocin-induced diabetic rats. Metabolism 2004;53(9): 1145-51. CrossRef PubMed Google Scholar
-
11.Singh S, Singh Grewal A, Grover R, Sharma N, Chopra B, Kumar Dhingra A, Arora S, Redhu S, Lather V. Recent updates on development of protein-tyrosine phosphatase 1B inhibitors for treatment of diabetes, obesity and related disorders. Bioorg Chem 2022;121: 105626. CrossRef PubMed Google Scholar
-
12.Elchebly M, Payette P, Michaliszyn E, Cromlish W, Collins S, Loy AL, Normandin D, Cheng A, Himms-Hagen J, Chan CC, Ramachandran C, Gresser MJ, Tremblay ML, Kennedy BP. Increased insulin sensitivity and obesity resistance in mice lacking the protein tyrosine phosphatase-1B gene. Science 1999;283(5407): 1544-8. CrossRef PubMed Google Scholar
-
13.Zinker BA, Rondinone CM, Trevillyan JM, Gum RJ, Clampit JE, Waring JF, Xie N, Wilcox D, Jacobson P, Frost L, Kroeger PE, Reilly RM, Koterski S, Opgenorth TJ, Ulrich RG, Crosby S, Butler M, Murray SF, McKay RA, Bhanot S, Monia BP, Jirousek MR. PTP1B antisense oligonucleotide lowers PTP1B protein, normalizes blood glucose, and improves insulin sensitivity in diabetic mice. Proc Natl Acad Sci USA 2002;99(17): 11357-62. CrossRef PubMed Google Scholar
-
14.Fischer G, Müller T, Ostrowski R, Dott W. Mycotoxins of Aspergillus fumigatus in pure culture and in native bioaerosols from compost facilities. Chemosphere 1999;38(8): 1745-55. CrossRef PubMed Google Scholar
-
15.Li X, Awakawa T, Mori T, Ling M, Hu D, Wu B, Abe I. Heterodimeric non-heme iron enzymes in fungal meroterpenoid biosynthesis. J Am Chem Soc 2021;143(50): 21425-32. CrossRef PubMed Google Scholar
-
16.Ren M, Li Z, Wang Z, Han W, Wang F, Li Y, Zhang W, Liu X, Zhang J, Luo DQ. Antiviral chlorinated drimane meroterpenoids from the fungus Talaromyces pinophilus LD-7 and their biosynthetic pathway. J Nat Prod 2024;87(8): 2034-44. CrossRef PubMed Google Scholar
-
17.Frisch MJ, Trucks GW, Schlegel HB, Scuseria GE, Robb MA, Cheeseman JR, Scalmani G, Barone V, Mennucci B, Petersson GA, Nakatsuji H, Caricato M, Li X, Hratchian HP, Izmaylov, AF, Bloino J, Zheng G, Sonnenberg JL, Hada M, Ehara M, Toyota K, Fukuda R, Hasegawa J, Ishida M, Nakajima T, Honda Y, Kitao O, Nakai H, Vreven T, Montgomery JA, Peralta JE, Ogliaro F, Bearpark M, Heyd JJ, Brothers E, Kudin KN, Staroverov VN, Keith T, Kobayashi R, Normand J, Raghavachari K, Rendell A, Burant JC, Iyengar SS, Tomasi J, Cossi M, Rega N, Millam JM, Klene M, Knox JE, Cross JB, Bakken V, Adamo C, Jaramillo J, Gomperts R, Stratmann RE, Yazyev O, Austin AJ, Cammi R, Pomelli C, Ochterski JW, Martin RL, Morokuma K, Zakrzewski VG, Voth GA, Salvador P, Dannenberg JJ, Dapprich S, Daniels AD, Farkas O, Foresman JB, Ortiz JV, Cioslowski J, Fox DJ. 2013. Gaussian 09, Revision E.01. Gaussian, Inc., Wallingford CT. PubMed Google Scholar
-
18.Bruhn T, Schaumlöffel A, Hemberger Y. SpecDis, Version 1.64. Wuerzburg: University of Wuerzburg; 2015. PubMed Google Scholar
-
19.Srebro-Hooper M, Autschbach J. Calculating natural optical activity of molecules from first principles. Annu Rev Phys Chem 2017;68: 399-420. CrossRef PubMed Google Scholar
-
20.Lodewyk MW, Siebert MR, Tantillo DJ. Computational prediction of 1H and 13C chemical shifts: a useful tool for natural product, mechanistic, and synthetic organic chemistry. Chem Rev 2012;112(3): 1839-62. CrossRef PubMed Google Scholar
-
21.Zanardi MM, Sarotti AM. Sensitivity analysis of DP4+ with the probability distribution terms: development of a universal and customizable method. J Org Chem 2021;86(12): 8544-8. CrossRef PubMed Google Scholar
Copyright information
© The Author(s) 2025
Open Access This article is licensed under a Creative Commons Attribution 4.0 International License, which permits use, sharing, adaptation, distribution and reproduction in any medium or format, as long as you give appropriate credit to the original author(s) and the source, provide a link to the Creative Commons licence, and indicate if changes were made. The images or other third party material in this article are included in the article’s Creative Commons licence, unless indicated otherwise in a credit line to the material. If material is not included in the article’s Creative Commons licence and your intended use is not permitted by statutory regulation or exceeds the permitted use, you will need to obtain permission directly from the copyright holder. To view a copy of this licence, visit http://creativecommons.org/licenses/by/4.0/.