


Purity and Uncertainty Study of CRM Betulin by DSC

Abstract
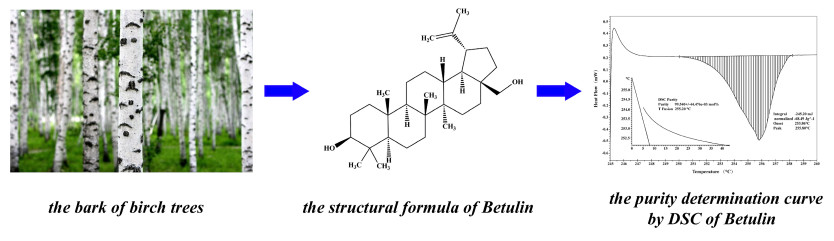
Betulin (BE) can be obtained from many plants, such as those belonging Betulaceae family, and pharmacological investigations showed its notable biological properties and good potential for food and pharmaceutical development. We investigated the homogeneity, stability, purity, and uncertainty of a newly certified reference material (CRM) of BE. The certified purity value for the CRM of BE was 99.56% with an extended uncertainty of 0.07% (k=2, P=0.95), as determined by differential scanning calorimetry (DSC). In this study, DSC was used for the first time for purity determination of BE. Given its high accuracy, precision, and reproducibility, DSC can be used as an alternative technique for purity determination of CRMs in the pharmaceutical and food industry.Graphical Abstract
Keywords
Betulin DSC Purity determination Uncertainty study1 Introduction
Betulin [BE; betulinol, 3β-lup-20(29)-en-3, 28-diol] belongs to a class of pentacyclic triterpenes and is the predominant compound of the outer bark of birch tree (Betula) [1]. Figure 1 shows the structural formula of BE. BE can be obtained from more than 200 plants species, although the richest source of BE are those belonging to Betulaceae family, especially Betula alba, B. pubescens, B. platyphylla, and B. pendula [2]. Pharmacological investigations have revealed that BE has many notable biological properties, such as anti-bacterial, anti-inflammatory, anti-fungal, and anti-viral effects, that work effectively on lesions; it also acts as a prophylactic and curative agent [3]. BE exhibits antitumor activity against many types of tumor cell lines: cervix carcinoma HeLa cells, hepatoma HepG2 cells, lung adenocarcinoma A549 cells, breast cancer MCF-7 cells, human gastric carcinoma, human pancreatic carcinoma, and different melanoma and skin cancer cell lines [4, 5]. As a promising clinical medication, BE has received increasing attention over the past few decades. Hence, the establishment of an accurate quantitative analysis method for BE is essential to enhance its utilization.
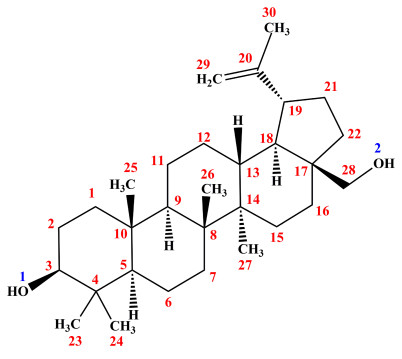
Structural formula of Betulin
Certified reference materials (CRMs) are used for qualitative and quantitative analyses and have extremely important applications in the food and pharmaceutical fields [6]. In addition to accuracy and precision, which are the classical aims of analytical chemistry, resolving uncertainty is a recent and modern goal of CRMs [7, 8]. Therefore, not only the purity of a CRM but also its uncertainty value must be known. The concept of uncertainty can reveal the quantitative interplay of the individual working steps of a method and thus lead to a deep understanding of its critical points.
Traditionally, chromatographic techniques, such as high-performance liquid chromatography (HPLC), in conjunction with other analytical techniques have been used to determine the purity of CRMs. The purity of BE can be determined by HPLC [9-12]. Recently, differential scanning calorimetry (DSC) has been used to quantitatively determine the purity of compounds that are at least 98% [13].
This paper describes the development process of the CRM of BE, including the preparation process of the material, evaluation of the homogeneity and stability of samples within and between groups, and employment of a strategy to assign reference values for the CRM. Following ISO Guide 34 and 35 [14, 15] the procedures included qualitative and quantitative analyses, verification, the study of homogeneity and stability, purity determination, and uncertainty evaluation. Additionally, in the current article, the CRM of BE was investigated and described by DSC for the first time.
2 Results and Discussion
2.1 Investigation of Heating Rate
The present study investigated three different heating rates (0.3, 0.5, and 0.7 K/min) for purity measurement. The purity values under three different heating rates were all 99.55%. Results showed that the purity value during the measurements was stable and had good parallelism when the heating rate was between 0.3–0.7 K/min. Therefore, the final experimental conditions were determined at heating rate of 0.5 K/min and heating interval of 245–260 ℃. Table 1 lists the measurement data from the investigation of heating rate.
Measurement data from the investigation of sample weighing of Betulin
2.2 Investigation of Sample Weighing
A standard curve was drawn by using the sample mass as the x-coordinate and the endothermic peak area as the y-coordinate. Within the mass range of 1.97–4.12 mg, the regression linear equation was Y = 66.0284X + 9.6196, and the correlation coefficient R2 was 0.9991 (n = 6). The results indicated a good linear relationship between the sample mass and endothermic peak area. Consequently, DSC can be used for determining the purity of the CRM of BE. Figure 2 shows the linear regression result of the investigation of sample weighing.
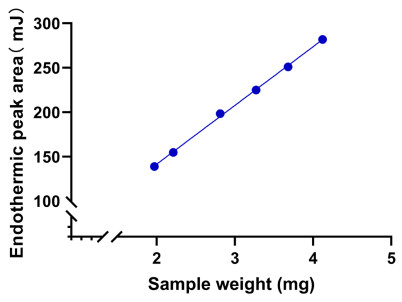
Linear regression result of the investigation of sample weighing of Betulin
2.3 Homogeneity Test
The means of the squares between groups (MSbetween) and within each group (MSwithin) were 6.99 × 10⁻⁹ and 4.47 × 10⁻⁹, respectively. The calculated F-value was 1.46, which was lower than the critical F-value (1.74). No significant differences were found in the purity of BE during the homogeneity test. Table 2 provides the measurement data from the homogeneity tests.
Measurement data from the homogeneity test of Betulin
The analytical data were assessed by one-way analysis of variance.
2.4 Stability Test
The data for the short-term stability tests were examined by Student's t-test, and those for the long-term stability test were assessed by regression analysis. The statistical analysis showed that the CRM of BE can be stored at 25 ℃ for at least 12 months. Table 3 lists the short-term stability test measurement data. Figure 3 exhibits the results of long-term stability test of BE.
Measurement data from the short-term stability test of Betulin
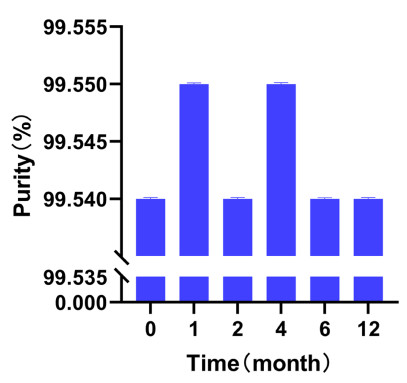
Results of long-term stability test of Betulin
2.5 Minimum Sampling Weight Test
In this part, DSC was used to investigate the minimum sampling weight of the CRM of BE. In the experiment, four different weights, namely, 1.0, 2.0, 3.0, and 4.0 mg, were used to study the minimum sampling weight. Six parallel experiments were conducted for each mass, and the results are shown in Table 4.
Result of the minimum sampling amount test
The results by calculations were as follows: t100.05(1.0, 2.0) = 3.475, t100.05(2.0, 3.0) = 1.803, t100.05(2.0, 4.0) = 1.698, and t100.05(3.0, 4.0) = 0.360. The results of t-test showed that the minimum sample quantity of "betulin purity standard material" was 2.0 mg.
2.6 Purity Determination
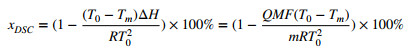
Figure 4 illustrates the DSC curve of BE and the endothermic melting peak at 256.5 ℃. The purity determination by DSC was based on Van't Hoff's law [16]. The purity of BE was calculated in accordance with the following formula:
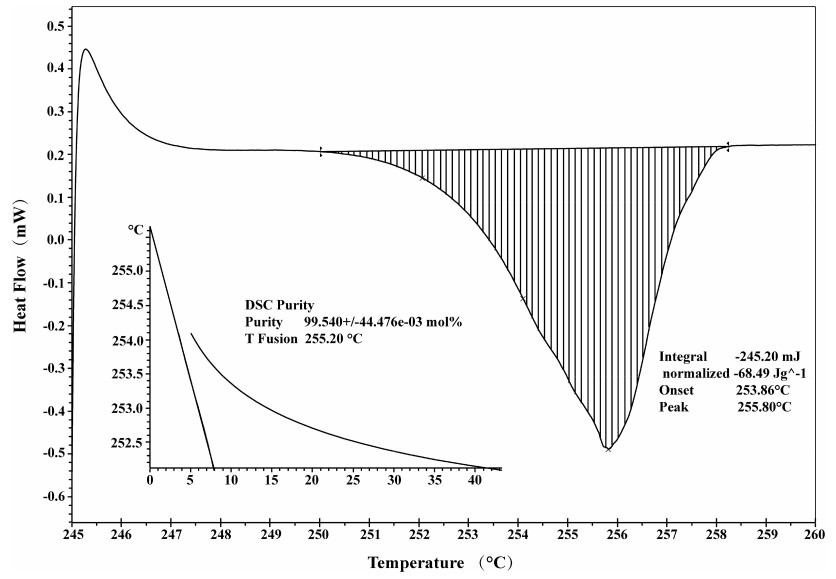
The DSC curve of Betulin
|
(1) |
where xDSC is the purity, and Q and m are the thermal values calibrated by stannum and sample mass, respectively. M is the molar mass of BE. T0 is the melting temperature of the pure compound; Tm is the actual melting temperature; R is gas constant; ΔH is the molar enthalpy of melting, and y is the mole fraction of impurity in the substance.
2.7 Value Characterization
The purity of the analyte was calculated, and the results of purity determination are listed in Table 5. The mean purity was 99.56% with a standard deviation of 1.906%.
Purity of analyte as determined by the DSC method
2.8 Uncertainty Evaluation
The factors that affect the accuracy of the results in a measurement include environmental conditions, operational conditions, accuracy in weighing, the instrument used for measurement, molar melting enthalpy analysis, and accuracy of the analytical software. The analysis indicated that the uncertainty of measurement was derived from the following factors: the uncertainty in measurements of the melting enthalpy of stannum, measurement error, weighing error, temperature error, and calculation error of the DSC analysis software.
2.8.1 Uncertainty from Melting Enthalpy Measurements of Stannum (uB1(DSC))
Table 6 lists the melting enthalpy of stannum (uB1(DSC)) measured by DSC.
Melting enthalpy of Stannum measured by the DSC method
The uncertainty of uB1(DSC) was calculated using the following expression:
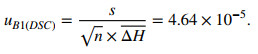
|
2.8.2 Uncertainty from Measurement Error (uA1(DSC))
The uA1(DSC) was calculated using the following expression:
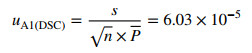
|
2.8.3 Uncertainty from Weighing Error (u B2(DSC))
The uB2(DSC) was calculated using the following expression:
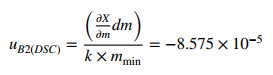
|
2.8.4 Uncertainty from Temperature Error (u B3(DSC))
The uB3(DSC) was calculated using the following expression:
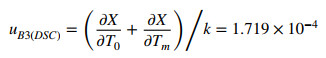
|
2.8.5 Uncertainty from Systematic Deviation of the DSC Analysis Software (uB4(DSC))
Table 6 shows the systematic deviation of the DSC analysis software from the purity determination.
The uB4(DSC) was estimated using the following expression:
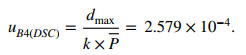
|
2.8.6 Combined Uncertainty of CRM
The uncertainty of CRM arising from uB1(DSC), uA1(DSC), uB2(DSC), uB3(DSC), and uB4(DSC) were calculated and discussed. Figure 5 shows the cause-and-effect diagram revealing the possible sources of uncertainty in DSC.
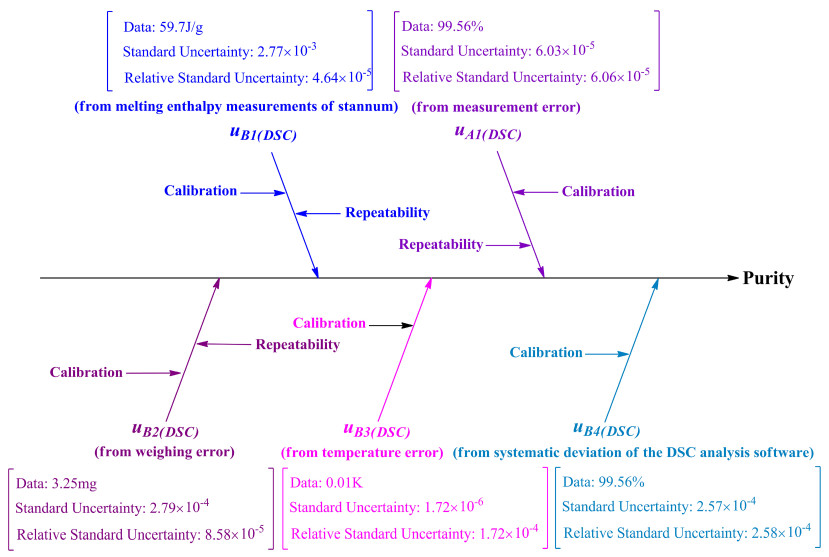
Cause and effect diagram showing the possible sources of uncertainty in the DSC method
The combined uncertainty of CRM was calculated using the following expression:
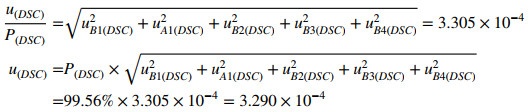
|
2.8.7 Expanded Uncertainty (Uc) of CRM
The Uc of CRM was calculated using a coverage factor of 2, which is associated with a confidence level of approximately 95%.
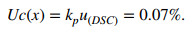
|
2.9 Results of CRM Analysis
The purity of the CRM of BE was estimated at 99.56% ± 0.07% (k = 2) within a typical 95% confidence interval based on the combined value assignments and the Uc by DSC.
2.10 Method Validation and Value Certification
The purity of BE was certified by the mass balance method, which obtained a value of 99.54% ± 0.24% (k = 2) within a typical 95% confidence interval. The t-test indicated no significant difference between the results of the two methods. The certified value was expressed as the mean of the purity obtained by the two methods. The certified value of the CRM of BE was 99.6% ± 0.5% (k = 2) within a typical 95% confidence interval.
3 Conclusion
In this study, a reliable, sensitive, and rapid DSC method was developed for the purity determination of a new CRM of BE. The purity of BE was determined by DSC method and certified by the mass balance method. The results of the two methods were consistent, indicating that DSC method can be used as an alternative technique for the purity determination of materials. The validation data presented here indicate that DSC method can be used to determine the purity of BE with consistent results. Compared with the traditional mass balance method, DSC method is faster and provides higher accuracy and precision. Furthermore, this method has good reproducibility and requires no corresponding reference standard and sample preparation. DSC method can be used as an alternative reference method to provide accurate data. The results can be compared with those of the routine methods employed for testing BE. We envision that DSC method can be used extensively in tests and evaluation processes in the pharmaceutical industry.
The new CRM of BE can be used for the calibration of analytical instruments, assessment of test methods, and securing the accuracy and comparability of measurement data. The new CRM of BE has been approved by the national administrative committee for CRM (GBW09593). This reference material can also be widely used to control the quality of BE-related pharmaceutical and foods formulations.
4 Experiment Section
4.1 Materials
BE was obtained from Yuancheng Co., Ltd. (Wu Han, China). All other reagents were of analytical grade.
4.2 Preparation of Reference Material
BE (50 g) was dissolved in 95% ethanol at an external temperature of 60 ℃ in a round-bottom flask, and then kept at 60 ℃ until the sample had dissolved. Then the solution was subjected to hot filtering and retained at 4 ℃ overnight. After the crystals had completely precipitated, they were filtered and vacuum dried to obtain highly pure crystals of BE, which were dried at 60 ℃ for 4 h. The powder was milled and then passed through a 74-μm sieve. The fraction was homogenized in a rotating mixer prior to filling. Samples of 50 mg of the homogenized powder were dispensed into each dark glass vial, which were then sealed. Six hundred bottles were prepared for each batch of BE. The samples were stored at 25 ℃ for studies of homogeneity and stability.
4.3 Determination of Homogeneity and Stability
Studies of homogeneity and stability were performed using the DSC method. The between-vial homogeneity was determined by analyzing one replicate in each of the 25 randomly selected bottles from each batch. The within-vial homogeneity was tested in three replicates for each vial. The results were statistically evaluated.
Eighteen samples were selected for the short-term stability study. The samples were divided into six different groups, each group containing three samples. The six groups of the sample were respectively stored at 60 ℃ and under light conditions (4500 l× ± 500 l×) for 0, 1, and 2 weeks. Another 36 samples were selected for the long-term stability study. The samples were divided into six different groups, each group containing six samples. The six groups of the sample were stored at 25 ℃ for 0, 1, 2, 4, 6, and 12 months under lighted condition, respectively.
4.4 Characterization
The DSC analysis of the samples was conducted using a DSC1 system (Mettler-Toledo Inc, Switzerland). The samples (at approximately 3–5 mg) were hermetically sealed in aluminum crucibles to prevent any mass loss in the presence of moisture. All sample measurements were performed in triplicate at a heating rate of 0.5 K/min and temperatures ranged from 245 to 260 ℃ with furnace gas N2. The purity results obtained by DSC are reported as the average of the triplicate determinations.
Notes
Acknowledgements
This work was financially supported by National Key R & D Program of China (Grant No. 2016YFC1000900), National Science and Technology Major Project of China (Grant Nos. 2017ZX09101001003, 2018ZX09711001-003-022, 2018ZX09711001- 010), National Natural Science Foundation of China(NSFC) (Grant No. 81703473) and CAMS Innovation Fund for Medical Sciences(Grant No. 2017-I2M-3-010).
Compliance with Ethical Standards
Conflict of interest
The Authors declare that there is no conflict of interest.
References
-
1.A. Hordyjewska, A. Ostapiuk, A. Horecka, J. Kurzepa, Phytochem. Rev. 18, 929-951 (2019) CrossRef PubMed Google Scholar
-
2.C.A. Dehelean, S. Feflea, J. Molnár, I. Zupko, C. Soica, Nat. Prod. Commun. 7, 981-985 (2012) CrossRef PubMed Google Scholar
-
3.A. Falamas, C.A. Dehelean, S. Cinta pinzaru, Vib. Spectrosc. 95, 44-50 (2018) CrossRef PubMed Google Scholar
-
4.Z. Hu, Z. Wang, S. Luo, O.J. Margaret, Y. Wang, Chem. Biol. Interact. 302, 190-195 (2019) CrossRef PubMed Google Scholar
-
5.C. Danciu, I. Pinzaru, D. Coricovac, F. Andrica, I. Sizemore, C. Dehelean, F. Baderca, V. Lazureanu, C. Soica, M. Mioc, H. Radeke, Eur. J. Pharm. Biopharm. 134, 1-19 (2019) CrossRef PubMed Google Scholar
-
6.D. Yang, L. Jiao, B. Zhang, G. Du, Y. Lu, J. Pharm. Biomed. Anal. 140, 169-173 (2017) CrossRef PubMed Google Scholar
-
7.R. Borgesa, V.R. Meyer, J. Pharm. Biomed. Anal. 77, 40-43 (2013) CrossRef PubMed Google Scholar
-
8.E. Rozeta, R.D. Marinia, E. Ziemonsa, B. Boulanger, P. Hubert, J. Pharm. Biomed. Anal. 55, 848-858 (2011) CrossRef PubMed Google Scholar
-
9.G. Zhao, W. Yan, D. Cao, J. Pharm. Biomed. Anal. 43, 959-962 (2007) CrossRef PubMed Google Scholar
-
10.A.K. Maji, N. Maity, P. Banerji, D. Banerjee, Int. J. Phytomedicine. 5, 131 (2013) CrossRef PubMed Google Scholar
-
11.A.K. Ressmann, K. Strassl, P. Gaertner, B. Zhao, L. Greiner, K. Bica, Green Chem. 14, 940-944 (2012) CrossRef PubMed Google Scholar
-
12.A.K. Maji, S. Pandit, P. Banerji, D. Banerjee, Int. J. Pharm. Pharm. Sci. 6, 691-695 (2014) PubMed Google Scholar
-
13.O. Nara, Anal. Chim. Acta. 685, 91-102 (2011) CrossRef PubMed Google Scholar
-
14.ISO Guide 34, General requirements for the competence of reference material producers, International Organization for Standardization. (2009) PubMed Google Scholar
-
15.ISO Guide 35, Reference materials-General and statistical principles for certification, International Organization for Standardization. (2006). PubMed Google Scholar
-
16.S. Mathkar, S. Kumar, A. Bystol, K. Olawoore, D. Min, R. Markovich, A. Rustum, J. Pharm. Biomed. Anal. 49, 627-631 (2009) CrossRef PubMed Google Scholar
Copyright information
© The Author(s) 2020
Open Access This article is licensed under a Creative Commons Attribution 4.0 International License, which permits use, sharing, adaptation, distribution and reproduction in any medium or format, as long as you give appropriate credit to the original author(s) and the source, provide a link to the Creative Commons licence, and indicate if changes were made. The images or other third party material in this article are included in the article's Creative Commons licence, unless indicated otherwise in a credit line to the material. If material is not included in the article's Creative Commons licence and your intended use is not permitted by statutory regulation or exceeds the permitted use, you will need to obtain permission directly from the copyright holder. To view a copy of this licence, visit http://creativecommons.org/licenses/by/4.0/.
