


Cytosporinols A-C, new caryophyllene sesquiterpenoids from Cytospora sp.
Abstract
Three new caryophyllene sesquiterpenoids, cytosporinols A-C(1-3), have been isolated from solid cultures of Cytospora sp. The structures of 1-3 were elucidated primarily by NMR spectroscopy, and 3 was further confirmed by X-ray crystallography. The absolute configurations of the C-11 secondary alcohol in 1 and the 6, 8-diol moiety in 3 were deduced using the modified Mosher and Snatzke's method, respectively. Compounds 2 and 3 showed moderate cytotoxicity against HeLa cells.Keywords
caryophyllene sesquiterpenoid cytosporinol Cytospora sp.Introduction
Caryophyllene sesquiterpenoids have been isolated frequently from fungi as the bioactive principles. Examples include the pestalotiopsins, immunosuppressive and cytotoxic agents produced by the endophyte Pestalotiopsis sp. isolated from Taxus brevifolia; 1, 2 pestalotiopsolide A, teadolidol, and 6-epiteadolidol, highly oxidized caryophyllenes from a Pestalotiopsis sp. endophytic to the bark of Pinus taeda; 3 the 6-hydroxpunctaporonins, antibacterial metabolites from a fungicolous Pestalotiopsis disseminata; 4 fuscoatrol A, a cytotoxic agent from a marine-derived Humicola fuscoatra KMM 4629;5 the punctaporonins (also named as punctatins), antifungal agents from a coprophilous Poronia punctata; 6-11 walleminol and walleminone, two cis-fused iso-caryophyllenes from the toxigenic fungus Wallemia sebi; 12 and Sch 725432, 601253, 601254, and 725434, antifungal agents from Chrysosporium pilosum.13
|
During an ongoing search for new bioactive natural products from fungi of unique habitats, we initiated chemical studies of the fungi either inhabiting the fruiting body and larvae of Cordyceps sinensis14 or its surface soil.15 As an extension, we also studied those species isolated from the soil samples that were collected on the Qinghai-Tibetan plateau at altitudes above 3, 200 m, the environment in which Cordyceps sinensis was typically found. Our initial investigation of such an ascomycetous fungus Cytospora sp. led to the isolation of three antimicrobial caryophyllene-derived meroterpenoids.16 Since the HPLC chromatogram of the crude extract revealed the presence of some minor components that could be the cytotoxic principles remained to be identified, the fungus was refermented in a larger scale using the same solid fermentation culture medium in which the meroterpenoids were first isolated.16 Fractionation of an EtOAc extract afforded three new caryophyllene sesquiterpenoids which we named cytosporinols A–C (1–3). Details of the isolation, structure elucidation, and cytotoxicity of these compounds are described herein.
Results and Discussion
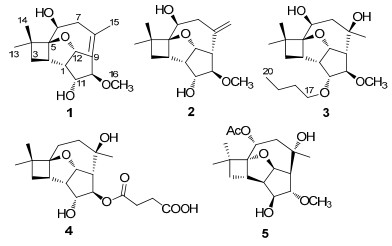
Cytosporinol A (1) was assigned the molecular formula C16H24O4 (five degrees of unsaturation) by HRESIMS. Analysis of its NMR data (Table 1) revealed two exchangeable protons (δH 3.37 and 3.93, respectively), four methyl groups (one O-methyl), two methylenes, six methines including four oxymethines, two sp3 quaternary carbons (one oxygenated), and one tetrasubstituted olefin. These data accounted for all the 1H and 13C NMR resonances, suggesting that 1 was a tetracyclic compound. The 1H–1H COSY NMR data showed two isolated spin-systems of C-10–C-1–C-3 (including OH-11 and C-12) and C-6–C-7 (including OH-6). Interpretation of the HMBC data of 1 established a cyclobutane partial structure with two methyl groups attached to C-4. HMBC cross-peaks from H-6 to C-2 and from H2-7 to C-5 indicated that C-6 is attached to the cyclobutane ring at C-5. The H2-7 protons were correlated to C-8, C-9, and C-15, while the Me-15 protons were correlated to C-7, C-8, and C-9 in the HMBC spectrum of 1, linking the C-8 olefinic carbon (δC 130.2) to C-7, C-9 (δC 134.5), and C-15. HMBC correlations from H-10 to C-8 and C-12, H-11 to C-9, and from H-12 to C-8 connected C-9 to both C-10 and C-12, completing the partial structure with a cyclopentane moiety fused to a cyclooctene unit at C-1/C-9. The key HMBC correlation from H-12 to C-5 (δC 95.5) connected both C-5 and C-12 (δC 89.6) to the same oxygen atom to form a tetrahydrofuran (THF) ring fused to the cyclobutane and cyclopentane moieties at C-2/C-5 and C-1/C12, respectively. The HMBC correlation from the Omethyl proton signal Me-16 (δH 3.12) to the C-10 oxymethine carbon (δC 86.4) located the only methoxy group at C-10. On the basis of these data, the planar structure of 1 was established.
NMR data (400 MHz, acetone-d6) for 1
The relative configuration of 1 was deduced by analysis of the 1H–1H coupling constants and NOESY data (Figure 1). The vicinal coupling constants observed for H-1 with H-11 and H-12 were 7.4 and 6.5 Hz, respectively, suggesting their cis-relative orientation, 17 consistent with a similar THF moiety found in the known compound punctaporonin C (4).9, 18 NOESY correlations of Me-13 with H-2, H-3a, and H-6 indicated that these protons are all on the same face of the ring system, whereas those of H-3b with H-1 and Me-14, and of H-12 with Me-16 were used to place them on the opposite face. Collectively, these data allowed assignment of the relative configuration of 1. The 1S, 2R, 5S, 6S, 10R, 11R, and 12S absolute configurations were deduced for the stereogenic centers in 1 using the modified Mosher method19 as illustrated in Figure 2, which were also consistent with those assigned for corresponding stereogenic centers in 4.18

Key NOESY correlations for cytosporinols A (1)and B (2)
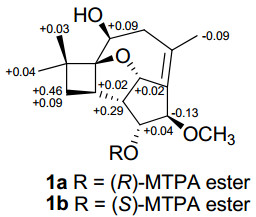
∆δ values (in ppm) = δS – δR obtained for (R)-and(S)-MTPA esters 1a and 1b
Cytosporinol B (2) was assigned the same molecular formula C16H24O4 as 1 by HRESIMS. Analysis of its NMR data (Table 2) revealed structural fragments similar to those presented in 1. However, the C-8–C-15 unit and the C-9 olefinic carbon (δC 134.5) were replaced by a terminal olefin (δH/δC 4.87/117.3, 144.7) and a methine (δH/δC 2.90/58.0), respectively, which were supported by relevant 1H–1H COSY and HMBC correlations. Therefore, the planar structure of 2 was proposed as shown. The relative configuration of 2 was also determined by analysis of the 1H–1H coupling constants and NOESY data (Figure 1). The coupling patterns and NOESY correlations for the relevant protons in 2 were nearly identical to those of 1, indicating that they possess the same relative configuration, except for the additional stereogenic center C-9, which was assigned by comparison of the coupling constant between H-9 and H-12 (9.7 Hz) with that reported for 4.9, 18 This assignment was supported by NOESY correlations of H-9 with H-1 and Me-16. Considering the absolute configuration established for 1 by the modified Mosher method, C-9 was deduced to have the S configuration.
NMR data for 2 (acetone-d6) and 3 (CDCl3)
Cytosporinol C (3) gave a pseudomolecular ion [M + Na]+ peak by HRESIMS, consistent with a molecular formula of C20H34O5 (four degrees of unsaturation). Analysis of its NMR data (Table 2) indicated that it is closely related to 1 and 2, except that the C-8/C-9 olefin in 1 or the C-8/C-15 terminal olefin in 2 was hydrated, and the OH-11 exchangeable proton (δH 3.93 in 1; 4.28 in 2) was replaced by a n-butyl group. These observations were supported by HMBC correlations from Me-15 to C-7, C-8, and C-9, and from the oxymethine proton H-11 to C-17, respectively. The relative configuration of 3 was assigned on the basis of NOESY data, and was confirmed by single crystal X-ray crystallographic analysis (Figure 3).
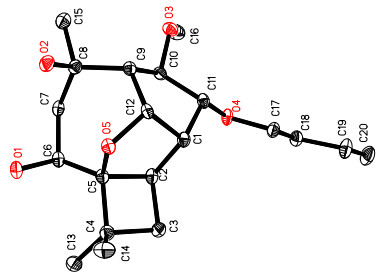
Thermal ellipsoid representation of 3
The absolute configuration of the cis-6, 8-diol moiety in 3 was assigned using the in situ dimolybdenum CD method developed by Frelek.20, 21 Upon addition of dimolybdenum tetraacteate [Mo2(OAc)4] to a solution of 3 in DMSO, a metal complex was generated as an auxiliary chromophore. Due to the absence of other chromophores in 3, the observed sign of the Cotton effect in the induced spectrum originates solely from the chirality of the 6, 8-diol moiety expressed by the sign of the "parallel" mode for Mo-O-C-C-C-O-Mo.22 When the molecule is viewed along the O-C bonds (Figure 4), the upper left and lower right sectors are defined as negative, whereas the upper right and lower left ones are defined as positive. The predicted sign of the Cotton effect depends upon the sign of the sector occupied by the largest part of the molecule. The negetive Cotton effect observed at around 400 nm (band Ⅱ) in the induced CD spectrum of 3 (Figure 5) permitted assignment of the 6S and 8R absolute configuration on the basis of the empirical rule proposed by Snatzke.20 Therefore, 3 was assigned 1R, 2R, 5S, 6S, 8R, 9S, 10R, 11R, and 12S absolute configuration.
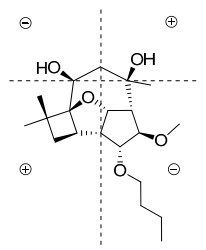
Projection of the sector rule for the 6, 8-diol moiety in 3
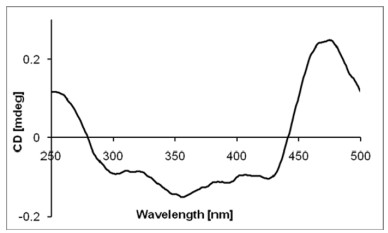
CD spectrum of 3 in DMSO containing Mo2(OAc)4
Compounds 2 and 3 showed modest cytotoxicity against HeLa (cervical epithelium) cells, showing IC50 values of 16.5 and 21.1 µM, respectively, while the positive control cisplatin showed an IC50 value of 7.6 µM. However, compound 1 did not show noticeable cytotoxic effects against HeLa cells (IC50 > 100 µM).
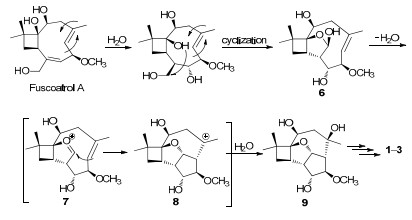
Cytosporinols A–C (1–3) are closely related to the known taedolidol, 3 6-epitaedolidol, 3 and punctaporonin C (4), 7-9 all possessing the rare oxatetracyclo[6.3.2.01, 4.05, 13]tridecane skeleton, but differ by having different substituents at C-6 (1), C-10 (1–3), and C-11 (3), as well as a tetrasubstituted olefin (1) and a terminal olefin (2). In addition, 1–3 are structurally similar to a synthetic byproduct 5 created in the acid-mediated cyclization of the nonatural enantiomer pestalotiopins, 23, 24 but differ in having different configurations for all stereogenic centers and substituents at C-6 and C-11, respectively. Biogenetically, 1–3 could be derived from co-isolated fuscoatrol A5 as proposed for the cytosporolides, 16 first via addition and cyclization to form 6, an intermediate of the C-6 deacetylate of (+)-pestalotiopsin A, 1 and then the acidcatalyzed cyclizations of 6 via two intermediates 7 and 8 could afford the key putative intermediate 9, 23 from which 1–3, taedolidol, 3 6-epitaedolidol, 3 and punctaporonin C (4)7-9could be generated via different routes (Scheme 1).
Hypothetical biosynthetic pathways for compounds 1–3
Experimental Section
General Experimental Procedures. Optical rotations were measured on a Perkin-Elmer 241 polarimeter, and UV data were recorded on a Shimadzu Biospec-1601 spectrophotometer. CD spectra were recorded on a JASCO J-815 spectropolarimeter. IR data were recorded using a Nicolet Magna-IR 750 spectrophotometer. 1H and 13C NMR data were acquired with Varian Mercury-400 and -500 spectrometers using solvent signals (acetone-d6: δH 2.05/δC 29.8, 206.1; pyridine-d5: δH 7.21, 7.58, 8.73; CDCl3: δH 7.26/δC 76.7) as references. The HMQC and HMBC experiments were optimized for 145.0 and 8.0 Hz, respectively. ESIMS data were recorded on a Bruker Esquire 3000plus spectrometer, and HRESIMS data were obtained using Bruker APEX Ⅲ 7.0 T and APEX II FT-ICR spectrometers, respectively.
Fungal Material. The culture of Cytospora sp. was isolated by Yang Hao from a soil sample collected on the QinghaiTibetan plateau at an altitude above 3, 200 m, Linzhi, Tibet, China, in April, 2007. The isolation and identification of the strain have been previously described.[16a] The fungus was cultured on slants of PDA at 25 ℃ for 10 days. Agar plugs were cut into small pieces (about 0.5 × 0.5 × 0.5 cm3) under aseptic conditions, 15 pieces were used to inoculate in three Erlenmeyer flasks (250 mL), each containing 50 mL of media (0.4% glucose, 1% malt extract, and 0.4% yeast extract); the final pH of the media was adjusted to 6.5 and sterilized by autoclave. Three flasks of the inoculated media were incubated at 25 ℃ on a rotary shaker at 170 rpm for five days to prepare the seed culture. Spore inoculum was prepared by suspending the seed culture in sterile, distilled H2O to give a final spore/cell suspension of 1 × 10⁶/mL determined by microscope and hemocytometer. Fermentation was carried out in 12 Fernbach flasks (500 mL) each containing 80 g of rice. Distilled H2O (120 mL) was added to each flask, and the contents were soaked overnight before autoclaving at 15 psi for 30 min. After cooling to room temperature, each flask was inoculated with 5.0 mL of the spore inoculum and incubated at 25 ℃ for 40 days.
Extraction and Isolation. The fermented material was extracted with EtOAc (4 × 1.0 L), and the organic solvent was evaporated to dryness under vacuum to afford a crude extract (6.0 g). The extract was fractionated by silica gel VLC using petroleum ether–EtOAc gradient elution. The fraction (150 mg) eluted with 50% EtOAc was separated by Sephadex LH-20 column chromatography (CC) eluting with 1:1 CH2Cl2–MeOH. The resulting subfractions were combined and further purified by semipreparative RP HPLC (Agilent Zorbax SB-C18 column; 5 μm; 9.4 × 250 mm; 2 mL/min) to afford cytosporinols A (1; 6.4 mg; tR 19.93 min; 45% CH3CN in H2O for 25 min) and B (2; 2.0 mg, tR 17.00 min; 25% CH3CN in H2O for 20 min). The fraction (300 mg) eluted with 30% EtOAc was eluted again through Sephadex LH-20 CC (1:1 CH2Cl2–MeOH) to afford cytosporinol C (3; 60.0 mg).
Cytosporinol A (1): colorless oil; [α]D25 +86 (c 0.1, MeOH); UV (MeOH) λmax (log ε) 208 (3.36) nm; IR (neat) νmax 3424 (br), 2933, 2866, 1709, 1446, 1230, 1094, 1064, 1054, 1011, 975, 949 cm–1; 1H, 13C NMR, and HMBC data see Table 1; positive ion ESIMS m/z 303 [M + Na]+; HRESIMS m/z 303.1564 (calcd for C16H24O4 Na, 303.1567).
Preparation of (R)-(1a) and (S)-MTPA (1b) Esters.19 A sample of 1 (2.0 mg, 0.007 mmol), (S)-MTPA Cl (3.0 μL, 0.017 mmol), and pyridine-d5 (0.5 mL) were allowed to react in an NMR tube at ambient temperature for 24 h, with the 1H NMR data of the R-MTPA ester derivative (1a) were obtained directly on the reaction mixture: 1H NMR (pyridine-d5, 400 MHz) δ 5.54 (1H, d, J = 4.0 Hz, H-12), 5.51 (1H, d, J = 8.0 Hz, H-11), 4.32 (1H, s, H-10), 4.17 (1H, dd, J = 12, 4.0 Hz, H-6), 3.70 (1H, t, J = 12 Hz, H-7a), 3.23 (3H, s, Me-16), 2.90 (1H, td, J = 8.0, 2.5 Hz, H-2), 2.62 (1H, ddd, J = 8.0, 4.0, 2.5 Hz, H-1), 2.16 (1H, dd, J = 12, 4.0 Hz, H-7b), 1.91 (1H, dd, J = 12, 8.0 Hz, H-3a), 1.74 (3H, s, Me-15), 1.57 (3H, s, Me-13), 1.54 (1H, dd, J = 12, 8.0 Hz, H-3b), 1.32 (3H, s, Me-14).
Similarly, the reaction mixture from another sample of 1 (2.0 mg, 0.007 mmol), (R)-MTPA Cl (3.0 μL, 0.017 mmol), and pyridine-d5 (0.5 mL) was processed as described above for 1a to afford 1b: 1H NMR (pyridine-d5, 400 MHz) δ 5.56 (1H, d, J = 4.0 Hz, H-12), 5.55 (1H, d, J = 8.0 Hz, H-11), 4.26 (1H, dd, J = 12, 4.0 Hz, H-6), 4.19 (1H, s, H-10), 3.70 (1H, t, J = 12 Hz, H-7a), 3.23 (3H, s, ME-16), 2.92 (1H, td, J = 8.0, 2.5 Hz, H-2), 2.91 (1H, ddd, J = 8.0, 4.0, 2.5 Hz, H-1), 2.15 (1H, dd, J = 12, 4.0 Hz, H-7b), 2.00 (1H, m, H-3a), 2.00 (1H, m, H-3b), 1.65 (3H, s, Me-15), 1.61 (3H, s, Me-13), 1.35 (3H, s, Me-14).
Cytosporinol B (2): colorless oil; [α]D25 –2.8 (c 0.1, MeOH); UV (MeOH) λmax (log ε) 208 (3.38) nm; IR (neat) νmax 3423 (br), 2936, 1718, 1445, 1382, 1236, 1104, 1043, 968 cm–1; 1H, 13C NMR, and HMBC data see Table 2; positive ion ESIMS m/z 303 [M + Na]+; HRESIMS m/z 303.1565 (calcd for C16H24O4 Na, 303.1567).
Cytosporinol C (3): colorless needles (MeOH–H2O), mp 149–152℃; [α]D25 –8.8 (c 0.1, MeOH); UV (MeOH) λmax (log ε) 209 (3.38) nm; IR (neat) νmax 3473, 3444, 2960, 2930, 2874, 1731, 1466, 1401, 1385, 1235, 1150, 1133, 1118, 1093, 1067, 1038, 1000, 901 cm–1; 1H, 13C NMR, HMBC, and NOESY data see Table 2; positive ion ESIMS m/z 377 [M + Na]+; HRESIMS m/z 377.2300 (calcd for C20H34O5 Na, 377.2298).
X-ray Crystallographic Analysis of 3.25 Upon crystallization from MeOH–H2O (10:1) using the vapor diffusion method, colorless crystals were obtained for 3. A crystal (0.40 × 0.30 × 0.08 mm) was separated from the sample and mounted on a glass fiber, and data were collected using a Rigaku Saturn CCD area detector with graphitemonochromated Mo Kα radiation, λ = 0.71073 Ǻ at 173(2) K. Crystal data: C20H34O5, M = 354.47, space group orthorhombic, P212121; unit cell dimensions a = 5.8938 (17) Å, b = 13.939 (4) Å, c = 23.127 (7) Å, V = 1900.0 (10) Å3, Z = 4, Dcalcd = 1.239 mg/m3, μ = 0.087 mm-1, F(000) = 776. The structure was solved by direct methods using SHELXL-9726 and refined using full-matrix least-squares difference Fourier techniques. All non-hydrogen atoms were refined with anisotropic displacement parameters, and all hydrogen atoms were placed in idealized positions and refined as riding atoms with the relative isotropic parameters. Absorption corrections were applied with the Siemens Area Detector Absorption Program (SADABS).27 The 12519 measurements yielded 2026 independent reflections after equivalent data were averaged, and Lorentz and polarization corrections were applied. The final refinement gave R1 = 0.0493 and wR2 = 0.0990 [I > 2σ(I)].
Absolute Configuration of the 6, 8-Diol Moiety in 3.20 HPLC grade DMSO was dried with 4 Å molecular sieves. According to a published procedure, a mixture of 1:2 diol/Mo2(OAc)4 for 3 was subjected to CD measurements at a concentration of 0.6 mg/mL. The first CD spectrum was recorded immediately after mixing, and its time evolution was monitored until stationary (about 10 min after mixing). The inherent CD was subtracted. The observed sign of the diagnostic band at around 400 nm in the induced CD spectrum was correlated to the absolute configuration of the 6, 8-diol moiety.
MTS Assay.28 The assay was run in triplicate. In a 96-well plate, each well was plated with 2–5 × 10³ cells (depending on the cell multiplication rate). After cell attachment overnight, the medium was removed, and each well was treated with 50 µL medium containing 0.1% DMSO, or appropriate concentrations of the test compounds and the positive control cisplatin (100 mM as stock solution of a compound in DMSO and serial dilutions; the test compounds showed good solubility in DMSO and did not precipitate when added to the cells). The plate was incubated for 72 h at 37 ℃ in a humidified, 5% CO2 atmosphere. Proliferation assessed by adding 20 μL of MTS (Promega) to each well in the dark, followed by a 90 min incubation at 37 ℃. The assay plate was read at 490 nm using a microplate reader.
Notes
Electronic Supplementary Material
Supplementary material is available in the online version of this article at http://dx.doi.org/10.1007/s13659-012-0018-z and is accessible for authorized users.
Acknowledgments
We gratefully acknowledge financial support from the National Natural Science Foundation of China (30925039), the Beijing Natural Science Foundation (5111003), the Ministry of Science and Technology of China (2009CB522300 and 2010ZX09401-403), and the Chinese Academy of Sciences (KSCX2-EW-G-6).
References
-
1.M. Pulici, F. Sugawara, H. Koshino, J. Uzawa, S. Yoshida, E. Lobkovsky, J. Clardy, J. Org. Chem. 61, 2122-2124 (1996) CrossRef PubMed Google Scholar
-
2.M. Pulici, F. Sugawara, H. Koshino, G. Okada, Y. Esumi, J. Uzawa, Phytochemistry 46, 313-319 (1997) CrossRef PubMed Google Scholar
-
3.R. F. Magnani, E. Rodrigues-Fo, C. Daolio, A. G. Ferreira, A. Q. Z. De Souza, Naturforsch 58C, 319-324 (2003) PubMed Google Scholar
-
4.S. T. Deyrup, D. C. Swenson, J. B. Gloer, D. T. Wicklow, J. Nat. Prod. 69, 608-611 (2006) CrossRef PubMed Google Scholar
-
5.O. F. Smetanina, T. A. Kuznetsova, A. V. Gerasimenko, A. I. Kalinovsky, M. V. Pivkin, P. C. Dmitrenok, G. B. Elyakov, Russ. Chem. Bull. 53, 2643-2646 (2004) CrossRef PubMed Google Scholar
-
6.J. R. Anderson, C. E. Briant, R. L. Edwards, R. P. Mabelis, J. P. Poyser, H. Spencer, A. J. Whalley, Chem. Soc., Chem. Commun, 405-406 (1984) PubMed Google Scholar
-
7.J. R. Anderson, R. L. Edwards, A. A. Freer, R. P. Mabelis, J. P. Poyser, H. Spencer, A. J. Whalley, J. Chem. Soc., Chem. Commun., 917-919 (1984) PubMed Google Scholar
-
8.J. P. Poyser, R. L. Edwards, J. R. Anderson, M. B. Hursthouse, N. P. Walker, G. M. Sheldrick, A. J. Whalley, J. Antibiot. 39, 167-169 (1986) CrossRef PubMed Google Scholar
-
9.J. R. Anderson, R. L. Edwards, J. P. Poyser, A. J. Whalley, J. Chem. Soc., Perkin Trans.1, 823-831 (1988) PubMed Google Scholar
-
10.R. L. Edwards, D. J. Maitland, A. J. Whalley, J. Chem. Soc., Perkin Trans1, 57-65 (1989) PubMed Google Scholar
-
11.R. L. Edwards, D. J. Maitland, J. P. Poyser, A. J. Whalley, J. Chem. Soc., Perkin Trans. 1, 1939-1941 (1989) PubMed Google Scholar
-
12.M. Frank, E. Kingston, J. C. Jeffery, M. O. Moss, M. Murray, T. J. Simpson, A. Sutherland, Tetrahedron Lett. 40, 133-136 (1999) CrossRef PubMed Google Scholar
-
13.S. W. Yang, T. M. Chan, J. Terracciano, E. Boehm, R. Patel, G. Chen, D. Loebenberg, M. Patel, V. Gullo, B. Pramanik, M. Chu, J. Nat. Prod. 72, 484-487 (2009) CrossRef PubMed Google Scholar
-
14.(a) Guo, H.; Hu, H.; Liu, S.; Liu, X.; Zhou, Y.; Che, Y. J. Nat. Prod. 2007, 70, 1519-1521. (b) Zhang, Y.; Liu, S.; Che, Y.; Liu, X. J. Nat. Prod. 2007, 70, 1522-1525. (c) Guo, H.; Sun, B.; Gao, H.; Niu, S.; Liu, X.; Yao, X.; Che, Y. Eur. J. Org. Chem. 2009, 5525-5530. (d) Zhang, Y.; Liu, S.; Liu, H.; Liu, X.; Che, Y. J. Nat. Prod. 2009, 72, 1364-1367. (f) Ma, C.; Li, Y.; Niu, S.; Zhang, H.; Liu, X.; Che, Y. J. Nat. Prod. 2011, 74, 32-37. PubMed Google Scholar
-
15.(a) Lin, J.; Liu, S.; Sun, B.; Niu, S.; Li, E.; Liu, X.; Che, Y. J. Nat. Prod. 2010, 73, 905-910. (b) Zou, X.; Niu, S.; Ren, J.; Li, E.; Liu, X.; Che, Y. J. Nat. Prod. 2011, 74, 1111-1116. (c) Lin, J.; Chen, X.; Cai, X.; Yu, X.; Liu, X.; Cao, Y; Che, Y. J. Nat. Prod. 2011, 74, 1798-1804. PubMed Google Scholar
-
16.(a) Li, Y.; Niu, S.; Sun, B.; Liu, S.; Liu, X.; Che, Y. Org. Lett. 2010, 12, 3144-3147. (b) Spence, J. T. J.; George, J. H. Org. Lett. 2011, 13, 5318-5311. PubMed Google Scholar
-
17.(a) Che, Y.; Gloer, J. B.; Scott, J. A.; Malloch, D. Tetrahedron Lett. 2004, 45, 6891-6894. (b) Che, Y.; Araugo, A. R.; Gloer, J. B.; Scott, J. A.; Malloch, D. J. Nat. Prod. 2005, 68, 435-438. PubMed Google Scholar
-
18.M. Fleck, T. Bach, Angew. Chem., Int. Ed., 47, 6189-6191 (2008) CrossRef PubMed Google Scholar
-
19.I. Ohtani, T. Kusumi, Y. Kashman, H. Kakisawa, J. Am. Chem. Soc. 113, 4092-4096 (1991) CrossRef PubMed Google Scholar
-
20.J. Frelek, G. Snatzke, W. Szczepek, Fresenius J. Anal. Chem. 345, 683-687 (1993) CrossRef PubMed Google Scholar
-
21.J. Frelek, W. Szczepek, W. Voelter, J. Ptakt. Chem. 339, 135-139 (1997) PubMed Google Scholar
-
22.J. Frelek, A. Perkowska, G. Snatzke, M. Tima, U. Wagner, H. P. Wolff, Spectrosc-Int. J. 2, 274-295 (1983) PubMed Google Scholar
-
23.T. M. Baker, D. J. Edmonds, D. Hamilton, C. J. O'Brien, D. Procter, J. Angew. Chem., Int. Ed., 47, 5631-5633 (2008) CrossRef PubMed Google Scholar
-
24.K.-I Takao, N. Hayakawa, R. Yamada, T. Yamaguchi, H. Saegusa, M. Uchida, S. Samejima, K.-I. Tadano, J. Org. Chem 74, 6452-6461 (2009) CrossRef PubMed Google Scholar
-
25.Crystallographic data for compound 3 have been deposited with the Cambridge Crystallographic Data Centre (deposition number CCDC 790902). Copies of the data can be obtained, free of charge, on application to the director, CCDC 12 Union Road, Cambridge CB21EZ, UK (fax:+441223336033 or email:deposit@ccdc.cam.ac.uk). PubMed Google Scholar
-
26.Sheldrick, G. M SHELXL-97, SHELXL-97 G. M., Program for X-ray Crystal Structure Solution and Refinement[M]. University of Göttingen: Göttingen, Germany, 1997. PubMed Google Scholar
-
27.Sheldrick, G. M SADABS, Program for Empirical Absorption Correction of Area Detector Data[M]. University of Göttingen: Göttingen, Germany, 1999. PubMed Google Scholar
-
28.N. Zhang, Y. Chen, R. Jiang, E. Li, X. Chen, Z. Xi, Y. Guo, X. Liu, Y. Zhou, Y. Che, X. Jiang, Autophagy 7, 598-612 (2011) CrossRef PubMed Google Scholar
Copyright information
© The Author(s) 2012
Open Access
This article is distributed under the terms of the Creative Commons Attribution License which permits any use, distribution, and reproduction in any medium, provided the original author(s) and source are credited.
