2. 物华能源科技有限责任公司,西安 710000;
3. 中国石油化工集团有限公司胜利油田分公司,山东 东营 257001
2. Wuhua Energy Technology Co., Ltd., Xi'an 710000, China;
3. Sinopec Shengli Oilfield Company, Dongying 257001, Shandong, China
相对渗透率是储层主要渗流参数之一,油水相对渗透率曲线是做好油气藏数值模拟和准确分析油气藏开发动态工作的重要资料[1-2]。通常,不同储层或同一储层不同区域的岩性和物性都具有较大差别,表现出很强的非均质性[3-4],导致基于储层不同部位的岩样测得的相渗曲线之间都有一定的差异,且相渗曲线特征与油藏含水率上升曲线形态存在较强相关性[5-6]。一般情况下,若要建立能表征油藏整体区域油水渗流特征的油水相对渗透率曲线,需要在得到大量室内岩心相渗曲线测试结果的基础上对其中具有代表性的相渗曲线进行归一化处理,但实际生产中往往难以获得所需要的岩心。针对这一问题,学者们做了许多研究,如:王曙光等[7]以大庆油田实测非稳态油水相渗曲线为样本,统计得到计算不同渗透率储层油水相对渗透率曲线的方法;Roghanian等[8]建立了利用线性回归方法预测油水相渗曲线关键端点值的模型;王东琪等[9]基于Willhite公式改进了水驱油藏相对渗透率曲线经验公式;王守磊等[10]基于端点值的统计分析,建立了油水相渗曲线预测模型等。然而,这些模型缺乏对相渗曲线形态的解剖与回归统计分析[11-13],其准确性和实际应用价值尚有讨论余地。
以胜利油田某砂岩油藏室内岩心相渗测试得到的相渗曲线为基础,利用交替条件期望方法对孔隙度、气测渗透率、平均孔喉半径、渗透率变异系数等7个影响相渗曲线的参数进行多元回归,建立油水相对渗透率曲线端点表征模型和曲线形态表征模型;结合由归一化方法得到的平均油水相对渗透率曲线,建立能体现砂岩储层油水相对渗透率曲线的表征模型,并将其应用于不同开发方式、不同相渗曲线处理方法对最后产量影响的数值模拟研究,优选出最能符合不同油藏开发方式的相渗曲线处理方法,以期使模拟更加贴近油藏生产实际,指导油藏生产。
1 相对渗透率曲线表征模型 1.1 相渗曲线的归一化在胜利油田孤岛油田新近系馆陶组(Ng)砂岩油藏岩心室内相渗测试结果的基础上,优选曲线形态较为正常(即符合相渗曲线特征)且岩心相关参数(如孔渗、压汞等数据)相对齐全的具有代表性的126条非稳态油水相对渗透率曲线[14]作为建模样本,其对应的实验基本参数及相渗特征参数如表 1所列。从表中可以看出,本次建模所用岩心孔隙度和渗透率均较高,属高孔、高渗储层,物性较好。
|
|
下载CSV 表 1 胜利油田孤岛油田新近系馆陶组砂岩油藏岩心相渗测试相关数据 Table 1 Basic data of relative permeability curve of sandstone reservoir of Neogene Guantao Formation in Gudao oilfield, Shengli Oilfield |
因各岩心的相渗曲线存在一定差异且仅代表自身的油水渗流特征,为了获得油田的平均相渗曲线,并观察整个油田油水渗流趋势,需对具有代表性的曲线进行归一化处理,进而对多条曲线平均。采用平均法对样本相渗曲线进行归一化处理,即对实验测出的油水相渗点进行分段线性插值。该方法可以准确地反映岩样的上凹形相渗形态及其他类型的相渗曲线形态[15],具体步骤如下。
① 选取具有代表性的n条相渗曲线,并对各曲线的相渗数据进行归一化处理:
| $ S_{\mathrm{w}}^*=\frac{S_{\mathrm{w}}-S_{\mathrm{wi}}}{1-S_{\mathrm{wi}}-S_{\mathrm{or}}} $ | (1) |
| $ K_{\mathrm{ro}}^*\left(S_{\mathrm{w}}^*\right)=\frac{K_{\mathrm{o}}\left(S_{\mathrm{w}}^*\right)}{K_{\mathrm{o}}\left(S_{\mathrm{wi}}\right)} $ | (2) |
| $ K_{\mathrm{rw}}^*\left(S_{\mathrm{w}}^*\right)=\frac{K_{\mathrm{w}}\left(S_{\mathrm{w}}^*\right)}{K_{\mathrm{w}}\left(S_{\mathrm{or}}\right)} $ | (3) |
式中:Sw*,Sw,Swi和Sor分别为归一化含水饱和度,含水饱和度,束缚水饱和度和残余油饱和度;Kro* (Sw*) 和Krw* (Sw*) 分别为Sw*对应的油相和水相相对渗透率;Ko (Sw*) 和Kw (Sw*) 分别为Sw*对应的油相和水相渗透率,mD;Ko (Swi) 为束缚水下油相渗透率,mD;Kw (Sor)为残余油下水相渗透率,mD。
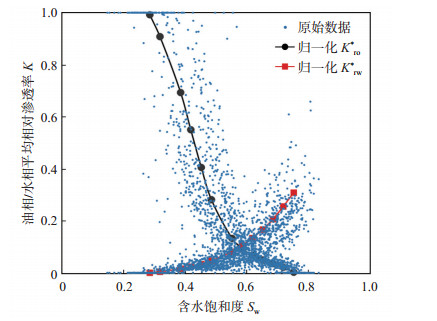
② 将Sw*由0到1划分为x等份,通过分段线性插值得到各相渗曲线同一Sw*所对应的Kro* (Sw*) 和Krw* (Sw*),进而获得归一化油水平均相对渗透率(图 1)。
|
下载原图 图 1 胜利油田孤岛油田新近系馆陶组砂岩岩心相渗数据归一化处理后油相(Kro*)和水相(Krw*)平均相对渗透率曲线 Fig. 1 Average relative permeability curves of Kro* and Krw* after normalization of Neogene Guantao Formation in Gudao oilfield, Shengli Oilfield |
多元回归方法是基于一个因变量和多个自变量建立各变量之间线性或非线性数学模型数量关系式,并利用样本数据进行分析的数理统计方法。该方法可以体现原始样本数据群体的主要特征,适用于室内岩心非稳态油水相渗数据的回归统计分析以及油水相渗曲线表征模型的建立[15]。然而,由于储层物性参数较多且分布存在不确性,利用传统的多元回归方法难以确定在实际生产中所采用的自变量和因变量之间的函数关系[16]。通过对比优选,采用一种不需要预设变量之间关系的函数形式,且最优变换仅依赖于数组的非参数多元非线性回归方法,即交替条件期望法[17],其回归模型的一般形式为
| $ \theta(y)=\sum\limits_{i=1}^n \varPhi_i\left(x_i\right)+\varepsilon $ | (4) |
式中:θ (y)为因变量期望函数;Φi (xi)为自变量期望函数;ε为回归误差。
影响油水相对渗透率曲线的因素较多,基于理论与统计分析,重点研究并对比了孔隙度φ,气测渗透率Kair,平均孔喉半径rp,渗透率变异系数C.V,均质系数α,特征结构参数C和孔喉比rpmax/rp 7个因素与相渗曲线端点参数之间的相关性[18-19]。选取相关性较好的影响因素作为自变量,相应的端点参数为因变量,进行相渗曲线端点表征模型的建立。这一方法可以省去大量的室内岩心相渗曲线测试实验,仅通过获取有关影响相渗曲线的因素即可获得所需的相渗曲线。
1.2.1 束缚水饱和度模型在回归统计上述7个影响相渗曲线因素的基础上,可知气测渗透率Kair,平均孔喉半径rp均与束缚水饱和度Swi有较好的相关性,选取Kair和rp作为自变量,Swi作为因变量,利用交替条件期望法回归自变量和因变量的关系,得到束缚水饱和度表征模型的定性关系式:
| $ \theta\left(S_{\mathrm{wi}}\right)=\varPhi\left(\ln K_{\mathrm{air}}\right) $ | (5) |
| $ \theta\left(\ln S_{\mathrm{wi}}\right)=\varPhi\left(\ln r_{\mathrm{p}}\right) $ | (6) |
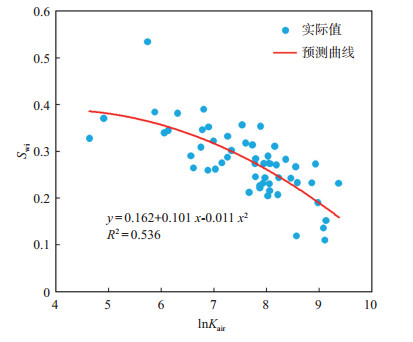
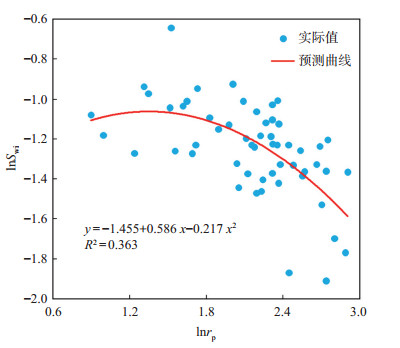
基于压汞实验、相渗测试结果和样本数据,分别得到Swi与Kair,rp之间的关系(图 2,图 3):
| $ S_{\text {wi }}=0.162+0.101 \ln K_{\text {air }}-0.011 \ln ^2 K_{\text {air }} $ | (7) |
| $ S_{\mathrm{wi}}=\mathrm{e}^{-1.455+0.586 \ln r_{\mathrm{p}}-0.217 \ln ^2 r_{\mathrm{p}}} $ | (8) |
|
下载原图 图 2 胜利油田孤岛油田新近系馆陶组砂岩油藏岩心束缚水饱和度Swi与气测渗透率Kair的关系 Fig. 2 Relationship between irreducible water saturation and permeability measured with gas of sandstone reservoir of Neogene Guantao Formation in Gudao oilfield, Shengli Oilfield |
|
下载原图 图 3 胜利油田孤岛油田新近系馆陶组砂岩油藏束缚水饱和度Swi与平均孔喉半径rp的关系 Fig. 3 Relationship between irreducible water saturation and average pore-throat radius of sandstone reservoir of Neogene Guantao Formation in Gudao oilfield, Shengli Oilfield |
由式(7)和(8)可得综合考虑Kair和rp的Swi表征模型:
| $ \begin{aligned} S_{\mathrm{wi}}= & 0.081+0.05 \ln K_{\mathrm{air}}-0.0055 \ln ^2 K_{\mathrm{air}}+ \\ & \mathrm{e}^{-1.455+0.586 \ln r_{\mathrm{p}}-0.217 \ln ^2 r_{\mathrm{p}}} \end{aligned} $ | (9) |
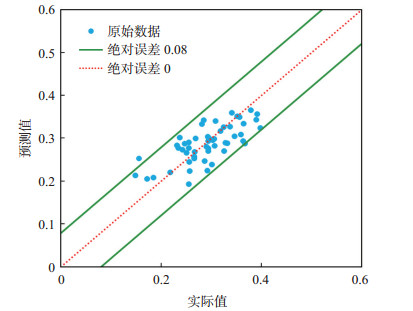
对比原始数据和模型预测值(图 4)发现,原始数据点主要分布在绝对误差为0的45°直线附近,二者的绝对误差小于0.08,模型预测结果较可靠。
|
下载原图 图 4 胜利油田孤岛油田新近系馆陶组砂岩油藏束缚水饱和度Swi实际值与模型预测值交会图 Fig. 4 Actual and predicted values of irreducible water saturation of sandstone reservoir of Neogene Guantao Formation in Gudao oilfield, Shengli Oilfield |
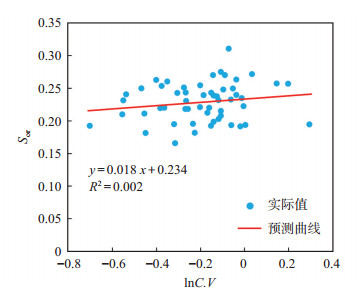
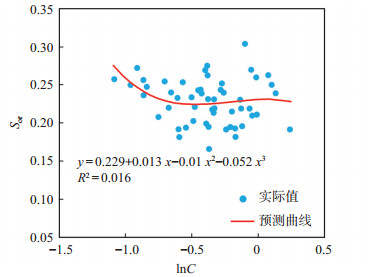
对油水相对渗透率曲线基础数据进行统计分析发现,残余油饱和度Sor与渗透率变异系数C.V,特征结构参数C均有较好的统计关系。选取C.V和C作为自变量,Sor作为因变量,利用交替条件期望法进行回归(图 5,图 6),可得到综合C.V和C的Sor表征模型:
| $ S_{\text {or }}=0.131 \ln C . V+0.044 \ln C+0.255 \;5 $ | (10) |
|
下载原图 图 5 胜利油田孤岛油田新近系馆陶组砂岩油藏残余油饱和度Sor与渗透率变异系数C.V的关系 Fig. 5 Relationship between residual oil saturation and permeability variation coefficient of sandstone reservoir of Neogene Guantao Formation in Gudao oilfield, Shengli Oilfield |
|
下载原图 图 6 胜利油田孤岛油田新近系馆陶组砂岩油藏残余油饱和度Sor与特征结构参数C的关系 Fig. 6 Relationship between residual oil saturation and significant parameters of sandstone reservoir of Neogene Guantao Formation in Gudao oilfield, Shengli Oilfield |
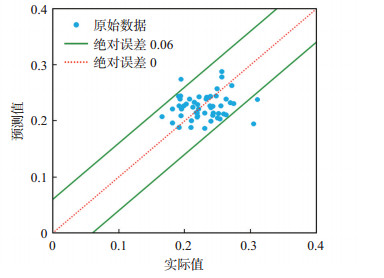
经理论和实际对比检验(图 7),实际值与预测值间绝对误差小于0.06,表明残余油饱和度表征模型可靠。
|
下载原图 图 7 胜利油田孤岛油田新近系馆陶组砂岩油藏残余油饱和度Sor实际值与模型预测值交会图 Fig. 7 Actual and predicted values of residual oil saturation of sandstone reservoir of Neogene Guantao Formation in Gudao oilfield, Shengli Oilfield |
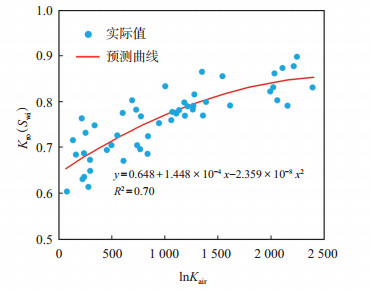
对所用建模相渗曲线的基础数据进行统计分析,发现束缚水饱和度下油相相对渗透率Kro(Swi)和气测渗透率Kair具有较好的相关性。选取Kair作为自变量,Kro(Swi)作为因变量,基于压汞实验及相渗测试结果数据(图 8),得到Kro(Swi)的表征模型:
| $ \begin{aligned} K_{\text {ro }}\left(S_{\text {wi }}\right)= & 0.648+1.448 \times 10^{-4} \ln K_{\text {air }}- \\ & 2.359 \times 10^{-8} \ln ^2 K_{\text {air }} \end{aligned} $ | (11) |
|
下载原图 图 8 胜利油田孤岛油田新近系馆陶组砂岩油藏束缚水饱和度下油相相对渗透率Kro(Swi)与气测渗透率Kair的关系 Fig. 8 Relationship between relative permeability of oil phase in irreducible water and permeability measured with gas of sandstone reservoir of Neogene Guantao Formation in Gudao oilfield, Shengli Oilfield |
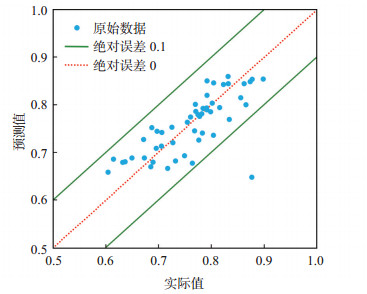
将模型预测的结果与实际值进行对比(图 9),绝对误差小于0.10,表明模型结果较可靠。
|
下载原图 图 9 胜利油田孤岛油田新近系馆陶组砂岩油藏束缚水饱和度下油相相对渗透率Kro(Swi)实际值与模型预测值交会图 Fig. 9 Actual and predicted values of relative permeability of oil phase in irreducible water of sandstone reservoir of Neogene Guantao Formation in Gudao oilfield, Shengli Oilfield |
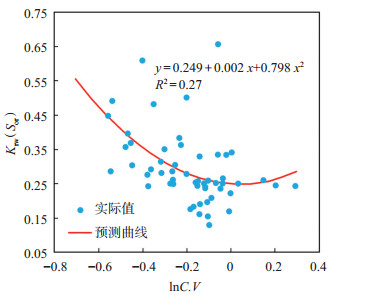
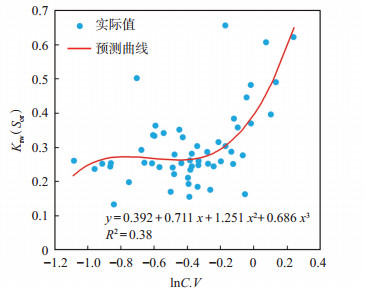
残余油下水相相对渗透率Krw(Sor)与渗透率变异系数C.V、特征结构参数C均具有好的相关性。选取C.V和C作为自变量,Krw(Sor)作为因变量,分别回归得到Krw(Sor)与C.V和C之间的关系(图 10,图 11),进而得到Krw(Sor)的表征模型:
| $ \begin{aligned} K_{\text {rw }}\left(S_{\text {or }}\right)= & 0.308 \;9+0.367 \ln C+0.653 \ln ^2 C+ \\ & 0.358\;5 \ln ^3 C-0.005\;95 \ln C . V+ \\ & 0.422\;5 \ln ^2 C . V \end{aligned} $ | (12) |
|
下载原图 图 10 胜利油田孤岛油田新近系馆陶组砂岩油藏残余油下水相相对渗透率Krw(Sor)与渗透率变异系数C.V的关系 Fig. 10 Relationship between relative permeability of water phase under residual oil and permeability variation coefficient of sandstone reservoir of Neogene Guantao Formation in Gudao oilfield, Shengli Oilfield |
|
下载原图 图 11 胜利油田孤岛油田新近系馆陶组砂岩油藏残余油下水相相对渗透率Krw(Sor)与特征结构参数C的关系 Fig. 11 Relationship between relative permeability of water phase under residual oil and significant parameters of sandstone reservoir of Neogene Guantao Formation in Gudao oilfield, Shengli Oilfield |
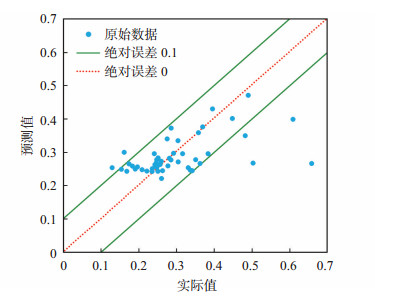
将模型预测的结果与实际值进行对比(图 12),实际值与模型预测值间绝对误差大多小于0.10,表明模型计算结果较可靠。
|
下载原图 图 12 胜利油田孤岛油田新近系馆陶组砂岩油藏残余油下水相相对渗透率Krw(Sor)实际值与模型预测值交会图 Fig. 12 Actual and predicted values of relative permeability of water phase under residual oil of sandstone reservoir of Neogene Guantao Formation in Gudao oilfield, Shengli Oilfield |
采用霍纳普(Honarpour,1982)经验公式[20]中的表征油相相渗曲线形态的指数m和表征水相相渗曲线形态的指数n来表征相渗曲线的形态:
| $ K_{\mathrm{ro}}=K_{\mathrm{ro}}\left(S_{\mathrm{wi}}\right)\left(\frac{1-S_{\mathrm{w}}-S_{\mathrm{or}}}{1-S_{\mathrm{wi}}-S_{\mathrm{or}}}\right)^m $ | (13) |
| $ K_{\mathrm{rv}}=K_{\mathrm{rv}}\left(S_{\mathrm{or}}\right)\left(\frac{S_{\mathrm{w}}-S_{\mathrm{wi}}}{1-S_{\mathrm{wi}}-S_{\mathrm{or}}}\right)^n $ | (14) |
将式(13)和(14)相除并两端取对数,令
| $ y=a+m x_1-n x_2 $ | (15) |
基于压汞实验及相渗测试结果数据,对式(15)进行二元线性回归拟合处理,即可得到m和n的值。
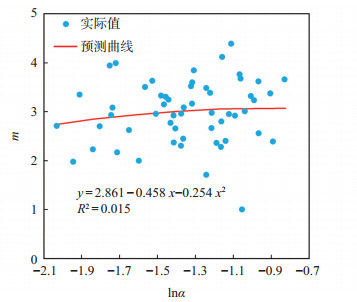
1.3.1 油相相渗曲线形态表征模型预回归发现均质系数α和油相相渗曲线形态指数m具有好的相关性,以α作为自变量,m作为因变量,利用交替条件期望法回归自变量和因变量间的关系(图 13),得到m的表征模型:
| $ m=2.861-0.458 \ln \alpha-0.254 \ln ^2 \alpha $ | (16) |
|
下载原图 图 13 胜利油田孤岛油田新近系馆陶组砂岩油藏油相相渗曲线形态指数m与均质系数α的关系 Fig. 13 Relationship between morphology of oil phase in relative permeability curve and uniformity coefficient of sandstone reservoir of Neogene Guantao Formation in Gudao oilfield, Shengli Oilfield |
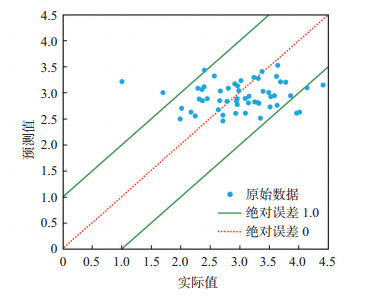
将模型预测的结果与实际值进行对比(图 14),实际值与预测值间绝对误差小于1.0,说明模型预测数据可靠。
|
下载原图 图 14 胜利油田孤岛油田新近系馆陶组砂岩油藏油相相渗曲线形态指数m实际值与模型预测值交会图 Fig. 14 Actual and predicted values of morphology of oil phase in relative permeability curve of sandstone reservoir of Neogene Guantao Formation in Gudao oilfield, Shengli Oilfield |
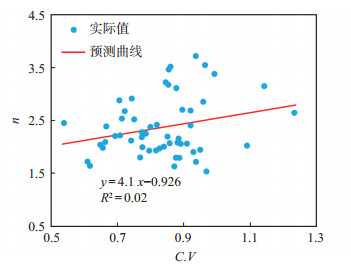
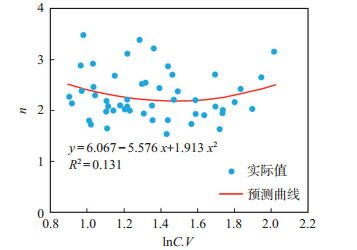
对所用建模相渗曲线的基础数据进行统计分析,发现水相相渗曲线形态指数n与C.V和孔喉比rpmax/rp间相关性较明显,以C.V和rpmax/rp作为自变量,n作为因变量,回归图 15和图 16的数据,得到n的表征模型:
| $ n=6.067-5.572 \frac{r_{\mathrm{p} \max }}{r_{\mathrm{p}}}+1.913\left(\frac{r_{\mathrm{p} \max }}{r_{\mathrm{p}}}\right)^2+4.1 C . V $ | (17) |
|
下载原图 图 15 胜利油田孤岛油田新近系馆陶组砂岩油藏水相相渗曲线形态指数n与渗透率变异系数C.V的关系 Fig. 15 Relationship between morphology ofwater phase in relative permeability curve and permeability variation coefficient of sandstone reservoir of Neogene Guantao Formation in Gudao oilfield, Shengli Oilfield |
|
下载原图 图 16 胜利油田孤岛油田新近系馆陶组砂岩油藏水相相渗曲线形态指数n与孔喉比rpmax /rp的关系 Fig. 16 Relationship between morphology of water phase in relative permeability curve and pore-throat ratio of sandstone reservoir of Neogene Guantao Formation in Gudao oilfield, Shengli Oilfield |
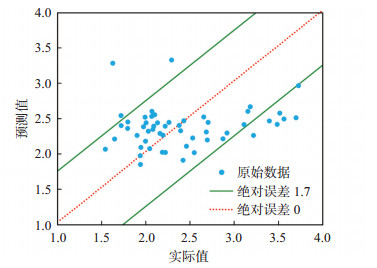
将模型预测的结果与实际值进行对比(图 17),绝对误差绝大部分小于1.7,表明模型预测结果可靠。
|
下载原图 图 17 胜利油田孤岛油田新近系馆陶组砂岩油藏水相相渗曲线形态指数n实际值与模型预测值交会图 Fig. 17 Actual and predicted values of morphology of water phase in relative permeability curve of sandstone reservoir of Neogene Guantao Formation in Gudao oilfield, Shengli Oilfield |
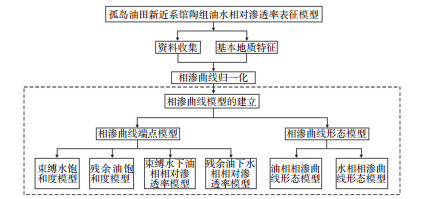
将通过交替条件期望法回归反演建立的油水相对渗透率曲线端点表征模型式(9)—式(12)和油水相对渗透率曲线形态表征模型式(16)—(17),与经归一化处理得到的油藏平均相对渗透率曲线相结合,便可得到能反映砂岩储层油水渗流特征的油水相对渗透率曲线表征模型。模型建立的基本步骤(图 18)如下:
|
下载原图 图 18 胜利油田孤岛油田新近系馆陶组砂岩储层油水相对渗透率曲线表征模型建立流程 Fig. 18 Steps for establishing oil-water relative permea-bility curve characterization model of sandstone reservoir of Neogene Guantao Formation in Gudao oilfield, Shengli Oilfield |
(1)选取室内岩心相渗测试得到的具有代表性的油水相渗测试结果,利用式(1)—(3)得到油藏归一化平均相对渗透率曲线。
(2)基于研究区域获得的气测渗透率Kair等与油水相对渗透率曲线有关的参数,分别计算出曲线端点、形态。
(3)基于步骤(1)求得的归一化含水饱和度Sw*,求其对应的含水饱和度Sw
| $ S_{\mathrm{w}}=S_{\mathrm{w}}^*\left(1-S_{\mathrm{wi}}-S_{\mathrm{or}}\right)+S_{\mathrm{wi}} $ | (18) |
(4)将得到的所有参数数据代入式(13)和(14)中,得到对应含水饱和度下的油相相对渗透率Kro和水相相对渗透率Krw。
3 数值模拟中相渗曲线的选择及应用数值模拟中的网格通常会进行粗化处理,原本需要采用多条相渗曲线来描述水驱油特征,仅用1条相渗曲线代替,这样粗化处理后一般会掩盖储层的非均质特征。因此,优选最能描述油藏特征的相渗曲线至关重要。
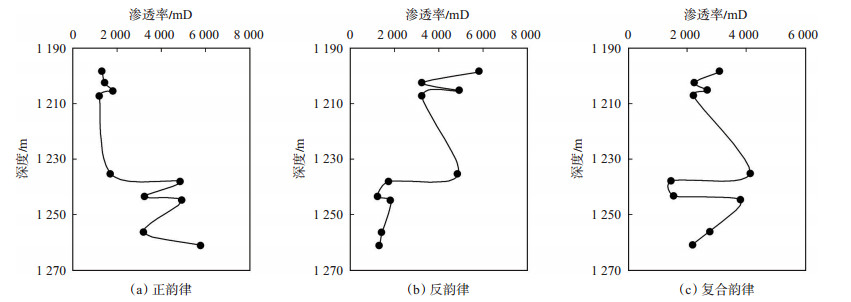
基于胜利油田孤岛油田新近系馆陶组砂岩油藏中部分井相渗和压汞数据,在目的层位中优选出正韵律、反韵律以及复合韵律层段(图 19),并结合实验及相渗表征模型的计算结果,建立适用于该区中—高渗砂岩油藏,反映不同地层韵律特征的机理模型。
|
下载原图 图 19 胜利油田孤岛油田新近系馆陶组砂岩油藏不同层段渗透率分布特征 Fig. 19 Distribution of permeability rhythm of sandstone reservoir of Neogene Guantao Formation in Gudao oilfield, Shengli Oilfield |
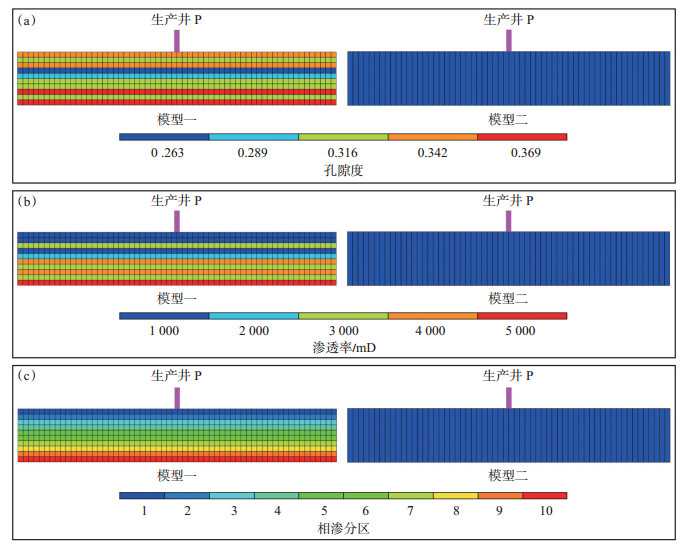
建立2个模型,模型一是基于正韵律分布特征,纵向为10层(网格数为60×60×10,网格为10 m× 10 m×1 m)的机理模型;模型二的面积和厚度与模型一相同,但纵向为单层(网格数为60×60×1,网格为10 m×10 m×10 m)的机理模型(图 20)。
|
下载原图 图 20 胜利油田孤岛油田新近系馆陶组砂岩油藏单层模型和多层非均质模型孔隙度(a)、渗透率(b)和相渗分区(c)设定 Fig. 20 Porosity(a), permeability(b)and relative permeability zone(c)of numerical reservoir model of sandstone reservoir of Neogene Guantao Formation in Gudao oilfield, Shengli Oilfield |
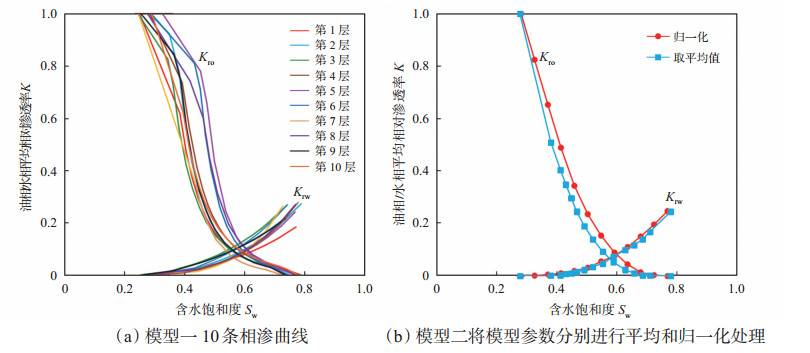
模型一根据所选正韵律层段的地层参数,根据砂岩储层油水相对渗透率曲线表征模型得出每一层的相渗曲线(图 21a);模型二将模型一的各个地层参数取平均值,代入表征模型中求得一条相渗曲线,然后根据式(1)—(3)对模型一中的各曲线进行归一化,得到一条新的曲线(表 2,图 21b)。
|
下载原图 图 21 胜利油田孤岛油田新近系馆陶组砂岩油藏2种模型油相(Kro)、水相(Krw)相渗曲线处理方法 Fig. 21 Relative permeability curves of oil phase and water phase for each model of sandstone reservoir of Neogene Guantao Formation in Gudao oilfield, Shengli Oilfield |
|
|
下载CSV 表 2 胜利油田孤岛油田新近系馆陶组砂岩油藏根据相渗表征模型得出的地层参数 Table 2 Formation parameters obtained from relative permeability characterization model of sandstone reservoir of Neogene Guantao Formation in Gudao oilfield, Shengli Oilfield |
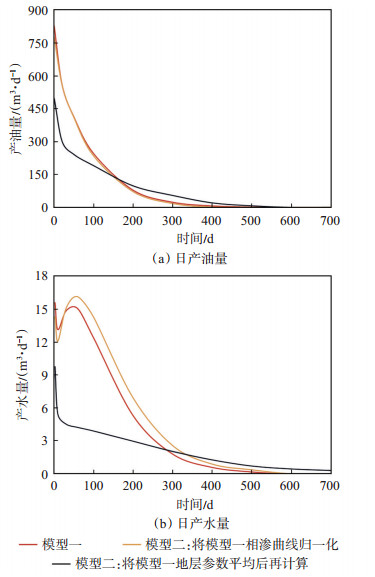
采用2种模型模拟油藏衰竭式开发,从模拟结果(图 22)可知:在正韵律地层衰竭式开发中,归一化处理相渗的单层模型和多层非均质模型的生产动态特征相似;通过求取地层参数平均值计算相渗的单层模型模拟结果与多层非均质模型差异较大,说明对于非均质的储层,将相渗曲线归一化处理更合适。
|
下载原图 图 22 胜利油田孤岛油田新近系馆陶组砂岩油藏2种模型模拟正韵律层段衰竭式开发结果对比 Fig. 22 Numerical reservoir simulation results of two models by using depletion development strategy for positive rhythm of sandstone reservoir of Neogene Guantao Formation in Gudao oilfield, Shengli Oilfield |
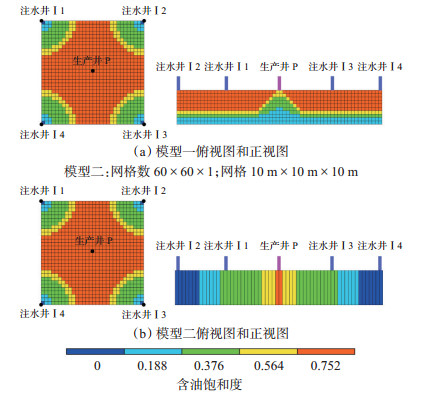
油水相渗通常是用于描述水对油藏开发动态的影响,在衰竭式开发中水的流动性差,对水相相渗的准确性要求较低,而在非均质性油藏中,水的影响更明显,实际油藏生产中通常采用注水开发。在衰竭式开发模型的基础上,添加4口注水井和1口生产井数据,采用注采平衡方式控制生产(图 23)。
|
下载原图 图 23 胜利油田孤岛油田新近系馆陶组砂岩油藏注水开发模型井位分布 Fig. 23 Distribution of well location for waterflood development strategy of Neogene Guantao Formation in Gudao oilfield, Shengli Oilfield |
模型一的相渗处理方法与衰竭式开发相同,而模型二的相渗处理在衰竭式开发基础上,另增加了模型一中渗透率最低、居中和最高(即低渗、中渗和高渗层)的3条相渗曲线,因为通过求取地层参数平均值计算相渗的单层模型模拟结果较差,改用推导模型计算,即采用5种相渗模式进行数值模拟(表 3)。
|
|
下载CSV 表 3 胜利油田孤岛油田新近系馆陶组砂岩油藏根据相渗表征模型计算低渗、中渗和高渗层的相渗参数 Table 3 Relative permeability parameters of low, medium and high permeability layers according to relative permeability characterization model of sandstone reservoir of Neogene Guantao Formation in Gudao oilfield, Shengli Oilfield |
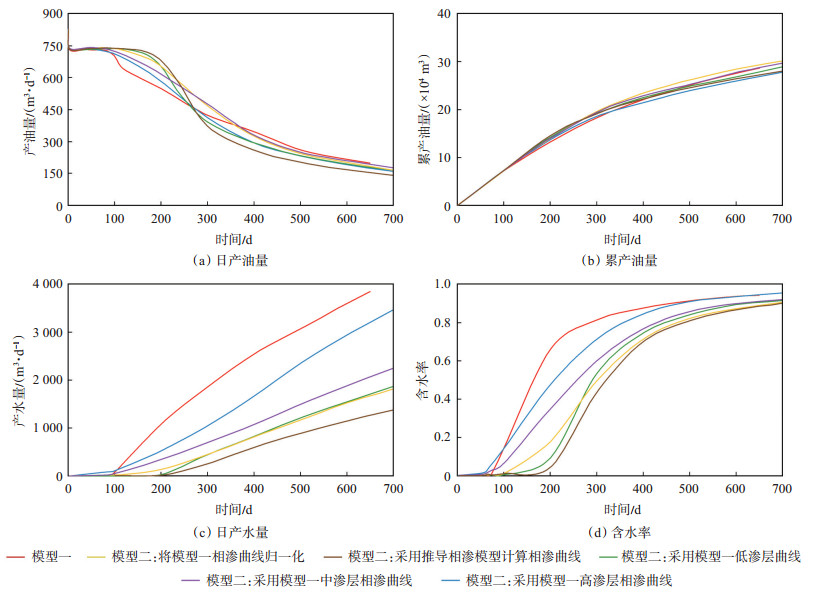
根据模拟结果(图 24):在正韵律地层注水开发中,单层模型与多层非均质模型的模拟结果差异不大,但产水的动态差异大,分析认为水的黏度小,相对产量大,说明非均质性会强化水对生产动态的影响;采用高渗层相渗的单层模型与多层非均质模型模拟的生产动态更接近,分析认为高渗层对产量,主要是产水量的贡献大。
|
下载原图 图 24 胜利油田孤岛油田新近系馆陶组砂岩油藏2种模型模拟正韵律层段注水开发结果对比 Fig. 24 Numerical reservoir simulation results of two models by using waterflood development strategy for positive rhythm of sandstone reservoir of Neogene Guantao Formation in Gudao oilfield, Shengli Oilfield |
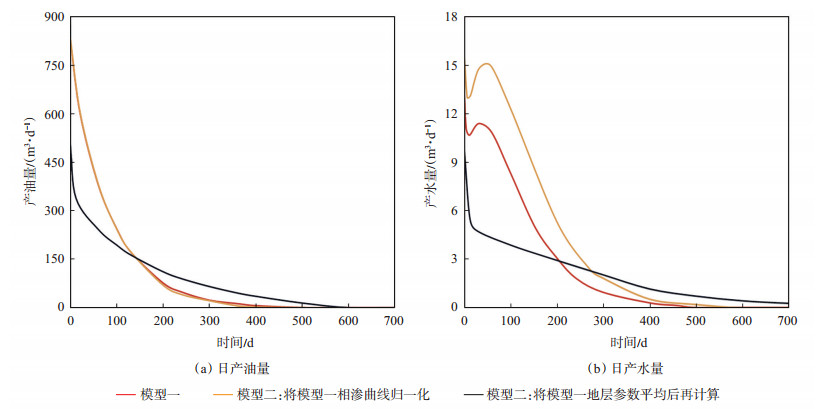
反韵律层段模型的建立及其相渗处理方法均与正韵律层段相同,仅改变地层渗透率韵律分布。从衰竭式开发模拟结果(图 25)可知:归一化处理后的相渗单层模型与多层非均质模型模拟的生产动态特征相似,产油动态基本一致,产水动态趋势一致;通过求取地层参数平均值计算相渗的单层模型模拟结果与多层非均质模型差异较大。
|
下载原图 图 25 胜利油田孤岛油田新近系馆陶组砂岩2种模型模拟油藏反韵律层段衰竭式开发结果对比 Fig. 25 Numerical reservoir simulation results of two models by using depletion development strategy for reverse rhythm of sandstone reservoir of Neogene Guantao Formation in Gudao oilfield, Shengli Oilfield |
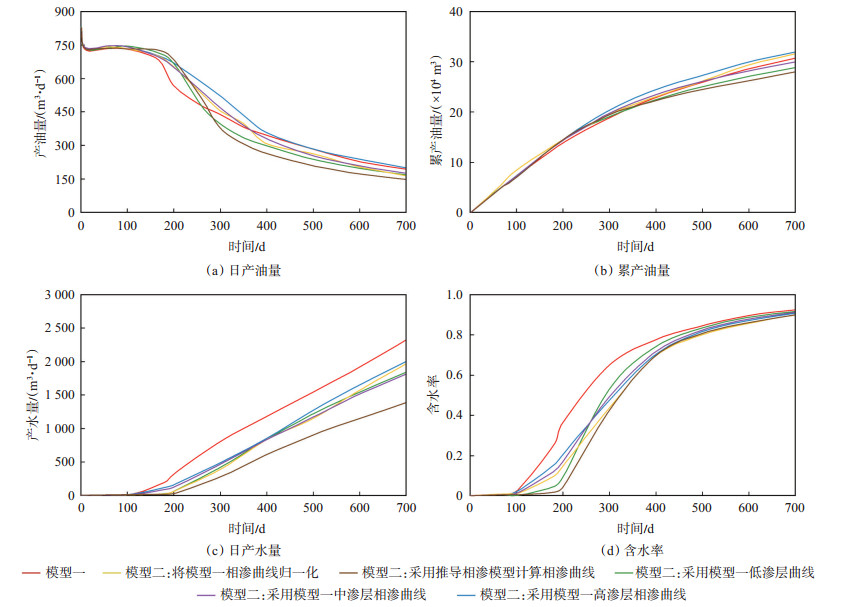
反韵律层段注水开发模拟结果(图 26)与正韵律层段注水开发的模拟结果一致:采用不同相渗处理方法的单层模型与多层非均质模型的计算结果差异不太大,但产水的动态差异明显;采用高渗层相渗的单层模型与多层非均质模型模拟的生产动态更接近。
|
下载原图 图 26 胜利油田孤岛油田新近系馆陶组砂岩油藏2种模型模拟反韵律层段注水开发结果对比 Fig. 26 Numerical reservoir simulation results of two models by using waterflood development strategy for reverse rhythm of sandstone reservoir of Neogene Guantao Formation in Gudao oilfield, Shengli Oilfield |
复合韵律模型及其相渗处理方法与正、反韵律模型一致,但在模型二中增加了一个介于中渗层和高渗层之间的相渗曲线以更加精细地进行模拟分析(表 4)。
|
|
下载CSV 表 4 胜利油田孤岛油田新近系馆陶组砂岩储层根据相渗表征模型计算中—高渗层相渗参数 Table 4 Relative permeability parameters of medium-high permeability layers according to relative permeability characterization model of sandstone reservoir of Neogene Guantao Formation in Gudao oilfield, Shengli Oilfield |
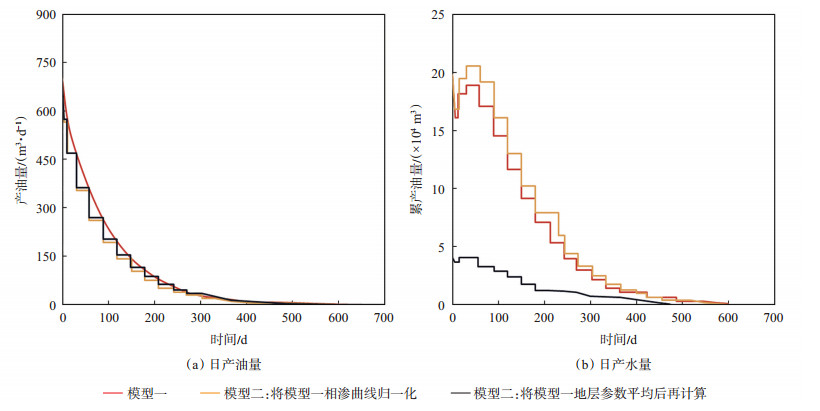
由模拟结果(图 27)可知:在复合韵律地层衰竭式开发中,归一化处理相渗的单层模型与多层非均质模型模拟的生产动态特征相似,产油、产水动态趋势均一致;通过求取地层参数平均值计算相渗参数的单层模型模拟结果与多层非均质模型模拟的产油动态基本一致,但产水的动态差异较大,说明对于非均质的储层,将相渗曲线归一化处理更合适。
|
下载原图 图 27 胜利油田孤岛油田新近系馆陶组砂岩油藏2种模型模拟复合韵律层段衰竭式开发结果对比 Fig. 27 Numerical reservoir simulation results of two models by using depletion development strategy for complex rhythm of sandstone reservoir of Neogene Guantao Formation in Gudao oilfield, Shengli Oilfield |
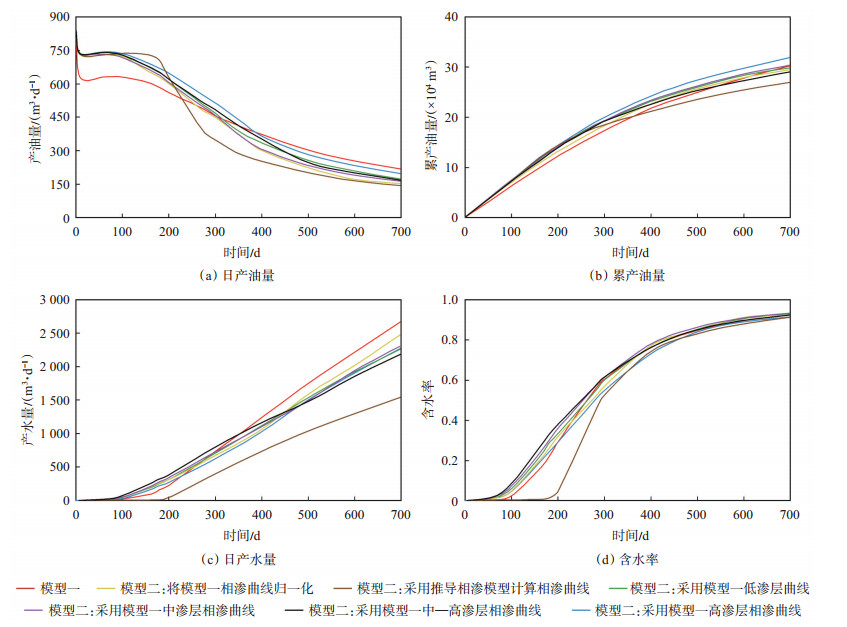
由复合韵律地层注水开发模拟结果(图 28)可渗层的相渗的单层模型和多层非均质模型模拟的知:采用不同相渗处理的单层模型与多层非均质模产水动态比较一致,但非均质多层模型的产水量更型的计算结果在生产早期有一定的差异,而在中后高;中渗层和高渗层的产油量和产水量贡献均相差期差异不大;除采用低渗层相渗外,采用中渗层、高不大,采用中—高渗层相渗的单层模型与复合韵律多层模型模拟的生产动态基本一致。
|
下载原图 图 28 胜利油田孤岛油田新近系馆陶组砂岩油藏2种模型模拟复合韵律层段注水开发结果对比 Fig. 28 Numerical reservoir simulation results of two models by using waterflood development strategy for complex rhythm of sandstone reservoir of Neogene Guantao Formation in Gudao oilfield, Shengli Oilfield |
(1)利用交替条件期望方法对实测得到的相渗曲线端点特征和曲线形态进行解剖与回归统计,建立的油水相渗曲线端点表征模型和曲线形态表征模型,模型精度较高,油水相渗曲线端点表征模型的绝对误差都小于0.1,形态表征模型的绝对误差小于1.7。
(2)在砂岩油藏的衰竭式开发中,生产动态主要受油相相渗的影响,当非均质性认识不是很清楚时,采用归一化方法处理的相渗曲线能够在一定程度上消除非均质性带来的影响。
(3)在砂岩油藏注水开发模拟中,由于油水性质的差异,通常水对总产量的贡献更大,水相相渗对整个生产动态影响大,非均质性的存在会加剧其影响;采用对产油量贡献最大的储层(可根据地层渗透率和有效厚度乘积K·h的大小来确定)的相渗曲线,模拟生产动态更能接近实际生产动态。
| [1] |
徐春梅, 张荣, 马丽萍, 等. 注水开发储层的动态变化特征及影响因素分析. 岩性油气藏, 2010, 22(增刊1): 89-92. XU Chunmei, ZHANG Rong, MA Liping, et al. Reservoir dynamic variation characteristics after water flooding and its influencing factors. Lithologic Reservoirs, 2010, 22(Suppl 1): 89-92. |
| [2] |
周丛丛. 聚合物驱相对渗透率计算的微观模拟研究. 岩性油气藏, 2011, 23(3): 119-123. ZHOU Congcong. Microscopic simulation of relative permeability curves in polymer flooding. Lithologic Reservoirs, 2011, 23(3): 119-123. DOI:10.3969/j.issn.1673-8926.2011.03.023 |
| [3] |
张人雄, 李玉梅, 李建民, 等. 砂砾岩油藏油水相对渗透率曲线异常形态成因探讨. 石油勘探与开发, 1996, 23(2): 79-83. ZHANG Renxiong, LI Yumei, LI Jianmin, et al. An approach to the origin of anomalous shape of oil-water relative permeability curves in sandstone and conglomerate reservoirs. Petroleum Exploration and Development, 1996, 23(2): 79-83. DOI:10.3321/j.issn:1000-0747.1996.02.020 |
| [4] |
姜瑞忠, 乔欣, 滕文超, 等. 储层物性时变对油藏水驱开发的影响. 断块油气田, 2016, 23(6): 768-771. JIANG Ruizhong, QIAO Xin, TENG Wenchao, et al. Impact of physical properties time variation on waterflooding reservoir development. Fault-Block Oil & Gas Field, 2016, 23(6): 768-771. |
| [5] |
李传亮, 朱苏阳. 关于油藏含水上升规律的若干问题. 岩性油气藏, 2016, 28(3): 1-5. LI Chuanliang, ZHU Suyang. Some topics about water cut rising rule in reservoirs. Lithologic Reservoirs, 2016, 28(3): 1-5. DOI:10.3969/j.issn.1673-8926.2016.03.001 |
| [6] |
薛建强, 覃孝平, 赖南君, 等. 超低渗透油田降压增注体系的研究与应用. 岩性油气藏, 2013, 25(6): 107-111. XUE Jianqiang, QIN Xiaoping, LAI Nanjun, et al. Research and application of depressurization and stimulation of injection well for ultra-low permeability oilfield. Lithologic Reservoirs, 2013, 25(6): 107-111. DOI:10.3969/j.issn.1673-8926.2013.06.020 |
| [7] |
王曙光, 赵国忠, 余碧君. 大庆油田油水相对渗透率统计规律及其应用. 石油学报, 2005, 26(3): 78-81. WANG Shuguang, ZHAO Guozhong, YU Bijun. Statistical regularity of oil-water relative permeability in Daqing oilfield. Acta Petrolei Sinica, 2005, 26(3): 78-81. DOI:10.3321/j.issn:0253-2697.2005.03.017 |
| [8] |
ROGHANIAN R, REZA R M, HAGHIGHI M. Prediction of key points of water-oil relative permeability curves using the linear regression technique. Petroleum Science and Technology, 2012, 30(5): 518-533. DOI:10.1080/10916461003773054 |
| [9] |
王东琪, 殷代印. 水驱油藏相对渗透率曲线经验公式研究. 岩性油气藏, 2017, 29(3): 159-164. WANG Dongqi, YIN Daiyin. Empirical formulas of relative permeability curve of water drive reservoirs. Lithologic Reservoirs, 2017, 29(3): 159-164. |
| [10] |
王守磊, 李治平, 耿站立, 等. 油水相对渗透率曲线预测模型建立及应用. 科学技术与工程, 2018, 18(12): 52-59. WANG Shoulei, LI Zhiping, GENG Zhanli, et al. The establishment and application of prediction model for oil-water relative permeability curve. Science Technology and Engineering, 2018, 18(12): 52-59. |
| [11] |
AL-OTAIBI S S, AL-MAJED A A. Factors affecting pseudo relative permeability curves. Journal of Petroleum Science and Engineering, 1998, 21(3): 249-261. |
| [12] |
ABOUJAFAR S M. Effect of oil viscosity and brine salinity / viscosity on water /oil relative permeability and residual saturations[R]. Abu Dhabi: SPWLA 55th Annual Logging Symposium, 2017.
|
| [13] |
孙艳宇. 低渗透油藏油水相渗曲线影响因素分析. 辽宁化工, 2017, 46(1): 53-55. SUN Yanyu. Analysis on influence factors of oil-water relative permeability curve in low permeability reservoirs. Liaoning Chemical Industry, 2017, 46(1): 53-55. |
| [14] |
董大鹏. 非稳态相渗实验数据的处理方法. 西南石油大学学报(自然科学版), 2014, 36(6): 110-116. DONG Dapeng. Processing method to the data of relative permeability in unsteady state displacement. Journal of Southwest Petroleum University(Science & Technology Edition), 2014, 36(6): 110-116. |
| [15] |
汤述安, 郑泽忠, 朱学波. 多元回归分析在油气产能预测中的应用. 科技创新导报, 2008(21): 169-171. TANG Shu'an, ZHENG Zezhong, ZHU Xuebo. Application of multiple regression analysis in oil and gas capacity forecasting. Science and Technology Innovation Herald, 2008(21): 169-171. |
| [16] |
邵长金, 李相方. 用交替条件期望变换确定岩石物性参数. 天然气工业, 2005, 25(7): 30-31. SHAO Changjin, LI Xiangfang. Determining petrophysical parameters by alternating conditional expectation transform. Natural Gas Industry, 2005, 25(7): 30-31. |
| [17] |
BREIMAN L, FRIEDMAN J H. Estimating optimal transformations for multiple regression and correlation. Journal of the American Statistical Association, 1985, 80(391): 580-598. |
| [18] |
李宁, 孙雷, 潘毅, 等. 油水相渗曲线归一化新方法研究. 复杂油气藏, 2015, 8(1): 38-40. LI Ning, SUN Lei, PAN Yi, et al. A new method for normalizing oil-water relative permeability curves. Complex Hydrocarbon Reservoirs, 2015, 8(1): 38-40. |
| [19] |
潘婷婷, 张枫, 邢昆明, 等. 不同储层相对渗透率曲线归一化方法评价. 大庆石油地质与开发, 2016, 35(3): 78-82. PAN Tingting, ZHANG Feng, XING Kunming, et al. Evaluation of the relative-permeability-curve normalizing method for the different reservoirs. Petroleum Geology & Oilfield Development in Daqing, 2016, 35(3): 78-82. |
| [20] |
刘丹, 潘保芝, 陈刚, 等. 致密砂岩气水相渗曲线的统一描述方法. 地球物理学进展, 2015, 30(1): 300-303. LIU Dan, PAN Baozhi, CHEN Gang, et al. Unified description on compact sandstone gas-water relative permeability curve. Progress in Geophysics, 2015, 30(1): 300-303. |
 2023, Vol. 35


