2. 中国农业大学马研究中心, 北京 100193
2. Equine Center of China Agricultural University, Beijing 100193, China
自古以来,康西草原是北京地区马匹的主产区, 也是北京近郊的第一大草场。该地气候冬冷夏凉,年平均气温8 ℃,是著名的避暑胜地。该地区土壤中含有丰富的矿物质元素,土质疏松[1],水源充足。当地的草场和农副产品为养马提供了有利的条件[2]。在上个世纪早期,当地马匹主要供农役和军用。随着时间的推移,该地区旅游业逐渐发展起来,马匹的作用也发生了变化,更多向着骑乘娱乐方向发展。本地马多被淘汰,当地马主为适应游客的需求逐渐引进国外的骑乘型马,但由于缺乏品种登记信息,许多马的品种来源不明,这给该群体的资源评价、进一步培育和开发利用带来了困难。近几十年来,不断成熟的分子生物学技术为马品种起源分析和资源评估提供了有力的手段。本研究拟采用微卫星DNA位点多态性分析技术对该地区马匹进行群体遗传学研究。
微卫星DNA作为多态性丰富且容易获得的基因标记,广泛用于构建物种的遗传连锁图谱、基因鉴定、物种进化、群体间亲缘关系分析以及系谱鉴定等方面[3]。该技术在马的遗传学研究中应用也很广泛,如为确定关中马的遗传多样性和验证其系谱记录,有学者采用8个微卫星标记对67个关中马个体进行了基因分型[4];利用微卫星DNA确定沙漠型阿位伯马与埃及、波兰阿拉伯马之间的关系,并分析它们的起源和形成过程[5];在利用微卫星DNA对马尔查多马群体结构进行研究中揭示了群体间的基因流动,以及与其他马品种的遗传关系,为该马品种的进一步培育打下了基础[6]。除此之外,还有利用微卫星DNA检测技术对吉尔吉斯马[7]、约纳古尼马[8]、宫古马[9]、利皮赞马[10]、比戈拉吉马[11]、野马[12]、西班牙矮马[13]和委内瑞拉克里奥罗马[14]等的研究。国内外利用微卫星DNA分子标记技术探索马匹来源的研究众多,也为本研究提供了参考依据。本研究以康西草原的马群体为研究对象,拟研究其起源及群体结构,为遗传资源评估和将来进一步的开发利用打下坚实的基础。
1 材料与方法 1.1 试验材料本研究选择6个马群体,国内品种为百色马,国外品种包括温血马、阿哈捷金马、阿拉伯马和纯血马,分别从德国、俄罗斯(阿哈捷金马、阿拉伯马)、爱尔兰引入我国,在北京周边马术俱乐部采集样本。百色马在我国的广西省百色市采集血样,6个马种群的信息见表 1。血液样品低温运回于试验室-80 ℃冰箱保存。
|
|
表 1 6个马种群的来源 Table 1 Origins of 6 horse populations |
本研究使用血液基因组DNA提取试剂盒(天根生化科技有限公司, 北京)进行DNA提取, 采用1%琼脂糖凝胶电泳检测DNA样品质量;超微量核酸蛋白测定仪(OD260 nm/OD280 nm)测定DNA浓度,并将浓度调至30 ng·μL-1。试验采用国际动物遗传协会(International Society For Animal Genetics)和联合国粮农组织(The Food And Agriculture Organization)联合推荐的马属动物遗传多态性的12个微卫星标记(HTG4、HTG10、HMS2、HMS3、HMS6、VHL20、ASB2、AHT5、AHT4、HMS7、ASB17、ASB23)。
微卫星DNA位点扩增试验采用ABI公司的马亲子鉴定试剂盒来操作,具体步骤详见说明书,扩增引物信息见表 2。PCR-STR扩增产物经电泳鉴定后采用毛细管电泳法测定扩增的微卫星片段大小。其中在自动测序仪(ABI PRISM遗传分析仪3730Xl)进行的基因扫描由北京诺赛基因组研究中心有限公司完成。返回数据利用PeakScannerSoftwarev1.0软件读取并记录, 根据标准品进行校正, 判断片段大小。
|
|
表 2 12个微卫星位点的信息 Table 2 The information of 12 microsatellite loci |
1.3.1 遗传多样性分析 利用GENALEX 6.0软件计算各群体的等位基因数(number of alleles, Na)、有效等位基因数(effective number of alleles, Ne)、期望杂合度(expected heterozygosity, He)、多态信息含量(polymorphism information content, PIC)、观察杂合度(observed heterozygosity, Ho)、Shannon信息指数(Shannon information index, I) 和等位基因丰富度等(allelic richness,AR)等遗传参数[15]。使用在线GENEPOP分析软件的费舍尔精确测试法求出各单位点的平均P值,用以检测在单位点水平各位点基因型频率是否偏离哈迪-温伯格平衡(Hardy-Weinberg equilibrium, HWE)以及是否处于连锁不平衡(linkage disequilibrium, LD)的状态[16]。
1.3.2 遗传分化和瓶颈分析 利用Arlequin 3.1.0.2软件计算遗传分化系数(genetic differentiation coefficient,Fst)来评估群体间的遗传分化程度,并用Bootstrap进行1 000次重复抽样以检验Fst的置信水平。为探讨遗传距离与地理距离之间的相互关系,进行了距离隔离模式分析(isolation by distance,IBD)。种群间的Nei’s遗传距离由POPGENE3.2软件计算获得,地理距离则以各种群的实际经纬度换算得到。利用SPSS软件分析延庆地区马群体与其他马种群之间地理距离和遗传距离之间的Mantel相关性分析。利用BOTTLENECK 1.2.02软件用来分析各马种群的瓶颈效应。分析假设为一个无限等位基因模型(infinite allele model, IAM),一个逐步突变模型(step-wise mutation mode, SMM)和两阶段模型(two phased model of mutation, TPM),并使用双尾Wilcoxon符号秩检验在5%的概率水平下对不同的模型进行评估[17]。
1.3.3 群体遗传结构分析 利用POPGENE3.2软件计算各群体之间的遗传距离。Bootstrap重复抽样1 000次,对各分支自检,确定置信水平。使用MEGA 7.0根据群体间Nei’s标准遗传距离采用UPGMA进行聚类分析。利用Structure 2.2软件通过贝叶斯聚类方法分析种群遗传结构,采用的是马尔科夫链蒙特卡洛算法(Markov chain monte car, MCMC)。K值选择2~7,对每个值重复6次,预热100 000次并舍弃,随后进行1 000 000次重复正式计算。为了进一步描述不同地理种群间的遗传结构情况,使用GENETIX 4.02软件中的相关因子分析程序(factor analysis,FCA)进行群体的三维主成分聚类分析[18]。
2 结果 2.1 遗传多样性对本研究中的6个马群体的12个微卫星DNA位点进行多态性分析,共检测到221个等位基因。有效等位基因数(Ne)介于3.649~5.397, 平均为4.405。期望杂合度(He)最低为0.681,最高为0.798。观测杂合度(Ho)介于0.632~0.780之间,多态信息含量(PIC)介于0.643~0.772, 为高度多态(PIC>0.5)。平均等位基因丰富度(AR)为7.366,总体范围在5.132~9.156之间。Shannon指数(I)在1.372~1.829之间(表 3)。
|
|
表 3 6个马群体总遗传参数 Table 3 Total genetic parameters of the 6 horse populations |
采用GENEPOP4.0软件通过马尔可夫链方法检测每个种群在各位点是否符合哈迪-温伯格平衡(HWE)以及是否处于连锁不平衡(LD)的状态。6个马匹种群12个位点的哈温平衡检验结果通过Bonferroni校正过后的P值为0.006 5。大多数位点的P值都大于校正值(P=0.006 5)。其中康西草原马群体的HTG4和HMS3位点、纯血马的HMS7和HMS2位点、阿拉伯马的HMS2等单位点偏离了哈温平衡(P < 0.006 5, 表 4)。进一步对各位点进行连锁不平衡分析,同样通过Bonferroni方法进行校正。结果显示,大多数位点处于连锁平衡,而只有HMS3和AHT4之间处于连锁不平衡的状态(表 5)。
|
|
表 4 微卫星DNA位点的哈迪-温伯格平衡分析 Table 4 Analysis of Hardy-Weinberg equilibrium on each microsatellite DNA site |
|
|
表 5 微卫星DNA位点连锁不平衡分析 Table 5 Linkage disequilibrium analysis on each microsatellite DNA site |
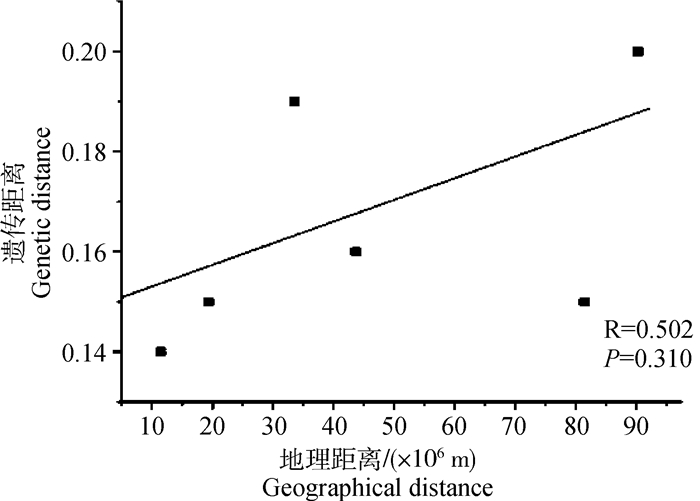
各群体之间的Fst在0.061~0.145,总体来说群体间分化程度较低(Fst < 0.15)。通过观察康西草原马群体与其他马群体间的分化程度发现, 该群体与温血马之间的分化程度最小,为0.038,说明两个群体之间最有可能存在基因交流(表 6)。为了进一步了解遗传距离与地理距离的相关性,绘制了基于Nei’s遗传距离与地理距离之间的Mantel相关分析图(图 1)。结果发现两者之间处于正相关,但是P值并不显著。根据微卫星位点的等位基因频率,基于3种不同的假设IAM、SMM、TPM三种模型进行瓶颈效应分析。结果显示温血马、纯血马、百色马以及康西草原马种群在不同模型下都经历了不同程度瓶颈效应的影响。其中康西草原马种群在IAM模型下P值极显著(表 7),说明该群体在历史上数量有大幅度的减少,可能发生过大规模的迁移。
|
|
表 6 各群体间群体分化系数(Fst) Table 6 Population differentiation coefficient among populations (Fst) |

|
图 1 基于Nei’s遗传距离与地理距离之间Mantel相关性检验 Fig. 1 Mantel correlation test based on Nei's genetic distance and geographical distance |
|
|
表 7 6个马匹种群瓶颈效应分析 Table 7 Bottleneck effect analysis of the 6 horse populations |
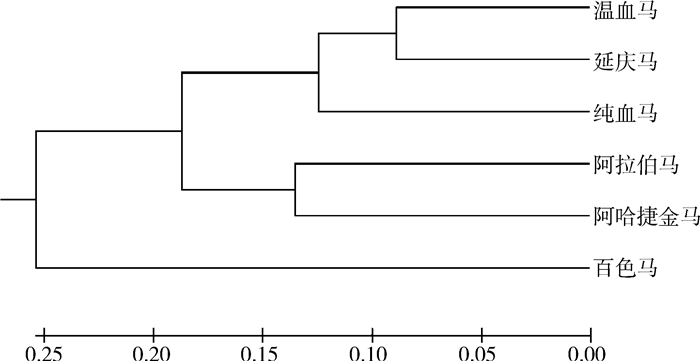
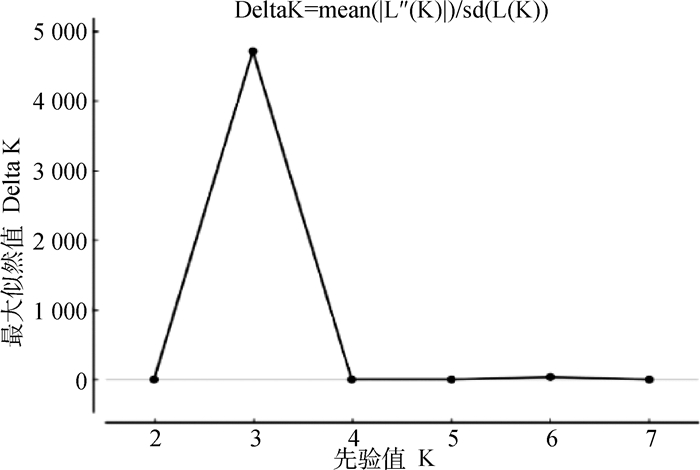
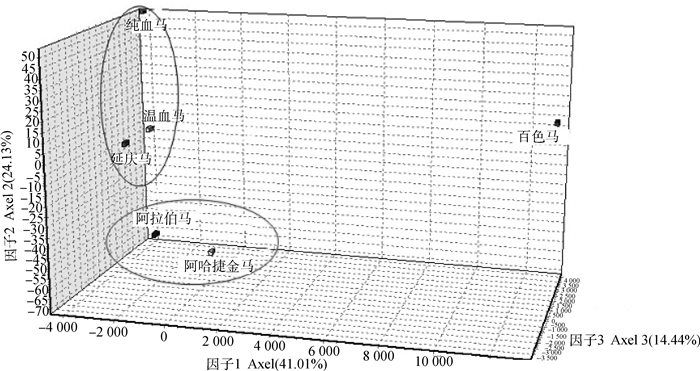
利用MEGA 7.0软件构建基于Nei’s标准遗传距离的UPGMA树状图。通过树状图发现6个马群体分为3组。其中温血马、康西草原地区马群体以及纯血马聚为一类,阿拉伯马和阿哈捷金马聚为一类,百色马单独聚为一类(图 2)。基于Structure的贝叶斯聚类分析结果表明,经过6次重复的分群测试,结果显示当K=3时,Delta K出现明显拐点且取得最大值(图 3),说明6个种群可划分3个亚群。第一个亚群为温血马、康西草原地区马群体和纯血马;第二个亚群为阿拉伯马和阿哈捷金马;第三个亚群为百色马(图 4),这与UPGMA的结果相同。因子相关分析(FCA)显示了与UPGMA树状图和Structure贝叶斯聚类分析一致的结果(图 5)。

|
图 2 基于Nei’s标准遗传距离UPGMA树状图 Fig. 2 UPGMA tree based on Nei's standard genetic distance |

|
图 3 Delta K在K=3时得到最大值 Fig. 3 Maximum value of Delta K when K=3 |

|
每个矩形代表一个群体 Each rectangle represents a group 图 4 Structure贝叶斯聚类分析 Fig. 4 Structure Bayesian cluster analysis |

|
图 5 FCA因子分析定义的各群体空间表现图示 Fig. 5 Spatial representation of each group defined by FCA factor analysis |
微卫星标记已被证明是对遗传多样性和群体遗传学研究有效的方法之一[19]。目前,微卫星DNA标记技术已经成为检测物种多样性的重要手段,大量的微卫星数据用于牛、羊、马等物种的遗传多样性和群体结构分析。通过遗传多样性的评估可了解品种的遗传结构以及分析其进化的历史和潜力[20]。动物种群的遗传多样性可以通过每个基因座的等位基因数量、等位基因丰富度和杂合度等参数来估计。当然微卫星的方法也用于解决其他问题[21-25]。在本研究中通过12个微卫星位点的多态性检测,在6个种群中共检测到221个等位基因。所有被测的6个马种群遗传多样性水平都较高,各遗传参数都略高于以往的一些马品种上的研究[26-29],这可能与所采样品的代表性有关。多态信息含量(PIC)是评价微卫星位点的重要参考标准, 若PIC>0.5表明该位点具有高度多态性, 若0.25 < PIC < 0.5表明该位点具有中度多态性, 若PIC < 0.25表明该位点具有低度多态性。6个马种群多态信息含量都在0.6以上。评价遗传多样性另一个最重要参数是等位基因杂合性,该参数提供有关种群结构的信息,高值意味着等位基因多样性更大。本研究中各群体观测杂合度及期望杂合度均具有较高水平(Ho>0.6, He>0.6)。这些遗传参数明显高于之前的研究[30-33]。导致遗传参数都较高的原因与群体间的分化系数(Fst)有关系,较大基因流导致了群体内基因的杂合度上升。
Wright[34]认为,当Fst < 0.05时,两种群几乎无分化;当0.05 < Fst < 0.15时,种群中度分化;当0.15 < Fst < 0.25时,种群发生明显分化;当Fst>0.25时,种群极度分化[35]。康西草原地区马群体与其他各种群间的分化程度集中在0.038~0.145之间。总体上处于低分化的状态(Fst < 0.05),这与先前的研究利比赞品种[36]、阿尔及利亚马[37]、印度品种[38]和波兰原始马[39]的Fst值还要略低。分化低意味着有基因流存在。在品种培育过程中,从阿拉伯马到纯血马、从纯血马到温血马都有过显著的基因流,这与本研究的结果相符。延庆马与温血马和纯血马分化程度也很低,表明了它们之间可能存在密切的遗传关系。通过Mantel相关性分析揭示了地理距离和遗传距离之间的关系,两者处于正相关的关系(R=0.502)。但两者之间的关系不显著性(P>0.1)。这就说明地理距离并没有成为康西草原马群体与其他群体间的基因流动的阻碍,这可能与该地区马主常年进口大量国外马息息相关。瓶颈效应分析显示康西草原马群体在IAM模型下表现出了显著性杂合子过剩的情况发生。当地旅游业的发展导致运动性能欠佳的本地品种逐渐失去用武之地,而性能优良的国外骑乘马受到当地的欢迎。这样地方品种被马主售卖,马匹数量在历史上有大幅度的减少,这可能是造成康西草原马群体瓶颈效应的主要原因。
UPGMA树状图、相关因子分析(FCA)以及Structure贝叶斯聚类分析都显示6个群体分为3大类。其中康西草原马群体与温血马和纯血马聚为一类,说明他们之间的血缘关系最近。这就表明了这些马的来源与温血马、纯血马这类骑乘马密切相关。但这并不能认为该马群体与地方马之间无血缘关系。通过群体分化系数(Fst)显示百色马与康西草原马群体之间分化程度较低,说明该群体与地方马之间也有基因交流存在,即该地区马群体中有地方马的血统。马种群的遗传结构反映了包括长期进化历史在内的各种过程的相互作用[40],一般地理隔离是造成群体分化的主要原因。地理距离与遗传距离的Mantel相关分析显示正相关表明了这一点。虽然由于交通运输的便利使得遗传距离与地理距离关系并不显著[4],但是地理距离远的马之间也有可能存在一定的基因流动。
4 结论本研究结果表明,康西草原马群体具有较高的遗传多样性,该群体的来源与温血马和纯血马等国外优良骑乘型马品种的引入密切相关。本研究的结果对于延庆地区马的育种具有重要的参考价值。
致谢: 感谢北京市延庆区康西草原各大马场马主对采样工作的支持。如上资助来源于家养动物种质资源库。
| [1] |
候慕惋. 吃在"夏都"延庆[J]. 食品与健康, 2017(7): 8. HOU M W. Eating in Yanqing, the "summer capital"[J]. Food and Health, 2017(7): 8. (in Chinese) |
| [2] |
尹钧科. 延庆县——历史文化宝地[J]. 北京社会科学, 1992(4): 25-29, 14. YIN J K. Yanqing County——a treasure of history and culture[J]. Beijing Social Sciences, 1992(4): 25-29, 14. (in Chinese) |
| [3] |
杨章平, 常洪, 孙伟, 等. 7个绵羊微卫星DNA标记在绵(山)羊群体中的多态性检测[J]. 西北农林科技大学学报: 自然科学版, 2004(12): 69-74. YANG Z P, CHANG H, SUN W, et al. Ivestigation on polymorphism of 7 sheep microsatellite markers in sheep (goat) populations[J]. Journal of Northwest Sci-Tech University of Agriculture and Forestry, 2004(12): 69-74. (in Chinese) |
| [4] |
ZENG L L, CHEN N B, YAO Y B, et al. Analysis of genetic diversity and structure of Guanzhong horse using microsatellite markers[J]. Anim Biotechnol, 2019, 30(1): 95-98. DOI:10.1080/10495398.2017.1416392 |
| [5] |
MACHMOUM M, BOUJENANE I, AZELHAK R, et al. Genetic diversity and population structure of Arabian horse populations using microsatellite markers[J]. J Equine Vet Sci, 2020, 93: 103200. DOI:10.1016/j.jevs.2020.103200 |
| [6] |
BAENA M M, DIAZ S, MOURA R S, et al. Genetic characterization of Mangalarga marchador breed horses based on microsatellite molecular markers[J]. J Equine Vet Sci, 2020, 95: 103231. DOI:10.1016/j.jevs.2020.103231 |
| [7] |
ISAKOVA Z T, TOKTOSUNOV B I, KIPEN V N, et al. Phylogenetic analysis of Kyrgyz horse using 17 microsatellite markers[J]. Russ J Genet, 2019, 55(1): 100-104. DOI:10.1134/S1022795419010071 |
| [8] |
SENJU N, TOZAKI T, KAKOI H, et al. Genetic diversity of the Yonaguni horse based on polymorphisms in microsatellites and mitochondrial DNA[J]. J Vet Med Sci, 2017, 79(2): 425-431. DOI:10.1292/jvms.16-0040 |
| [9] |
SENJU N, TOZAKI T, KAKOI H, et al. Genetic characterization of the Miyako horse based on polymorphisms of microsatellites and mitochondrial DNA[J]. J Vet Med Sci, 2016, 79(1): 218-223. |
| [10] |
ACHMANN R, CURIK I, DOVC P, et al. Microsatellite diversity opulation subdivision in gene flow in the Lipizzanhorse[J]. Anim Genet, 2004, 35(4): 285-292. DOI:10.1111/j.1365-2052.2004.01157.x |
| [11] |
RIBEIRO M, SOARES C N, GUIMARÃES C S, et al. Allelic diversity and forensic performance of 17 microsatellite markers in Brazilian Criollo and Campolina horse breeds[J]. J Exp Zool A Ecol Genet Physiol, 2005, 51. |
| [12] |
VEGA-PLA J L, CALDERÓN J, RODRÍGUEZ-GALLARDO P P, et al. Saving feral horse populations: does it really matter?A case study of wild horses from Doñana National park in southern Spain[J]. Anim Genet, 2006, 37(6): 571-578. DOI:10.1111/j.1365-2052.2006.01533.x |
| [13] |
AZOR P J, VALERA M, GÓMEZ M D, et al. Genetic characterization of the Spanish trotter horse breed using microsatellite markers[J]. Genet Mol Biol, 2007, 30(1): 37-42. DOI:10.1590/S1415-47572007000100009 |
| [14] |
COTHRAN E G, CANELON J L, LUIS C, et al. Genetic analysis of the Venezuelan Criollo horse[J]. Genet Mol Res, 2011, 10(4): 2394-2403. DOI:10.4238/2011.October.7.1 |
| [15] |
PEAKALL R, SMOUSE P E. GENALEX 6:genetic analysis in Excel.population genetic software for teaching and research[J]. Mol Ecol Notes, 2006, 6(1): 288-295. DOI:10.1111/j.1471-8286.2005.01155.x |
| [16] |
GUO S W, THOMPSON E A. Performing the exact test of Hardy-Weinberg proportion for multiple alleles[J]. Biometrics, 1992, 48(2): 361-372. DOI:10.2307/2532296 |
| [17] |
PIRY S, LUIKART G, CORNUET J M. Computer note.BOTTLENECK: a computer program for detecting recent reductions in the effective size using allele frequency data[J]. J Hered, 1999, 90(4): 502-503. DOI:10.1093/jhered/90.4.502 |
| [18] |
AGUNG P P, SAPUTRA F, ZEIN M S A, et al. Genetic diversity of Indonesian cattle breeds based on microsatellite markers.[J]. Asian-Australas J Anim Sci, 2019, 32(4): 467-476. |
| [19] |
ELLEGREN H, JOHANSSON M, SANDBERG K, et al. Cloning of highly polymorphic microsatellites in the horse[J]. Anim Genet, 1992, 23(2): 133-142. |
| [20] |
BALOCH F S, ALSALEH A, DE MIERA L E S, et al. DNA based iPBS-retrotransposon markers for investigating the population structure of pea (Pisum sativum) germplasm from Turkey[J]. Biochem Syst Ecol, 2015, 61: 244-252. DOI:10.1016/j.bse.2015.06.017 |
| [21] |
殷彬, 岳书俭, 俞英, 等. 奶牛分子系谱构建或亲权鉴定的微卫星标记筛选[J]. 畜牧兽医学报, 2017, 48(4): 595-604. YIN B, YUE S J, YU Y, et al. Selection of microsatellite markers used for pedigree tree construction and/or paternity testing in chinese holstein cows[J]. Acta Veterinaria et Zootechnica Sinica, 2017, 48(4): 595-604. (in Chinese) |
| [22] |
王志刚, 吴建平, 刘丑生, 等. 应用微卫星标记分析中国地方山羊瓶颈效应[J]. 畜牧兽医学报, 2010, 41(6): 664-670. WANG Z G, WU J P, LIU C S, et al. Bottleneck effect analysis of chinese goat breeds using microsatellites[J]. Acta Veterinaria et Zootechnica Sinica, 2010, 41(6): 664-670. (in Chinese) |
| [23] |
段修军, 王丽华, 龚道清, 等. 利用微卫星标记检测金定鸭小群保种效果[J]. 畜牧兽医学报, 2008, 39(9): 1159-1164. DUAN X J, WANG L H, GONG D Q, et al. Analysis on conserved effect of small population in Jinding duck using microsatellite markers[J]. Acta Veterinaria et Zootechnica Sinica, 2008, 39(9): 1159-1164. (in Chinese) |
| [24] |
初芹, 张毅, 孙东晓, 等. 应用微卫星DNA标记分析荷斯坦母牛系谱可靠性及影响因素[J]. 畜牧兽医学报, 2011, 42(2): 163-168. CHU Q, ZHANG Y, SUN D X, et al. Pedigree verification of Holstein cows and analysis of factors affecting incorrect paternity based on microsatellite markers[J]. Acta Veterinaria et Zootechnica Sinica, 2011, 42(2): 163-168. (in Chinese) |
| [25] |
毛永江, 常洪, 杨章平, 等. 3种不同利用微卫星标记进行个体识别方法的比较研究[J]. 畜牧兽医学报, 2008, 39(9): 1171-1175. MAO Y J, CHANG H, YANG Z P, et al. Comparison between 3 individual identification methods using microsatellite markers[J]. Acta Veterinaria et Zootechnica Sinica, 2008, 39(9): 1171-1175. (in Chinese) |
| [26] |
CORTÉS O, DUNNER S, GAMA L T, et al. The legacy of Columbus in American horse populations assessed by microsatellite markers[J]. J Anim Breed Genet, 2017, 134(4): 340-350. DOI:10.1111/jbg.12255 |
| [27] |
FUNK S M, GUEDAOURA S, JURAS R, et al. Major inconsistencies of inferred population genetic structure estimated in a large set of domestic horse breeds using microsatellites[J]. Ecol Evol, 2020, 10(10): 4261-4279. DOI:10.1002/ece3.6195 |
| [28] |
MAHROUS K F, HASSANANE M, MORDY M A, et al. Genetic variations in horse using microsatellite markers[J]. J Gene Engine Bio, 2011, 9(2): 103-109. DOI:10.1016/j.jgeb.2011.11.001 |
| [29] |
BIGI D, ZAMBONELLI P, PERROTTA G, et al. The Ventasso horse: genetic characterization by microsatellites markers[J]. Ital J Anim Sci, 2007, 6(S1): 50-52. |
| [30] |
吕慎金, 杨燕, 候冠玉, 等. 运用微卫星标记对中国地方绵羊品种的遗传多样性分析[J]. 畜牧兽医学报, 2008, 39(7): 858-865. LÜ S J, YANG Y, HOU G Y, et al. Analysis of genetic diversity of Chinese indigenous sheep breeds by microsatellite markers[J]. Acta Veterinaria et Zootechnica Sinica, 2008, 39(7): 858-865. (in Chinese) |
| [31] |
赵艳红, 何晓红, 关伟军, 等. 中国6个山羊群体微卫星标记的遗传多样性分析[J]. 畜牧兽医学报, 2007, 38(1): 20-24. ZHAO Y H, HE X H, GUAN W J, et al. Analysis of genetic diversity of Chinese six goat breeds by microsatellite markers[J]. Acta Veterinaria et Zootechnica Sinica, 2007, 38(1): 20-24. (in Chinese) |
| [32] |
仲涛, 马月辉, 关伟军, 等. 10个绵羊品种的微卫星DNA多态性研究[J]. 畜牧兽医学报, 2008, 39(5): 555-561. ZHONG T, MA Y H, GUAN W J, et al. Genetic diversity of microsatellite DNA among ten sheep breeds[J]. Acta Veterinaria et Zootechnica Sinica, 2008, 39(5): 555-561. (in Chinese) |
| [33] |
王建民, 岳文斌, 秦孜娟, 等. 绵羊微卫星标记与生长性状的相关研究[J]. 畜牧兽医学报, 2007, 38(11): 1160-1167. WANG J M, YUE W B, QIN Z J, et al. Correlation analysis of growth traits in native sheep using microsatellite DNA markers[J]. Acta Veterinaria et Zootechnica Sinica, 2007, 38(11): 1160-1167. (in Chinese) |
| [34] |
WRIGHT S. Evolution and the genetics of population, volume 4:variability within and among natural populations[M]. Chicago: The University of Chicago Press, 1978.
|
| [35] |
MAHROUS K F, HASSANANE M, MORDY M A, et al. Genetic variations in horse using microsatellite markers[J]. J Gene Eng Biotechnol, 2011, 9(2): 103-109. DOI:10.1016/j.jgeb.2011.11.001 |
| [36] |
BERBER N, GAOUAR S, KDIDI G S, et al. Using the polymorphism of microsatellite markers to Algeria feeding five horse breeds in the molecular characterization and differentiation[J]. Anim Genet, 2014, 131: 387-394. |
| [37] |
BEHL R, BEHL J, GUPTA N, et al. Genetic relationships of five Indian horse breeds using microsatellite markers[J]. Animal, 2007, 1(4): 483-488. DOI:10.1017/S1751731107694178 |
| [38] |
DORJI J, TAMANG S, TSHEWANG T, et al. Genetic diversity and population structure of three traditional horse breeds of Bhutan based on 29 DNA microsatellite markers[J]. PLoS One, 2018, 13(6): e199376. |
| [39] |
MACKOWSKI M, MUCHA S, CHOLEWINSKI G, et al. Genetic diversity in Hucul and Polish primitive horse breeds[J]. Arch Anim Breed, 2015, 58(1): 23-31. DOI:10.5194/aab-58-23-2015 |
| [40] |
ZHANG L, ZHAO W H, WANG F P, et al. Genetic diversity and population structure of natural Lycorma delicatula (white) (Hemiptera: Fulgoridea) populations China as revealed by microsatellite and mitochondrial markers[J]. Insects, 2019, 10(10): 312. DOI:10.3390/insects10100312 |
(编辑 郭云雁)


