 2018, Vol. 2


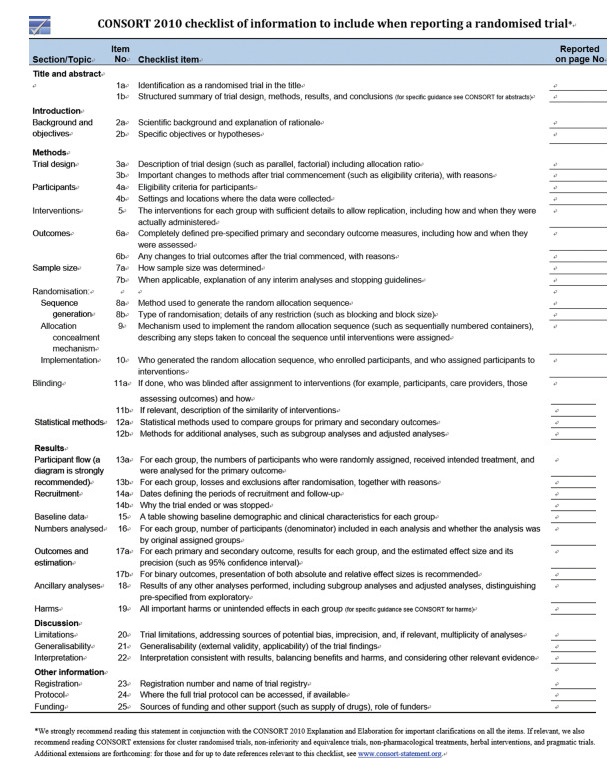
Randomized control trial (RCT) is one of the most well developed branches in evidence-based medicine.High standard journals adopt a standardized checklist (CONSORT statement, Consolidated Standards of Reporting Trials), to guarantee the quality of reporting randomized control trials (RCTs) (See http://www.consort-statement.org/). The CONSORT Statement comprises a 25-item checklist and a flow diagram.The checklist items focus on reporting how the trial was designed, analyzed, and interpreted.The flow diagram displays the progress of all participants through the trial.Flow diagram helps us to differentiate subjects counted between per-protocol analysis and intention to treat analysis.
Critical Appraisal of RCTWhen we appraise any clinical article.We first look at clinical directness, followed by validity, results and applicability.According to the Centre for Evidence Based Medicine (CEBM), "one of the fundamental skills required for practising EBM is the asking of well-built clinical questions.To benefit patients and clinicians, such questions need to be both directly relevant to patients' problems and phrased in ways that direct your search to relevant and precise answers."
A、Clinical directness:PICOs/PEOsSuppose we encountered a clinical question (e.g.do anti-platelet drugs, like clopidogrel, have additional benefits for AMI patients?) and performed literature search.An article"Addition of clopidogrel to aspirin in 45852 patients with acute myocardial infarction:randomized placebo-controlled trial"in Lancet was found.From this journal, we can formulate a research question with an answerable clinical question, according to the elements of clinical directness:PICOs model (see Table 1).
| Table 1 Elements of clinical directness (PICOs model) |
By convention, PICOs is now changed to PEOs, where E stands for exposure.In the above case, exposure is clopidogrel.
Patients: should be well defined by the authors.
Inclusion criteria:
Who: diagnostic criteria, demographic parameters
Where: multiple centres or single centre
When: time frame
Exclusion criteria is set to avoid inclusion of subjects that are problematic in data analysis.
Vulnerable subjects or ethnic constraints:pregnancy, prisoner
Critical case which is not fit for consent unless consent waived by Institution Review Board (i.e.ethics committee)
Poor yield:dementia
High risk of "loss to follow up":tourist
No consent available
Intervention:Intervention or treatment that is expected to have some beneficial outcomes in a clinical trial, e.g.additional clopidogrel in the above study.
Comparison:This acts as a control for comparison with the treatment group.This control may be represented by a placebo, standard treatment, or even no treatment.
Outcome:Clinical and functional status after an intervention has been administered: this is used to assess the effectiveness (treatment effect) of an intervention.
It can be divided into primary outcome or secondary outcome.The primary outcome (e.g.death) is greatest importance of the study; we also used it to calculate the sample size.The secondary outcome is an (anticipated or unanticipated) outcome for evaluating treatment effects other than the primary outcome (e.g.complications, or length of hospital stay).
Primary or secondary outcomes may include:composite outcomes or surrogate outcomes.Composite outcomes:several outcomes are combined or added as one single outcome, e.g.death, re-infarct or stroke can be counted as the endpoint.One subject may have 3 outcome events.It is easier to achieve statistically significant result for composite outcome.But, individual outcomes may not be statistically significant.
Surrogate outcomes:Outcome measures that are not of direct practical importance but are believed to reflect important outcomes; e.g., blood pressure is not directly important to patients but it is often used as an outcome in clinical trials because it is a risk factor for stroke and heart attack.Surrogate outcomes are often physiological or biochemical markers that can be relatively quickly and easily measured, and are considered as predictors of important clinical outcomes.Study design:type of studies.This refers to levels of evidence pyramid.

|
Randomized controlled trial (RCT):
An experiment in which two or more interventions, possibly including a control group or no intervention, are compared after random allocation (randomization) of participants into different treatment groups.
It has the highest epidemiological level of evidence because an effective randomization enables unbiased equal distribution of known & unknown confounders among the treatment & control groups.In RCT, blinding can also be performed; this reduces observer & responder bias. Thus, randomization & blinding improve the validity of the study.Besides, RCT has full control of independent factor i.e.the exposure.
When compared with prospective cohort study, cohort study lacks randomization.Cohort study has only limited manipulation of independent factor.It might control known confounders, but not unknown confounders.
However, RCT is time-consuming & expensive. It is volunteer-based, & has problems in non-compliance.It is less effective for study of minor variations, & needs longer follow-up for rare outcomes.Moreover, it is unethical to randomize subjects for trials concerning harm.Thus, harm is often studied by case control study (lower validity than RCT).
B、Validity (Look for bias)Validity is the degree to which a result (of a measurement or study) is likely to be true and free of bias (systematic errors).
Elements of validity in RCT:randomization process, follow-up adequacy, blinded and objective outcome measurements.This can be summarized in the mnemonic:RAMBO
RAMBO:
R is randomization method and allocation concealment, A is ascertainment=FU adequacy, MBO=Measurement should be blinded and objective
B1. Randomization method and Allocation concealmentPopulation refers to all subjects of interest in the research question.Sample refers to a small proportion of the population, selected to represent the whole population to participate in the study.This process of selection/recruitment in the study is called sampling.
Randomization is the process of randomly allocating participants into one of the arms of a controlled trial.There are two components of randomization process:1.Randomization method and 2.Allocation concealment.
Randomization method refers to generation of a random sequence and its implementation such that the investigators recruiting participants into a study are unaware of the allocation sequence. It can effectively distribute known & unknown confounders equally to both arms.Methods of randomization include simple randomization, (e.g.drawing numbers out of a hat, flipping a coin, using a random table, or using a computer generated sequence) or restricted randomization (e.g.blocking randomization or stratified randomization).
Allocation concealment:The process used to ensure that the investigator recruiting a subject does not know which group that individual will be allocated.This is aimed at reducing selection bias.Some attempts at concealing allocation are more prone to manipulation than others, and the method of allocation concealment is used as an assessment of the quality of a trial.
B2. Ascertainment (to look for Loss of Follow-up)This is to ascertain the observed difference in the outcome between treatment & control groups are explained by the difference in the treatment received in both groups.
Adequacy in FU
The subjects should be followed up sufficiently long and complete.If there is loss to follow up (LFU) or drop out, we need to assess the severity of LFU.In classical teaching, 5% drop out probably leads to little bias, > 20% poses serious threats to validity.We can perform sensitivity analysis to test the stability of the conclusion over a range of probabilities.Usually, the percentage of LFU is compared with the effect size; if the LFU % is greater than that of effect size (treatment minus control).
Intention-To-Treat Analysis (ITT):After randomization, a subject should be analyzed in the group in which he was randomized & allocated; even if he discontinues (defaults FU), never receives treatment (non-compliance), or crossovers (receives treatment in control arm). ITT analysis can maintain the randomization effect, thus has little bias & higher validity.Usually, the magnitude of the resulting RR will be smaller than that calculated from PP analysis.
Per protocol analysis (PP): The patient is analyzed into the treatment group in which he has received that treatment protocol.Non-compliant patients will not be included in analysis.Thus, the denominator in calculating the RR is smaller, & the resulting RR will be larger than ITT.
Sensitivity analysis:In the worst case scenario calculation, for the group that did better, assume all the lost to follow up have poor outcome; for the group that did worse, assume all the lost to follow up have better outcome.This analysis is then compared to the original analysis: ITT or PP.If the follow up is sufficiently complete and the result supports the original conclusion, we can draw a robust conclusion, otherwise the conclusion is soft.
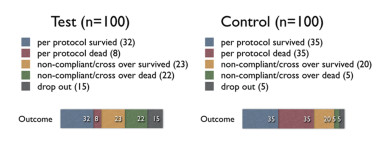
|
From the above table, we can see that the ARR is the largest in PP analysis, & smaller in ITT analysis, and the smallest in sensitivity analysis (even have a negative number, i.e., harmful effect).Thus, we can conclude that the drop-out rate of 15% in treatment group is significant; & the conclusion that this treatment has beneficial effect is soft.
Suppose the no.of drop-out in treatment group is 4 (not 15), & we add 6 more to those survive & 5 to those dead, then calculate again:
Then, there is still 1% difference between the EER & CER & it is in the direction of benefit.Thus, we can conclude that the 4% drop-out rate in treatment group is not significant; & the conclusion that this treatment has beneficial effect is robust.
Usually, authors will display the largest value of difference in their study.They may not calculate the sensitivity analysis, as this may lead to a soft conclusion.
B3. Measurement of outcomes should be blinded and objectiveOutcome measurement should be objective.That is, two different data collectors can provide the same measurement on a specific variable.Measurement can be classified into:1.Bio-physiological measures (e.g.blood pressure, temperature); 2.Self-reporting (e.g.pain score, VAS, diaries, questionnaires):the disadvantage is that it may not precisely measure the interested variable.Often, it depends on previous validation.3.Observation (e.g.audio-visual means):it records down without extraction.It can re-examine the situation.Often, Hawthorne effect is present in observational studies.
Measurement of the effect:
Treatment arm=Treatment effect+random error+systematic error
Placebo arm=Placebo effect+random error+systematic error
Random error:Error due to the play of chance.Confidence intervals and p-values allow for the existence of random error.
Systemic errors:Bias due to poor study design. It can only be corrected by better study design.CI and p-values cannot correct the bias.
Placebo:An inactive substance or procedure administered to a participant, usually to compare its effects with those of a real intervention.Placebos are used in clinical trials to blind people (doctors & patients) to treatment allocation.
B4. BlindingBlinding focuses on the treatment procedure for the already recruited subjects.It is not dependent on randomization.Blinding is different from allocation concealment.Blinding process aids to reduce observer bias & response bias.This is the process of preventing those involved in a trial from knowing to which comparison group a particular participant belongs.Bias is minimized when as few people as possible know who is in the treatment arm and who is in the control arm.Participants, caregivers, outcome assessors are candidates that can be blinded.Blinding of certain groups is not always possible, e.g., surgeons in surgical trials.The specific people who are blinded should be explicitly listed, to avoid confusion.When one of caregivers, participants, or outcome assessors is blinded, it is called single-blinded study.When more than one group is blinded, it is called double-blinded study.
ResultsEvidence-based medicine deals with quantitative trials.And outcome measures are presented as data.Data can be broadly categorized into dichotomous data and continuous data.It is only the principal author who gets the raw data.The author can present the same set of raw data by swapping between dichotomous outcome and continuous outcome.For example, if we want to compare the temperature drop, we can swap between"Temperature change in absolute amount" (which is a continuous data) and "Greater than or less than 38 degree Celsius" (which is a dichotomous one).
Data can also be classified as absolute results and relative results.For example, "Absolute risk reduction"and"Number needed to treat"are absolute."Relative risk reduction", "Relative Risk", "Odd Ratio"are relative.
Magnitude of effect:Point estimate
Dichotomous outcome, we can draw a 2×2 table to tabulate the results.
RRR always looks much better than ARR because it only shows the relative value. Even a very small EER & CER can give a significant RRR.
RRR and ARR only show the clinical significance but not the statistical significance.
We need to know the 95% CI or P-value to show any statistical significance.We use Chi square test for dichotomous data.
Continuous Data
The commonly used test is student t test (unpaired or paired) or one-way ANOVA.
Precision of the estimate of effect: Interval estimate
95% Confidence intervals
If the same study is repeated in samples obtained from the same population for many times, 95% of the confidence intervals from those studies would contain the true value of the unknown quantity. Wider intervals indicates lower precision (smaller sample size); narrow intervals indicates higher precision (larger sample size).
95%CI=point estimate +/- 1.96 SEM
P value
This is the probability that the results observed in a study could have occurred by chance if in reality the null hypothesis was true.Thus if the calculated P < 0.05, i.e., the probability that the difference observed between the 2 groups in the study is due to chance is less than 5%, then this difference is said to be statistically significant.
P value only gives us a cut-off point to say that it is statistically significant, whereas the 95% CI also provides a hint on the precision of the point estimate, & thus, about the adequacy of the sample size.Therefore, 95% CI is more widely used nowadays.
Applicability A、5 Killer BsCan we apply the result of the article to our clinical situation or our patients?There are 5 biological or socioeconomic barriers (5 Killer Bs):
Biology:any difference in ethnics or disease severity.
Barrier:the availability in our local department or locality
Bargain:the benefit, compared to the risk, cost & any competitors
Belief:the degree of acceptance in local community, or in local professions
Burden:the prevalence of the disease in the locality, amount of patient load
B、Local NNTWe need to appraise how much benefit we can get, when we apply the results of the article to our local patients. And we assume the same treatment effect with the same Relative Risk.Local NNT=article NNT x (article prevalence / local prevalence)E.g., the prevalence of the disease in the article is 0.1 % (100/100000) & the NNT of the article is 30, when our local prevalence is just one half:0.05% (50/100000), then our local NNT will be 60, if we apply the same Relative risk/treatment effect of the article on our local subjects.This shows that, for an uncommon disease in a different locality, the local NNT is larger, or we need to treat more patients in order to prevent one bad outcome.
Appendix
Sample size calculation for RCT
Sample size is the minimum number of subjects recruited in order to obtain a sufficient statistical power (statistical significance).It is based on primary outcome.It should be calculated during the design phase (a priori sample size calculation) but it can be used to crosscheck when appraising an article.
Factors determine the sample size:
1.Type of study (e.g.RCT, cohort, case-control)
2. Level of significance (Type I error, α):The probability that a relationship found in the data is just due to an unlucky sample and wrongly rejected H0, It also called Type I error (α) or false positive.It is more serious in therapy study (e.g.expect minimal mortality), and therefore more important to avoid.
3.Power of study (Type II error, β; power=1-β):Type II error (β) or false negative error is the failure to reject a false null hypothesis & wrongly accepts H0. The power of statistical test (1-β) refers to the probability of a test appropriately rejecting the H0 and proving the difference between treatment and control groups.For any given set of data, α & β are inversely related: the smaller the risk of one, the bigger the risk of the other.It is widely accepted to set α=0.05;β=0.2 (power=0.8).
4.One or two-tailed study:If we assume the treatment group is always better/worse than the control group, we can use 1-tailed test.If we don't know which group is better/worse, we can use 2-tailed test.Sample size is larger in 2-tailed test than 1-tailed test.
5.Effect size:This is the minimal "clinically" important difference.The larger the effect size, the more likely that you will reject H0.If the effect size increases, sample size, n, will be decreased.
6.Standard error of the mean effect:A larger sample size with small variability (standard deviation) will produce a smaller standard error.
Null hypothesis H0:
The statistical hypothesis that there is no association between the variables of two groups, i.e.the 2 populations do not differ from one another. H0:Δ =0; (Δ:the difference between test and control arm)
Alternate hypothesis HA
HA:Δ≠0.We reject H0 if 95% CI does not cross the value of no difference, or P < 0.05.We accept HA when the H0 is rejected, it means that there is association between one variable to the other (i.e.treatment arm is different from control arm).
|