 2016, Vol.29


 , LU Yan Ping2,#
2. Department of Gynaecology and Obstetrics, Chinese PLA General Hospital, Beijing 100853, China;
3. Sihai Huachen Technology Co., Ltd., Beijing 102629, China;
4. Department of Nutrition, Beijing Hospital, Beijing 100730, China;
5. Department of Nutrition, Beijing Tongren Hospital, Beijing 100005, China;
6. Haidian District Health Center for Women and Children, Beijing 100080, China;
7. Department of Nutrition, Jishuitan Hospital, Beijing 100035, China;
8. Department of Nutrition, Sixth People's Hospital, Shanghai 200233, China;
9. Department of Nutrition, Chinese Air Force General Hospital, Beijing 100036, China;
10. Department of Nutrition, People's Hospital of Sichuan Province, Chengdu 610072, Sichuan, China;
11. Department of Nutrition, Bethune International Peace Hospital, Shijiazhuang 130100, Hebei, China;
12. Department of Nutrition, No. 304 Chinese PLA Hospital, Beijing 100037, China
Objective To investigate the association of maternal body composition and dietary intake with the risk of gestational diabetes mellitus (GDM).
Methods A total 154 GDM subjects and 981 controls were enrolled in a prospective cohort study in 11 hospitals from May 20, 2012 to December 31, 2013. Bioelectrical impedance analysis and dietary surveys were used to determine body composition and to evaluate the intake of nutrients in subjects at 21-24 weeks' gestation (WG). Logistic regression analysis was applied to explore the relationships of maternal body composition and dietary intake with the risk of GDM morbidity.
Results Age, pre-pregnant body weight (BW), and body mass index (BMI) were associated with increased risk of GDM. Fat mass (FM), fat mass percentage (FMP), extracellular water (ECW), BMI, BW, energy, protein, fat, and carbohydrates at 21-24 WG were associated with an increased risk of GDM. In contrast, fat free mass (FFM), muscular mass (MM), and intracellular water (ICW) were associated with a decreased risk of GDM.
Conclusion Maternal body composition and dietary intake during the second trimester of pregnancy were associated with the risk of GDM morbidity.
The prevalence of gestational diabetes mellitus (GDM) is increasing rapidly worldwide,with reported morbidity of GDM in Southwest China as high as 24.5% according to the International Association of Diabetes and Pregnancy Study Groups (IADPSG) criteria[1]. GDM is one of the most common complications of pregnancy,and threatens both mothers and their offspring because of hyperglycemia. Perinatal complications associated with GDM include hypertensive disorders,preterm delivery,shoulder dystocia,stillbirths,clinical neonatal hypoglycemia,hyperbilirubinemia,and cesarean deliveries[2, 3]. Postpartum complications include obesity and impaired glucose tolerance in the offspring and diabetes and cardiovascular disease in the mothers[4, 5]. Management of GDM during pregnancy includes monitoring of blood glucose and medical nutrition therapy with caloric restriction,physical activity,and insulin therapy[6]. The management and control of blood glucose during pregnancy can significantly improve or avoid adverse outcomes in both mothers and offspring[7].
Age,parity,genetic factors,previous GDM,hepatitis B virus infection,smoking,and an improperdiet are factors known to increase the risk of GDM in pregnant women[8, 9]. Many studies also show that overweight and excessive gestational weight gain are the risk factors[10, 11]. Research has increasingly found that body composition,especially body fat,is closely related to glucose metabolism in humans[12, 13]. However,few reports on the relationship between body composition and GDM morbidity during pregnancy are found. Furthermore,the results of studies on the relationship between GDM morbidity and dietary intake in pregnancy are not consistent. This study aimed to explore the relationship between second trimester maternal body composition or dietary intake and the risk of GDM in a cohort of Chinese pregnant women.
MATERIALS AND METHODS SubjectsThis study was performed in a cohort of 1261 Chinese women enrolled at 11 hospitals from May 20,2012 to December 31,2013. The study was approved by the Human Subjects Committees of the PLA General Hospital,and each subject was asked to provide written informed consent before participation.
The inclusion criteria were pregnant Chinese women with a singleton pregnancy and regular pregn- ancy check-ups. The exclusion criteria were a history of GDM or any type of pregestational diabetes mellitus (DM),or any other concomitant disease such as chronic hypertension,thyroid disease,etc.,for which medical treatment might affect glucose metabolism. Subjects who were not singleton pregnancies (n=69),had incomplete dietary survey (n=26),or body composition (n=23) records at 21-24 weeks’ gestation (WG),or who were lost to follow-up (n=8) were excluded. A total 1135 pregnant women were enrolled for the final analysis; of these,981 had normal glucose tolerance (NGT),and 154 developed GDM [classified by the International Association of the Diabetes and Pregn- ancy Study Groups (IADPSG) criteria] at 24-28 WG.
Experimental DesignA questionnaire was used to collect basic information about the subjects when they were enrolled in the study. After the subjects were incorporated into the cohort,body weight (BW) and height were measured to the nearest 0.1 kg and 0.1 cm,respectively. Body mass index (BMI) was calculated by dividing weight by the square of height (kg/m2),and fidelity was 0.01 kg/m2. BMI<18.5 kg/m2 was classified as lean,18.5-24 kg/m2 as normal,24-28 kg/m2 as overweight,and >28 kg/m2 as obese,according to the BMI classification for Chinese[14]. Measurements of body composition were accomplished using bioelectrical impedance analysis (BIA) apparatus with 8-point tactile electrodes (NQA-PI; Sihaihuachen,Beijing,China). This BIA analyzer uses an alternating current of 200 μA at variable frequencies of 5,50,100,250,500,and 1000 kHz. Evaluations were performed during the second trimester (between 21 and 24 WG) before screening for GDM. A dietary survey (24 h dietary recall on 3 consecutive days) was used to evaluate the intake of energy,protein,fat,carbohydrate,and dietary fiber at 21-24 WG. The nutrients in all the foods were quantified according to the Chinese Food Composition Table. Screening for GDM was performed on all subjects at 24-28 WG using a one-step 75 g oral glucose tolerance test,and GDM was diagnosed if one or more plasma glucose values met or exceeded the level of the IADPSG criteria[15] (fasting: 5.1 mmol/L,1 h: 10.0 mmol/L,and 2 h: 8.5 mmol/L).
Statistical AnalysisStatistical analysis was performed with SPSS 17.0 for windows (SPSS,Chicago,IL,USA). Student’s t-test was used for pregnant age,height,pre-pregnant BW,and pre-pregnant BMI of the GDM and NGT groups,and Pearson’s χ2 test was used for sociodemographic characteristics (including level of education,family income,smoking habits,alcohol consumption,and gravidity). Logistic regression analysis was used for maternal pre-pregnant characteristics,body composition,and dietary intake with a risk of GDM. A P value <0.05 was considered statistically significant.
RESULTS Subject CharacteristicsThe subject characteristics are shown in Table 1. There were no significant differences in education,family income,smoking,drinking,and gravidity between the GDM and NGT groups. The pregnant age,pre- pregnant BW,and pre-pregnant BMI were signifi- cantly higher in the GDM than in the NGT group.
|
|
Table 1. Characteristics of the Subjects Enrolled in the Cohort |
In continuous variable logistic regression analysis for pre-pregnant characteristics,the risk of GDM increased significantly with increasing pregnant age,pre-pregnant BW,and pre-pregnant BMI; the odds ratios (95% confidence interval) were 1.11 (1.05,1.17),1.05 (1.03,1.07),and 1.16 (1.10,1.22),respectively.
Risk Factors for GDM by Maternal Body CompositionIn categorical variable logistic regression analysis for maternal body composition at 21-24 WG,after adjustment for pregnant age,pre-pregnant BW,and pre-pregnant BMI,the risk for GDM increased in women who had a higher quartile of BW,fat mass percentage (FMP),and extracellular water (ECW); the ECW/ICW ratio increased significantly compared with the lowest quartile. In contrast,the risk for GDM in women who had a higher fat free mass (FFM),muscular mass (MM),and intracellular water (ICW) decreased significantly compared with the first quartile (Table 2).
|
|
Table 2. Risk Factors by Maternal Body Composition at 21-24 WG by Logistic Regression Analysis |
On categorical variable logistic regression analysis for dietary intake at 21-24 WG,after adjustment for pregnant age,pre-pregnant BW,and pre-pregnant BMI,the risk of GDM in women who had higher quartiles of energy,protein,and fat intake increased significantly compared with the lowest quartile (Table 3).
|
|
Table 3. Risk Factors by Dietary Intake at 21-24 WG by Logistic Regression Analysis |
Since pre-pregnant BMI level is closely associated with the morbidity of GDM,we performed a further stratified analysis of the associations between the morbidity of GDM and maternal body composition or dietary intake at 21-24 WG for the same pre-pregnant BMI levels. We used logistic regression analysis for the categorical variables in these four different subgroups. Although we had no subjects to calculate adjusted odds ratios in the subgroup with pre-pregnant BMI >28 kg/m2 (data not shown),we merged this with the subgroup with pre-pregnant BMI 24-28 for analysis. Thus,the subgroups were divided into <18.5,18.5-24,and >24,with GDM morbidities of 8.02%,12.53%,and 26.85%,respectively. Table 4 shows the relationship between maternal body composition,dietary intake,and GDM morbidity for different pre-pregnant BMI levels (statistically significant data are not shown in Table 4).
|
|
Table 4. Risk Factors by Maternal Body Composition and Dietary Intake at 21-24 WG for Different Pre-pregnant BMIs by Logistic Regression Analysis |
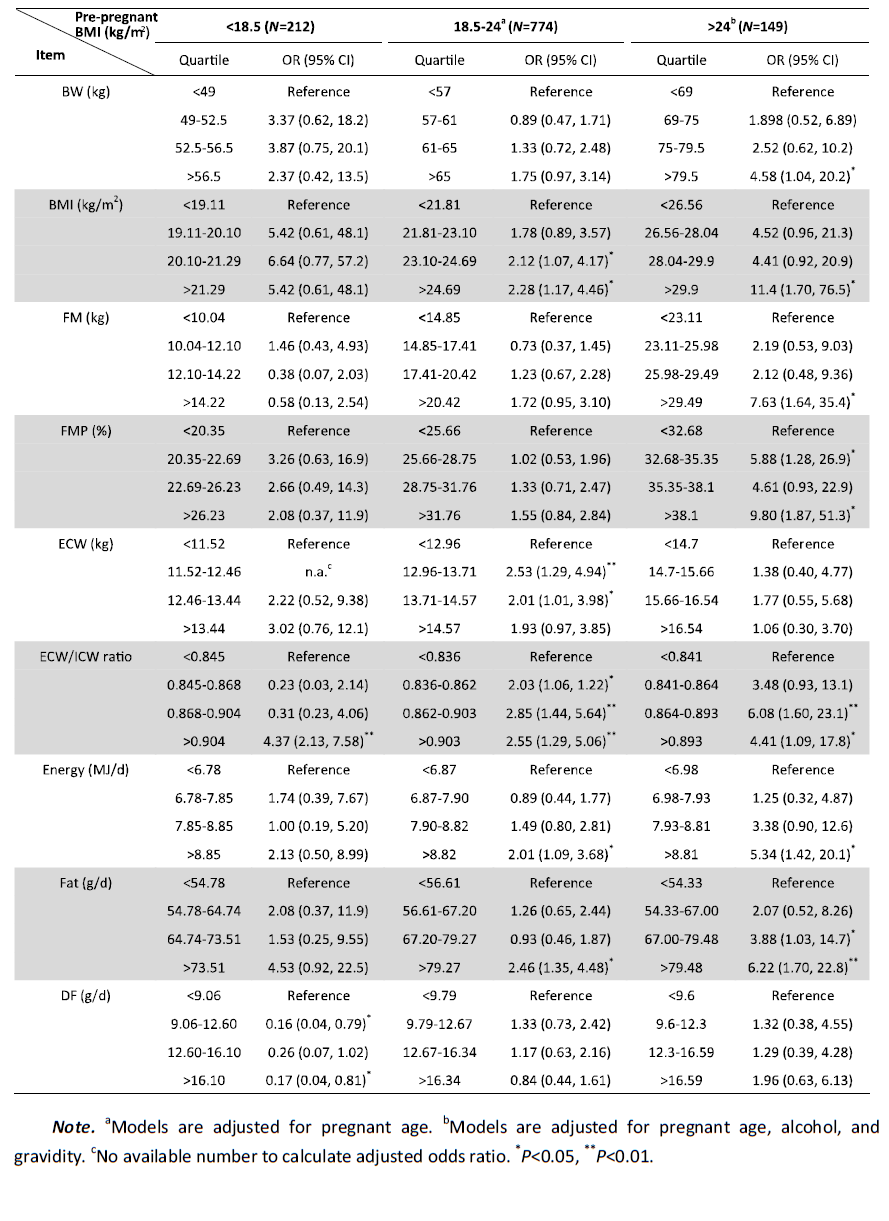
In the subgroup with pre-pregnant BMI <18.5 kg/m2,the risk of GDM in the fourth quartile of the ECW/ICW ratio increased significantly compared with the first quartile. However,the risk of GDM in the second and fourth quartiles of dietary fiber (DF) intake decreased significantly compared to the first quartile. In the subgroup with pre-pregnant BMI 18.5-24 kg/m2,the risk of GDM in the fourth quartile of BMI,ECW,ECW/ICW ratio,energy,and fat intake increased significantly compared with the first quartile. In the subgroup with pre-pregnant BMI >24 kg/m2,the risk of GDM in higher quartiles of BW,BMI,FM,FMP,ECW/ICW ratio,energy,and fat intake at 21-24 WG increased significantly compared with the lowest quartile.
Risk Factors for GDM by Different Pregnant AgesThe pregnant age is closely associated with the morbidity of GDM. Further stratified analyses of the associations between the morbidity of GDM and maternal body composition or dietary intake at 21-24 WG for the same age levels were conducted. Logistic regression analysis was used for the categorical variables in these four different subgroups. Although numbers were not available to calculate the adjusted odds ratio in the subgroup with pregnant age >36 years (data not shown),we merged this with the subgroup with pregnant age 31-35 years for analysis. Thus,the subgroups were divided into 18-25,26-30,and >30 years,with GDM morbidities of 7.14%,11.32%,and 17.81%,respectively. Table 5 shows the relationship between maternal body composition,dietary intake,and GDM morbidity for different pregnant age levels (statistically significant data are not shown in Table 5).
|
|
Table 5. Risk Factors by Maternal Body Composition and Dietary Intake at 21-24 WG for Different Pregnant Ages by Logistic Regression Analysis |
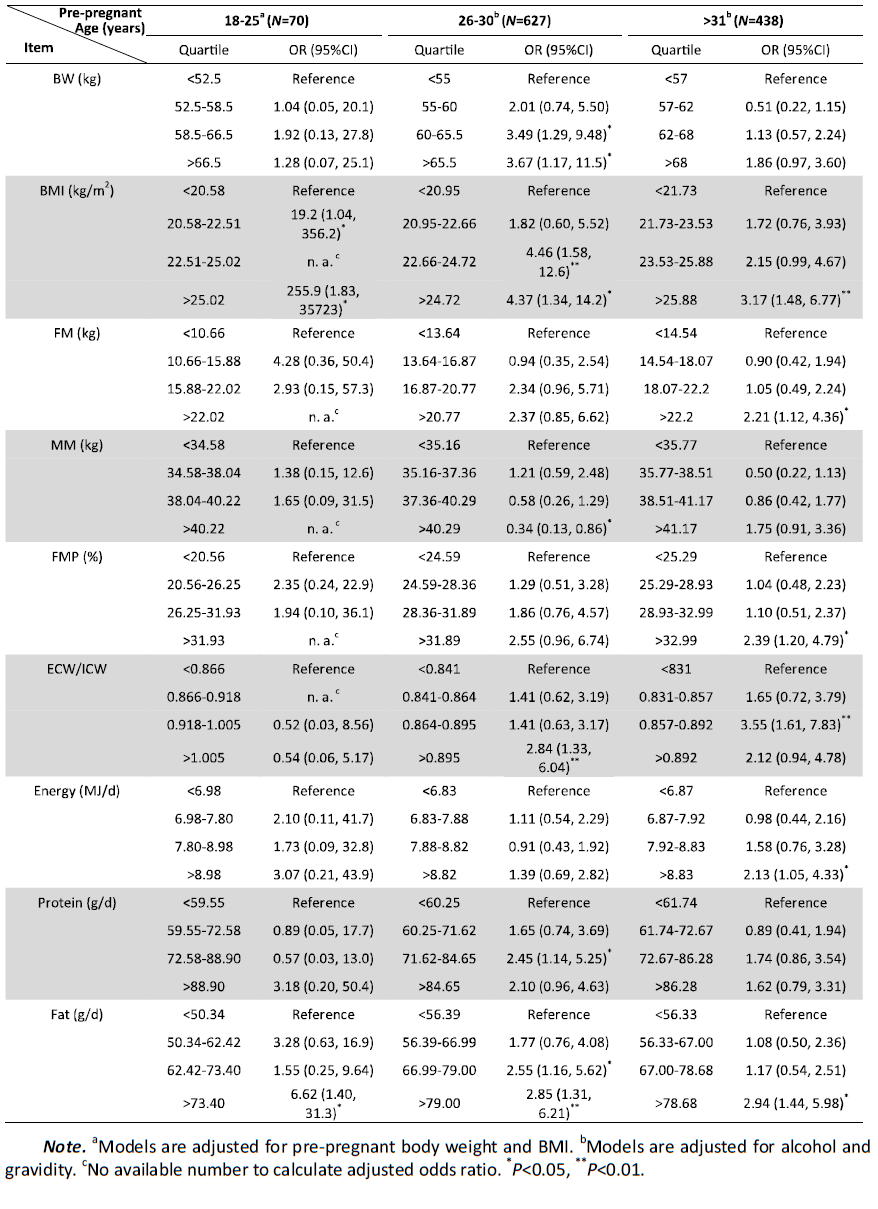
In the subgroup with pregnant age 18-25 years,the risk of GDM in the higher quartiles of BMI and fat intake at 21-24 WG increased significantly compared with the lowest quartile. In the subgroup with age 26-30 years,the risk of GDM in the higher quartiles of BW,BMI,ECW/ICW ratio,and fat and protein intake at 21-24 WG increased significantly compared with the lowest quartile; the risk of GDM in the fourth quartile of MM at 21-24 WG decreased significantly compared with the first quartile. In the subgroup with age >31 years,the risk of GDM in the higher quartiles of BMI,FM,FMP,ECW/ICW ratio,energy,and fat intake at 21-24 WG increased significantly compared with the first quartile.
DISCUSSION Body Composition Factors and GDMThe relationship between the risk for GDM and gestational weight gain,particularly before the second trimester,has been reported[16]. However,a meta-analysis showed that increased gestational weight gain was associated with a nonsignificant increase in the incidence of GDM[17]. Recently,some researchers suggested that BMI unit change is a better measure of proportionate weight gain for intervention in women at risk for GDM[18]. However,BMI does not measure adiposity directly or provide information about the distribution of body fat[19]. Differences in body composition (such as FM and MM) gains with similar body weight or BMI gain may explain some of these discrepancies. Therefore,the BW and BMI did not reflect body composition,particularly body fat,which is considered to be closely related to insulin resistance[12] and beta-cell function[13] in pregnant women. BIA is benign and noninvasive and is useful for evaluating body composition (including FM,FFM,FMP,MM,TBW,ECW,and ICW) during pregnancy[20]. It is reported that FM does not change significantly in the first trimester[21],and that the increase in BW and FM in the second-trimester is positively associated with GDM[22]. Thus,FM in the second trimester maybe an important risk factor for GDM. In this prospective cohort study involving 11 clinical centers,we found that the risk for GDM in women with higher FM and FMP in the second trimester was notably increased,along with the higher BW and BMI in this trimester.
Furthermore,considering that pre-pregnant- BMI[16, 23, 24, 25] and advanced age[26, 27] are consistent risk factors for GDM as reported in many previous studies,we performed a stratified analysis of the associations between GDM morbidity and maternal body composition at 21-24 WG for the same pre-pregnant BMI or age levels. We found that the positive correlation between the development of GDM and increasing FM and FMP became stronger in over weight and obese women; the OR increased 6.6- and 8.8-fold in the highest quartile of FM and FMP compared with the lowest quartile,respectively. Subcutaneous fat can reportedly increase leptin[28] and tumor necrosis factoralpha[29] secretion and decrease insulin sensitivity,and visceral fat[12] can increase insulin resistance. Thus,large gains in maternal FM in early pregnancy could have a stronger influence on subsequent insulin resistance[10]. GDM develops when the pancreatic beta cell exhausts its capacity to secrete adequate insulin for the level of resistance induced by pregnancy[30]. Because overweight and obese women have increased insulin resistance before conception,we believe that an increase in FM and FMP before the second trimester may trigger GDM development in these women.
FFM is an essential determinant of resting energy expenditure (REE) in pregnancy[31]. Variation in energy expenditure is largely due to differences in FFM,which in pregnancy is comprised of expanded plasma,fetal,and uterine tissues requiring high energy,and skeletal muscle mass requiring moderate energy. FFM is the strongest predictor of total energy expenditure,basal metabolic rate,sleeping metabolic rate (SMR),and minimal SMR in pregnancy[32]. Higher FFM demands more glucose[33] and is strongly correlated with endogenous glucose output[34],which may help with glucose control. These results may partly explain the finding that FFM was negatively associated with GDM in our study.
In the human body,water is localized in 2 compartments: ECW and ICW. The ECW is comprised of interstitial fluid and plasma volume,which rapidly increases up to 10% above baseline by 7 WG,and stabilizes at 32 WG at about 45%-50% above baseline. The ICW during pregnancy is likely to reflect changes in the maternal body,such as increases in mammary and uterine tissues,which slightly increase during the course of gestation and peak in the late third trimester due to swelling in the breast and inferior pelvis,in preparation for labor,delivery,and the puerperium[35]. Obese individuals are known to have a higher ECW/ICW ratio than normal weight individuals because fluid in adipose tissue is distributed mainly in extracellular sites[36]. This may help explain the findings in our study that a higher ECW/ICW ratio increased the risk of GDM,particularly with higher pre-pregnant BMI level and in older pregnant age subgroups. We inferred that the risk was most likely associated with higher FM and FMP in these subjects.
Dietary Factors and GDMHigher dietary intake of energy,fat,protein,and carbohydrate during the second trimester increased the risk of GDM later in pregnancy,after adjustment for potential pre-pregnant confounders. On stratified analysis,intake of fat was strongly positively associated with GDM risk in older and overweight or obese women. In limited studies on GDM risk and dietary fat intake,the majority of results have focused on fat intake pre-pregnancy or in early pregnancy,but the results have been inconsistent[37, 38, 39, 40, 41, 42]. Our findings were consistent with 3 studies: one study reported that higher fat intake during pregnancy would increase GDM recurrence[37],and the other two studies revealed that a prominent factor that led to GDM was higher energy consumption accompanied by higher carbohydrate consumption[38, 39]. However,another study showed that lower total fat intake in pregnancy was related to higher risk of GDM and impaired glucose tolerance in Chinese women[40]. Other studies indicated that substitution of total fat for carbohydrates in the diet was associated with an increased risk of GDM and impaired glucose tolerance[39]. Some studies reported no association between total fat intake and GDM risk[41, 42]. The inconsistent findings in these studies might possibly be due to differences in ethnicity,study sample size,and dietary assessment methods.
We did not find any evidence of inverse association of GDM risk with total DF intake during the second trimester in the present cohort. However,on stratified analyses,total DF intake was strongly associated with decreased risk of GDM in women with a pre-pregnant BMI <18.5 kg/m2. In the Nurses’ Health Study Ⅱ,lower total DF intake,and particularly cereal and fruit fiber intake,increased the risk of GDM[43]. A recent study focusing on dietary intake during the second trimester revealed that lower intake of vegetable and fruit fiber increased fasting glucose; higher vegetable and fruit fiber intake reduced insulin resistance and increased insulin sensitivity,and was inversely correlated with the development of GDM[44]. These inconsistent results may be explained by the effect of DF on improved glucose metabolism attributed to insoluble fiber[43]. Several possible mechanisms may explain the hypoglycemic effect of dietary fiber,such as appetite reduction,decreased total energy intake,slowed glucose digestion,reduced glucose absorption in the gastrointestinal tract,reduced adiposity,and improved insulin sensitivity[45, 46, 47].
Strengths and LimitationsOur study had several strengths. First,to our knowledge,this study was a advanced report about direct association between body composition and risk of GDM in a relatively large sample size of pregnant Chinese women. Second,the prospective multicenter design helped reduce both recall and interviewer bias during data collection,and the results may infer a cause-and-effect relationship between body composition,nutrient intake,and GDM. Third,we assessed intake using 24 h dietary recall on 3 consecutive days,which is considered the gold standard for determining usual intake[38].
This study also had some limitations. First,nutrient intake determined by dietary recall was self-reported,and may not be accurate,especially in overweight and obese women,thus interfering with the estimation of ORs. Second,our total study population was sufficiently large to detect ORs of approximately 0.85 with 80% power,but our sample size may have been limited by certain subgroup analyses. Third,limited by the rules for antenatal care in China,all questionnaire completion and examinations took place later than 12 WG,and data for pre-pregnancy and pregnancy before 12 WG could not be obtained. We only investigated body composition and dietary intake at 21-24 WG,which is close to the time point for screening and diagnosis of GDM at 24-28 WG. Further research with more frequent evaluation is needed to verify our findings.
CONCLUSIONSOur study showed that increased dietary intake of energy,protein,fat,and carbohydrate,as well as BW,BMI,FM,FMP,and ECW during the second trimester were associated with risk for GDM; in contrast,FFM,MM,and ICW were thought to be protective factors for GDM. In particular,BW,FM,and FMP may be good markers for evaluation of the risk for GDM in women older than 31 years or those overweight and obese.
CONFLICT OF INTERESTThe authors declare no conflict of interest.
ACKNOWLEDGMENTSWe are grateful to all subjects who participated in this study,and to Dr. BotaoGuo for his help in data analysis.We also sincerely thankall the participants who worked on this study in the 11 clinical centers: Chinese PLA General Hospital,Beijing Hospital,Tongren Hospital,Haidian District Health Center for Women and Children,Jishuitan Hospital,Sixth People’s Hospital of Shanghai,Chinese Air Force General Hospital,People’s Hospital of Sichuan Province,Bethune International Peace Hospital,and 304 Chinese PLA Hospital.
| 1. | Liao S, Mei J, Song W, et al. The impact of the International Association of Diabetes and Pregnancy Study Groups (IADPSG) fasting glucose diagnostic criterion on the prevalence and outcomes of gestational diabetes mellitus in Han Chinese women. Diabet Med, 2014; 31, 341-51. |
| 2. | Jensen DM, Damm P, Sorensen B, et al. Clinical impact of mild carbohydrate intolerance in pregnancy:a study of 2904 nondiabetic Danish women with risk factors for gestational diabetes mellitus. Am J Obstet Gynecol, 2001; 185, 413-9. |
| 3. | Group HSCR, Metzger BE, Lowe LP, et al. Hyperglycemia and adverse pregnancy outcomes. N Engl J Med, 2008; 358, 1991-2002. |
| 4. | Sullivan SD, Umans JG, Ratner R. Gestational diabetes:implications for cardiovascular health. Curr Diab Rep, 2012; 12, 43-52. |
| 5. | Boriboonhirunsarn D, Talungjit P, Sunsaneevithayakul P, et al. Adverse pregnancy outcomes in gestational diabetes mellitus. J Med Assoc Thai, 2006; 89 Suppl 4, S23-8. |
| 6. | Buchanan TA, Xiang AH, Page KA. Gestational diabetes mellitus:risks and management during and after pregnancy. Nat Rev Endocrinol, 2012; 8, 639-49. |
| 7. | Au CP, Raynes-Greenow CH, Turner RM, et al. Body composition is normal in term infants born to mothers with well-controlled gestational diabetes mellitus. Diabetes Care, 2013; 36, 562-4. |
| 8. | Solomon CG, Willett WC, Carey VJ, et al. A prospective study of pregravid determinants of gestational diabetes mellitus. JAMA, 1997; 278, 1078-83. |
| 9. | Zhang C, Schulze MB, Solomon CG, et al. A prospective study of dietary patterns, meat intake and the risk of gestational diabetes mellitus. Diabetologia, 2006; 49, 2604-13. |
| 10. | Hedderson MM, Gunderson EP, Ferrara A. Gestational weight gain and risk of gestational diabetes mellitus. Obstet Gynecol, 2010; 115, 597-604. |
| 11. | Liu Z, Ao D, Yang H, et al. Gestational weight gain and risk of gestational diabetes mellitus among Chinese women. Chin Med J (Engl), 2014; 127, 1255-60. |
| 12. | Gur EB, Ince O, Turan GA, et al. Ultrasonographic visceral fat thickness in the first trimester can predict metabolic syndrome and gestational diabetes mellitus. Endocrine, 2014; 47, 478-84. |
| 13. | Kahn SE, Prigeon RL, Schwartz RS, et al. Obesity, body fat distribution, insulin sensitivity and Islet beta-cell function as explanations for metabolic diversity. J Nutr, 2001; 131, 354S-60S. |
| 14. | Zhou BF, Cooperative Meta-Analysis Group of the Working Group on Obesity in C. Predictive values of body mass index and waist circumference for risk factors of certain related diseases in Chinese adults——study on optimal cut-off points of body mass index and waist circumference in Chinese adults. Biomed Environ Sci, 2002; 15, 83-96. |
| 15. | Agarwal MM, Dhatt GS, Othman Y. Gestational diabetes:differences between the current international diagnostic criteria and implications of switching to IADPSG. J Diabetes Complications, 2015; 29, 544-9. |
| 16. | Gibson KS, Waters TP, Catalano PM. Maternal weight gain in women who develop gestational diabetes mellitus. Obstet Gynecol, 2012; 119, 560-5. |
| 17. | Ruifrok AE, van Poppel MN, van Wely M, et al. Association between weight gain during pregnancy and pregnancy outcomes after dietary and lifestyle interventions:a meta-analysis. Am J Perinatol, 2014; 31, 353-64. |
| 18. | Padmanabhan S, Wagstaff A, Tung V, et al. Increase in body mass index during pregnancy and risk of gestational diabetes. Diabetes Res Clin Pract, 2014; 106, e79-82. |
| 19. | Fattah C, Farah N, O'Toole F, et al. Body Mass Index (BMI) in women booking for antenatal care:comparison between selfreported and digital measurements. Eur J Obstet Gynecol Reprod Biol, 2009; 144, 32-4. |
| 20. | Larciprete G, Valensise H, Vasapollo B, et al. Body composition during normal pregnancy:reference ranges. Acta Diabetol, 2003; 40 Suppl 1, S225-32. |
| 21. | Fattah C, Farah N, Barry SC, et al. Maternal weight and body composition in the first trimester of pregnancy. Acta Obstet Gynecol Scand, 2010; 89, 952-5. |
| 22. | Sommer C, Morkrid K, Jenum AK, et al. Weight gain, total fat gain and regional fat gain during pregnancy and the association with gestational diabetes:a population-based cohort study. Int J Obes (Lond), 2014; 38, 76-81. |
| 23. | Tran TS, Hirst JE, Do MA, et al. Early prediction of gestational diabetes mellitus in Vietnam:clinical impact of currently recommended diagnostic criteria. Diabetes Care, 2013; 36, 618-24. |
| 24. | Gabbay-Benziv R, Doyle LE, Blitzer M, et al. First trimester prediction of maternal glycemic status. J Perinat Med, 2014; 43, 283-9. |
| 25. | Li N, Liu E, Guo J, et al. Maternal prepregnancy body mass index and gestational weight gain on pregnancy outcomes. PLoS One, 2013; 8, e82310. |
| 26. | Shirazian N, Emdadi R, Mahboubi M, et al. Screening for gestational diabetes:usefulness of clinical risk factors. Arch Gynecol Obstet, 2009; 280, 933-7. |
| 27. | Naylor CD, Sermer M, Chen E, et al. Selective screening for gestational diabetes mellitus. Toronto Trihospital Gestational Diabetes Project Investigators. N Engl J Med, 1997; 337, 1591-6. |
| 28. | Yilmaz O, Kucuk M, Ilgin A, et al. Assessment of insulin sensitivity/resistance and their relations with leptin concentrations and anthropometric measures in a pregnant population with and without gestational diabetes mellitus. J Diabetes Complications, 2010; 24, 109-14. |
| 29. | Kirwan JP, Hauguel-De Mouzon S, Lepercq J, et al. TNF-alpha is a predictor of insulin resistance in human pregnancy. Diabetes, 2002; 51, 2207-13. |
| 30. | Hedderson MM, Williams MA, Holt VL, et al. Body mass index and weight gain prior to pregnancy and risk of gestational diabetes mellitus. Am J Obstet Gynecol, 2008; 198, 409 e1-7. |
| 31. | Hronek M, Klemera P, Tosner J, et al. Anthropometric measured fat-free mass as essential determinant of resting energy expenditure for pregnant and non-pregnant women. Nutrition, 2011; 27, 885-90. |
| 32. | Butte NF, Hopkinson JM, Mehta N, et al. Adjustments in energy expenditure and substrate utilization during late pregnancy and lactation. Am J Clin Nutr, 1999; 69, 299-307. |
| 33. | Stumvoll M, Meyer C, Mitrakou A, et al. Renal glucose production and utilization:new aspects in humans. Diabetologia, 1997; 40, 749-57. |
| 34. | Gastaldelli A, Baldi S, Pettiti M, et al. Influence of obesity and type 2 diabetes on gluconeogenesis and glucose output in humans:a quantitative study. Diabetes, 2000; 49, 1367-73. |
| 35. | Cho GJ, Yoon HJ, Kim EJ, et al. Postpartum changes in body composition. Obesity (Silver Spring), 2011; 19, 2425-8. |
| 36. | Wang J, Pierson RN, Jr. Disparate hydration of adipose and lean tissue require a new model for body water distribution in man. J Nutr, 1976; 106, 1687-93. |
| 37. | Moses RG, Shand JL, Tapsell LC. The recurrence of gestational diabetes:could dietary differences in fat intake be an explanation? Diabetes Care, 1997; 20, 1647-50. |
| 38. | Park S, Kim MY, Baik SH, et al. Gestational diabetes is associated with high energy and saturated fat intakes and with low plasma visfatin and adiponectin levels independent of prepregnancy BMI. Eur J Clin Nutr, 2013; 67, 196-201. |
| 39. | Saldana TM, Siega-Riz AM, Adair LS. Effect of macronutrient intake on the development of glucose intolerance during pregnancy. Am J Clin Nutr, 2004; 79, 479-86. |
| 40. | Wang Y, Storlien LH, Jenkins AB, et al. Dietary variables and glucose tolerance in pregnancy. Diabetes Care, 2000; 23, 460-4. |
| 41. | Radesky JS, Oken E, Rifas-Shiman SL, et al. Diet during early pregnancy and development of gestational diabetes. Paediatr Perinat Epidemiol, 2008; 22, 47-59. |
| 42. | Bo S, Menato G, Lezo A, et al. Dietary fat and gestational hyperglycaemia. Diabetologia, 2001; 44, 972-8. |
| 43. | Zhang C, Liu S, Solomon CG, et al. Dietary fiber intake, dietary glycemic load, and the risk for gestational diabetes mellitus. Diabetes Care, 2006; 29, 2223-30. |
| 44. | Ley SH, Hanley AJ, Retnakaran R, et al. Effect of macronutrient intake during the second trimester on glucose metabolism later in pregnancy. Am J Clin Nutr, 2011; 94, 1232-40. |
| 45. | McIntosh M, Miller C. A diet containing food rich in soluble and insoluble fiber improves glycemic control and reduces hyperlipidemia among patients with type 2 diabetes mellitus. Nutr Rev, 2001; 59, 52-5. |
| 46. | Ylonen K, Saloranta C, Kronberg-Kippila C, et al. Associations of dietary fiber with glucose metabolism in nondiabetic relatives of subjects with type 2 diabetes:the Botnia Dietary Study. Diabetes Care, 2003; 26, 1979-85. |
| 47. | Liese AD, Schulz M, Fang F, et al. Dietary glycemic index and glycemic load, carbohydrate and fiber intake, and measures of insulin sensitivity, secretion, and adiposity in the Insulin Resistance Atherosclerosis Study. Diabetes Care, 2005; 28, 2832-8. |