


b. Research Center of Quantitative Ecology, Nanjing Forestry University, Nanjing 210037, China;
c. University of Chinese Academy of Sciences, Beijing 100049, China;
d. Yunnan Key Laboratory of Forest Ecosystem Stability and Global Change, Xishuangbanna Tropical Botanical Garden, Chinese Academy of Sciences, Mengla 666303, China
Comparative analysis has long served as a foundational approach in ecological and evolutionary sciences, providing critical insights into the mechanisms underlying biodiversity patterns (Felsenstein, 1985; Lynch, 1991; Uyeda et al., 2018). A central challenge in such analyses lies in the fact that trait similarities among species often result not only from shared ecological conditions but also from common ancestry (Cornwallis and Griffin, 2024). In particular, the non-independence introduced by phylogenetic relationships—known as phylogenetic signal—violates the assumption of independent observations inherent in conventional statistical models, potentially leading to biased parameter estimates and inflated Type I error rates (Garland and Ives, 2000; Freckleton et al., 2002; Münkemüller et al., 2012; Adams and Collyer, 2018).
To address this issue, Phylogenetic Generalized Linear Models (PGLMs) have been developed as an extension of traditional generalized linear models (Ives and Garland, 2010; Ho and Ané, 2014). These models incorporate phylogenetic relationships by embedding a phylogenetic covariance matrix in the error structure, thereby enabling the analysis of continuous or binary response variables while accounting for evolutionary relatedness among taxa (Freckleton et al., 2002; Ives and Garland, 2010). Over the past decade, PGLMs have been increasingly used in ecological research, particularly in investigating trait–environment relationships, improving species distribution models, and exploring the evolutionary dynamics of ecological strategies (e.g., Kahl et al., 2017; van Kleunen et al., 2020; Omer et al., 2022; Guo et al., 2022; Yang et al., 2025). When incorporating phylogeny into regression models, a key question arises: how much of the variation in the response variable can be attributed to phylogeny, and how much to other predictors, such as environmental variables or another functional trait? To address this, Ives (2019) proposed a general framework for estimating partial R2 values in PGLMs. This approach involves comparing the likelihood of full and reduced models, each sequentially omitting a specific component (such as the phylogenetic covariance or a particular predictor). These partial R2 metrics allow the unique contribution of each model component to be quantified, thereby facilitating the assessment of the relative influence of phylogeny versus ecological covariates in explaining trait variation (e.g., Ives, 2019; Wang et al., 2022; Feng and Wang, 2024).
Despite its utility, the partial R2 framework has notable limitations. A key issue is that the sum of partial R2 values for all predictors (including phylogeny) often fails to equal the total R2 of the model (e.g., Wang et al., 2022; Feng and Wang, 2024). This discrepancy arises from the non-additive nature of explained variance when predictors are correlated, a well-known issue in regression analysis (Bi, 2012). Under such circumstances, partial R2 values may misrepresent the unique contribution of individual predictors, necessitating cautious interpretation and, in some cases, complementary analytical approaches.
Lai et al. (2022a) introduced the individual R2 based on the concept of average shared variance (ASV) as a novel method for assessing the relative importance of predictors in multiple regression and canonical analyses. This method addresses multicollinearity by equitably partitioning overlapping explained variance among correlated predictors, thereby facilitating a more transparent quantification of each variable's contribution. The individual R2 for each variable is calculated as the sum of its unique R2 and its equally allocated shared R2 (as illustrated in Fig. 1). Notably, this method produces results that are closely aligned with several well-established techniques—such as "averaging over orderings" (Lindeman et al., 1980; Kruskal and Majors, 1989), "hierarchical partitioning" (Chevan and Sutherland, 1991), and "dominance analysis" (Budescu, 1993)—despite emerging independently across disciplines with distinct computational underpinnings. Moreover, Lai et al. (2022a) formally established a mathematical connection between their framework and "commonality analysis", a widely used variance decomposition technique in multiple regression (Ray-Mukherjee et al., 2014), thereby enhancing the interpretability and accessibility of the ASV method.

|
| Fig. 1 The Venn diagram illustrates the components of variation partitioning within a Phylogenetic Generalized Linear Model (PGLM). The large outer circle represents the total variation in the response variable, while the three smaller, overlapping circles correspond to the portions of explained variation attributed to phylogeny and two collinear predictors (or two groups of predictors). Dashed lines within the overlapping regions indicate that the shared fractions of explained variation are equally divided among the contributing predictors. |
The introduction of the ASV framework has spurred the development of several R packages that enable its application across a range of statistical modeling contexts. These include the rdacca.hp package for canonical analysis (Lai et al., 2022a), the glmm.hp package for Generalized Linear Mixed Models (GLMMs) (Lai et al., 2022b) and multiple regression (Lai et al., 2023), and the recently developed gam.hp package for Generalized Additive Models (GAMs) (Lai et al., 2024). These tools have been widely adopted in ecological and environmental research. As of June 2025, citations recorded by the Web of Science (http://www.webofknowledge.com/) indicate rdacca.hp has been cited over 800 times, glmm.hp more than 300 times, and gam.hp, despite its recent release, has already garnered approximately 30 citations. This growing usage highlights both the broad recognition of the method's utility and its valuable contribution to advancing statistical modeling and data interpretation in ecological studies.
In this study, we extend the ASV concept to the PGLMs framework by developing a new R package, phylolm.hp. We demonstrate the functionality of phylolm.hp through two case studies: one involving continuous trait data and another focusing on binary trait data. These examples showcase the potential of phylolm.hp to advance phylogenetically informed comparative analyses by disentangling the relative influences of ecological predictors and evolutionary history on trait variation.
2. MethodsWithin the ASV framework, phylogeny can be explicitly treated as an explanatory variable alongside ecological or trait-based predictors. To illustrate this approach, consider a PGLM scenario that includes three sets of predictors: phylogenetic structure (denoted as phy), and two additional variables or groups of variables (X1 and X2) (Fig. 1). In this context, the fractions [a], [b], and [c] represent the unique R2 attributable to phy, X1, and X2, respectively. Fractions [d], [e], and [f] denote the pairwise shared variance components between each pair of predictors (e.g., phy and X1), while fraction [g] captures the variance jointly explained by all three predictors. The individual R2 for each predictor is then calculated as the sum of its unique R2 and its allocated shared R2 values, following the ASV principle. Specifically, the individual R2 values are computed using the following expressions:
| \begin{aligned} \mathrm{R}_{\mathrm{phy}}^2=\mathrm{a}+\frac{\mathrm{d}}{2}+\frac{\mathrm{f}}{2}+\frac{\mathrm{g}}{3} \end{aligned} | (1) |
| \begin{aligned} \mathrm{R}_{\mathrm{X} 1}^2=\mathrm{b}+\frac{\mathrm{d}}{2}+\frac{\mathrm{e}}{2}+\frac{\mathrm{g}}{3} \end{aligned} | (2) |
| \begin{aligned} \mathrm{R}_{\mathrm{X} 2}^2=\mathrm{c}+\frac{\mathrm{f}}{2}+\frac{\mathrm{e}}{2}+\frac{\mathrm{g}}{3} \end{aligned} | (3) |
Here, Rphy2, RX12 and RX22 represent the individual R2 for phylogeny and the predictors X1 and X2, respectively. The sum of these values equals the total R2 of the model (Lai et al., 2022a).
| \begin{aligned} \mathrm{R}^2=\mathrm{R}_{\mathrm{phy}}^2+\mathrm{R}_{\mathrm{X} 1}^2+\mathrm{R}_{\mathrm{X} 2}^2 \end{aligned} | (4) |
This method provides a key advantage by decomposing the total R2 into the individual contributions of each predictor (Lai et al., 2022a, 2022b). While conceptually related to commonality analysis—which partitions explained variance into unique and shared components based on all possible subset models (Ray-Mukherjee et al., 2014)—the ASV approach distributes the shared variance equitably among correlated predictors using a mathematically consistent and computationally efficient algorithm. The unique R2 for each predictor is obtained by comparing the full model with reduced models in which that predictor is omitted. In contrast to previous applications of the method that analyzed all predictors within a single modeling framework (Lai et al., 2022a, 2022b, 2023, 2024), the unique R2 of phylogeny can also be approximated by comparing a PGLM with a conventional Generalized Linear Model (GLM) that excludes the phylogenetic structure.
3. Package descriptionThe phylolm.hp package, developed in the R programming language (R Core Team, 2024), is available on the Comprehensive R Archive Network (CRAN) at http://cran.r-project.org/web/packages/phylolm.hp/ and on GitHub at https://github.com/laijiangshan/phylolm.hp. It provides two primary functions: phylolm.hp() and phyloglm.hp(). These functions calculate the individual R2 of phylogeny and each predictor (or group of predictors) in phylogenetic linear models for continuous traits and phylogenetic logistic regression models for binary traits, respectively. The package provides an S3 plotting method, plot.phylolmhp(), which generates bar charts to visualize individual R2 values using the ggplot2 package (Wickham, 2016). The phylolm.hp package depends on the rr2 package (Ives, 2019) to calculate likelihood-based R2 for GLMMs.
Both phylolm.hp() and phyloglm.hp() require three main input arguments: mod, iv, and commonality. The mod argument specifies a model object fitted using phylolm() or phyloglm() from the phylolm package (Ho and Ané, 2014). The iv argument is an optional list that allows users to group predictors based on analytical goals, such as aggregating environmental variables or trait sets. The commonality is a logical argument. When set to TRUE, the function returns the full commonality analysis of R2, displaying all unique and common variance components among predictors. By default, commonality is set to FALSE, in which case only the individual R2 values are returned.
4. A working example 4.1. Continuous trait data analysisWe employed phylogenetic linear regression models to examine relationships among functional traits, environmental factors, and phylogenetic history in 107 species spanning six distinct California ecosystems. The dataset (data1), derived from Medeiros et al. (2023), provides comprehensive species-level information across these ecosystems. In this analysis, we selected maximum tree height (Hmax) as the response variable to evaluate its associations with other functional traits, environmental factors, and phylogenetic relationships. A recent study by Mao et al. (2023) demonstrated that maximum canopy height is also closely related to the phylogenetic structure of forest communities in boreal ecosystems, underscoring the ecological and evolutionary relevance of Hmax in forest dynamics.
We selected four predictors for analysis: two functional traits — leaf mass per area (LMA) and C: N ratio (CN.ratio), and two environmental variables — mean annual precipitation (MAP) and soil pH measured at 30 cm depth (SoilpH). These variables were selected based on their well-documented roles in influencing plant growth and height development. Specifically, LMA and C: N ratio are widely recognized indicators of leaf economics and nutrient-use strategies, which can influence species' structural investment and growth potential (Reich et al., 2003; Wright et al., 2004). MAP reflects water availability, a critical environmental constraint on tree height in Mediterranean and arid ecosystems (Niinemets, 2010; Allen et al., 2010). Soil pH influences nutrient availability and microbial activity, and has been shown to affect plant community composition and functional traits (Bååth and Anderson, 2003; Laliberté et al., 2017). The phylogenetic tree was constructed using the S3 scheme of the U.PhyloMaker package (Jin and Qian, 2023) based on the species list. Complete methodological procedures and example codes are presented in Box 1.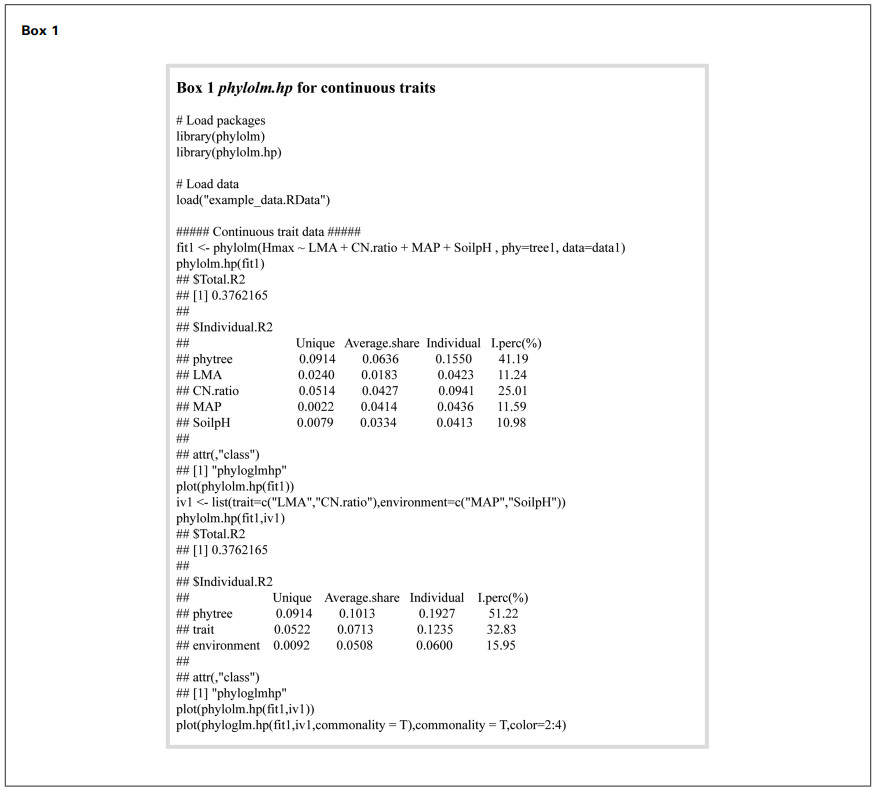
The analysis indicated that the model's total R2 is 0.3762. According to the results of phylolm.hp(), phylogeny emerged as the strongest predictor (individual R2 = 0.1550), accounting for 41.19% of the total R2, followed by C: N ratio (25.01%, individual R2 = 0.0941), MAP (11.59%, individual R2 = 0.0436), LMA (11.24%, individual R2 = 0.0423) and Soil pH (10.98%, individual R2 = 0.0413) (Box 1 and Fig. 2). The considerable shared contributions—particularly from phylogeny (average shared effect = 0.0636)—indicate substantial explanatory overlap among the predictors with respect to Hmax variation.

|
| Fig. 2 The relative importance of phylogenetic, trait, and environmental groups in explaining variation in maximum tree height (Hmax), as estimated by the phylolm.hp() function. Main plot: relative importance of individual variables. Inset plot: relative importance of variable groups. |
The phylolm.hp() function allows grouping of explanatory variables by setting the iv argument. In this case, LMA and C: N ratio were grouped as functional traits, while MAP and Soil pH were grouped as environmental factors. This grouped analysis retained the total model R2 at 0.3762. Phylogeny still accounted for the largest unique contribution (unique R2 = 0.0914), but its shared contribution increased (shared R2 = 0.1013), resulting in phylogeny accounting for 51.22% of the total R2. Functional traits accounted for 32.83%, while environmental factors contributed 15.95%. These results highlight the dominant influence of phylogeny on variation in Hmax, with moderate but meaningful contributions from traits and environmental factors.
It is important to note that the grouped results are not equivalent to the sum of the individual R2 values obtained without grouping. When predictors are not grouped, the analysis accounts for collinearity among all variables, including those within the same conceptual group. In contrast, grouping predictors focuses on the collinearity between groups while ignoring within-group collinearity. Therefore, when evaluating the relative importance of higher-level categories (e.g., phylogeny vs. traits vs. environment), the analysis should be conducted with predefined groups rather than aggregating ungrouped results post hoc.
Additionally, the phylolm.hp() function provides a commonality argument, which enables commonality analysis. When the number of predictor groups (including phylogeny) does not exceed four groups, the results can also be visualized using a Venn diagram via the plot.phylolmhp function (Fig. 3). In this example, the commonality analysis of grouped variables revealed the largest unique contribution from phylogeny (0.0914), followed by traits (0.0522) and environment (0.0092). Notably, substantial shared variance existed between phylogeny and traits (0.101), as well as between phylogeny and environment (0.060), highlighting the central role of phylogeny in shared explanatory variance (0.1013).

|
| Fig. 3 Venn diagram showing the unique and shared contributions of phylogenetic relationships, functional traits, and environmental factors to the variation in maximum tree height (Hmax). |
A comparison with the traditional partial R2 approach is presented in Appendix 1. The results show that although the ranking of variable importance remains consistent between the partial R2 and ASV methods, the sum of the partial R2 values accounts for only 68% of the model's total R2. In contrast, the sum of the individual R2 values derived from the ASV approach exactly equals the total R2, aligning well with the full-contribution criterion for relative importance measures proposed by Genizi (1993).
4.2. Binary trait data analysisIn this example, we employed PGLMs to investigate the relationship between species invasiveness and functional traits in 76 woody plant species from North American deciduous forests. The dataset (data2), derived from Fridley et al. (2022), included both native and non-native invasive species and comprised 68 continuous traits reflecting diverse aspects of plant physiology and structure. We selected four functional traits as predictor variables: two related to leaf structure—leaf mass (leafmass) and leaf thickness (leafthickness)—and two associated with belowground resource acquisition and storage—specific root length (SRL) and root non-structural carbohydrate content (nsc.root). These traits were chosen due to their established roles in resource-use strategies and their documented associations with plant invasiveness. Specifically, leaf mass and leaf thickness are linked to leaf economics and structural investment, influencing light capture and growth rate (Niinemets, 2001; Perez-Harguindeguy et al., 2016). SRL reflects root foraging efficiency and nutrient acquisition potential, traits that are often enhanced in invasive species (Ostonen et al., 2007). Root non-structural carbohydrate content plays a key role in stress tolerance and resprouting ability, both associated with invasive potential (O'Brien et al., 2014). Phylogenetic relationships were derived from the tree provided in the original study by Fridley et al. (2022). Complete methodological procedures and example codes are presented in Box 2.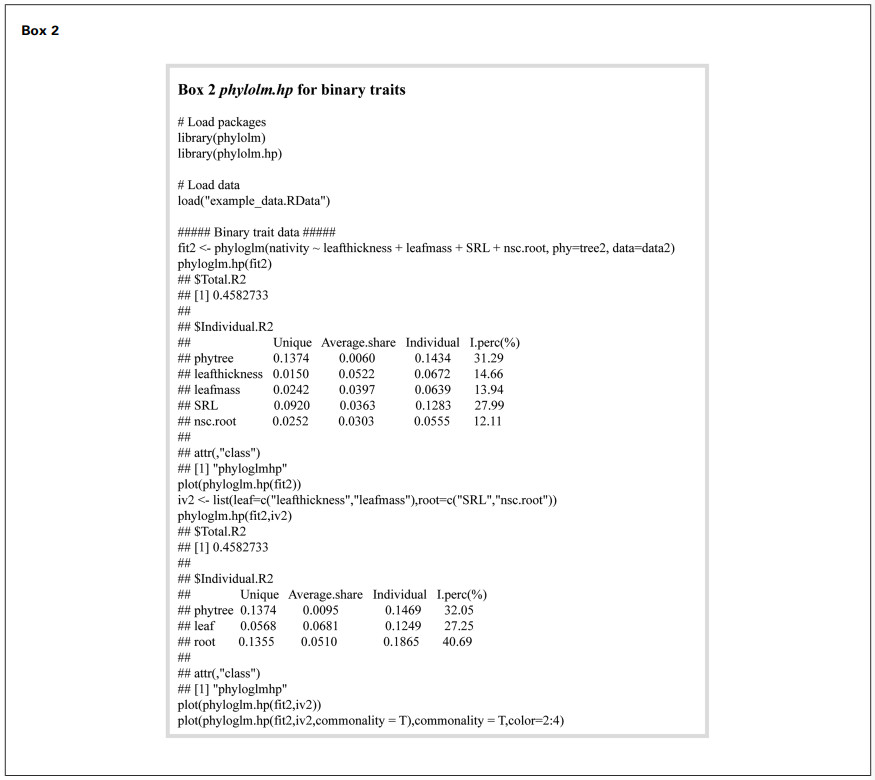
We constructed a comprehensive model incorporating leaf thickness, leaf mass, SRL, and root non-structural carbohydrate content as predictors, and calculated the individual R2 values with the phyloglm.hp() function. The model's total R2 was 0.4583. Phylogeny showed the highest individual contribution (31.29%, Individual R2 = 0.1434), highlighting the critical influence of evolutionary history on invasiveness. SRL demonstrated the second-highest individual contribution (27.99%, Individual R2 = 0.1283), while leaf thickness, leaf mass, SRL, and root non-structural carbohydrate content each explained a smaller portion of nativity variation (14.66%, 13.94%, and 12.11%, respectively) (Fig. 4).

|
| Fig. 4 The relative importance of phylogenetic, root traits and leaf traits in explaining nativity variation by phyloglm.hp() function. Main plot: Relative importance of individual variables. Inset plot: Relative importance of variable groups. |
To further explore the effects of different organ functional traits on invasiveness, we categorized the traits into leaf traits (leafthickness, leafmass) and root traits (SRL, nsc.root) groups. Grouped analysis maintained the total R2 at 0.4583. Among the three major factors, the root trait group contributed the largest individual R2 (40.69%), followed by phylogenetic relationships (32.05%) and leaf trait group (27.25%) (Box 2 and Fig. 4). Venn diagram for commonality analysis (Fig. 5) intuitively showed the unique contributions of each group: phylogenetic relationships (0.1374), root traits (0.1355), and leaf traits (0.0568). There was substantial overlap between the leaf and root trait groups, with a shared variation of 0.0888. As a result, a large proportion of the shared variance was allocated to the root trait group (0.0510). Moreover, the variation shared by all three groups (0.0625) indicated important intersections and coupling among phylogeny, leaf traits, and root traits in explaining the variation in nativity.

|
| Fig. 5 Venn diagram showing the unique and shared contributions of phylogenetic relationships, root traits groups and leaf traits groups in explaining nativity variation. |
Phylogenetic Generalized Linear Models (PGLMs), like Generalized Linear Mixed Models (GLMMs), have traditionally lacked a well-defined R2 statistic in the classical sense of multiple linear regression, due to complications introduced by random effects or phylogenetic correlations among residuals (Ives and Garland, 2010; Nakagawa and Schielzeth, 2013; Ives, 2022). To address this limitation, Nakagawa and Schielzeth (2013) proposed an R2 framework for GLMMs, which was later extended by Ives (2019) to accommodate models with correlated residuals, including PGLMs. This extension yields a likelihood-based pseudo-R2, that approximates total model fit and captures the joint contribution of fixed predictors and phylogenetic structure.
While this approach provides a measure of overall goodness of fit, a key challenge remains: accurately partitioning the explained variance among correlated predictors—particularly between phylogenetic and ecological or trait-based variables—due to the inherent non-independence arising from shared evolutionary history. Current implementations of partial R2 in PGLMs (e.g., Ives, 2019; Wang et al., 2022; Feng and Wang, 2024) focus primarily on estimating the unique contribution of individual predictors, often ignoring the overlapping variance explained jointly by multiple predictors. This omission can lead to biased or incomplete interpretations, especially in cases where partial R2 values represent only a small fraction of the total R2.
To address this limitation, the concept of ASV was introduced (Lai et al., 2022a, 2022b), which redistributes the overlapping explanatory power among predictors in a fair and interpretable manner. This concept forms the theoretical foundation of the phylolm.hp package, which extends likelihood-based pseudo-R2 decomposition in PGLMs to include both unique and shared contributions of predictors. This methodological innovation enriches the statistical toolkit for comparative biology and phylogenetic analysis, offering more nuanced insights into the ecological and evolutionary drivers of trait variation.
It is important to emphasize that the concept of ASV provides a simple and practical approach for decomposing R2, particularly in the presence of highly correlated predictors (Lai et al., 2022a, 2022b). However, it is mathematically impossible to unambiguously assign the shared portion of explained variance to any specific predictor or group of predictors (Grömping, 2007). When considerable overlap exists among predictors, the equal apportioning of shared variance—though simple and transparent—may introduce uncertainty in interpreting the individual contributions of each variable. Users should recognize this inherent limitation and exercise caution when interpreting the results from the ASV. Therefore, biological or ecological understanding should play a central role in contextualizing the findings, rather than relying solely on statistical results (Johnson and Omland, 2004).
The case studies presented in this paper—one involving continuous traits (Medeiros et al., 2023) and another focusing on binary traits (Fridley et al., 2022)—are not intended to test specific ecological hypotheses but rather serve as illustrative examples of the functionality and practical applications of the phylolm.hp package. These examples are based on publicly available portions of datasets from previous studies, used with permission from the original authors.
Importantly, the shared variance between phylogeny and ecological predictors may have meaningful biological implications rather than being solely a statistical artifact. For instance, in the analysis presented in Box 1, a total common effect of 0.2234 accounts for 59.38% of the total R2, indicating a substantial overlap in explanatory power between evolutionary history and ecological variables. This overlap can be understood through the concept of phylogenetic niche conservatism, which posits that closely related species tend to retain similar ecological traits and environmental preferences across evolutionary timescales (Wiens and Graham, 2005). In practice, ecological predictors—such as climate, soil type, or resource availability—often show phylogenetic signal, meaning that species' responses to these predictors are not evolutionarily independent (Cavender-Bares et al., 2009). Therefore, the collinearity between phylogeny and ecological predictors makes it difficult to fully separate their explanatory contributions. In this context, the overlap between explanatory variables often reflects the actual eco-evolutionary relationships, where historical lineage divergence and current environmental filtering jointly shape the distribution of species traits. For example, if certain leaf functional traits are associated with moisture availability and closely related species are predominantly found in similar moisture regimes, this can lead to phylogenetic clustering. This indicates the existence of phylogenetic niche conservatism, meaning that evolutionary history constrains both traits and ecological niches, resulting in closely related species often coexisting in similar environments (Cavender-Bares et al., 2004). In this scenario, the shared variance signals a real ecological-evolutionary coupling. Conversely, if phylogeny and environment are correlated simply due to sampling bias or historical dispersal limitations unrelated to trait adaptation, the shared component may inflate the perceived importance of either predictor set, leading to misinterpretation of causality. Thus, researchers must interpret shared variance with biological insight and caution, considering both the evolutionary history of traits and the functional relevance of ecological predictors. Including trait-specific phylogenetic signal tests and evaluating the robustness of shared effects across multiple datasets or models can help validate whether overlap is biologically justified. Accurately quantifying and thoughtfully interpreting these shared effects is essential for disentangling the intertwined roles of phylogeny and ecology in shaping organismal traits, community assembly, and macroecological patterns (Losos, 2008; Crisp and Cook, 2012).
In addition to the ASV-based phylolm.hp method employed in this study, phylogenetic eigenvector approaches are also commonly used to decompose the independent contribution of phylogeny to total variation (Guo et al., 2024). Both methods have distinct advantages and limitations when decomposing the relative importance of phylogenetic and ecological predictors. The ASV-based variance decomposition can systematically and transparently assign variance contributions to phylogeny and other predictors even under strong multicollinearity, making the results straightforward to interpret. However, when predictors have substantial overlapping explanatory power, the assigned "independent contributions" may be less precise, introducing interpretive uncertainty (Ives, 2019). In contrast, the phylogenetic eigenvectors method transforms phylogenetic structure into regression variables, allowing for independent assessment under complex or high-dimensional phylogenetic patterns, but the analysis depends on the selection of eigenvectors and may be subject to subjectivity and multicollinearity issues (Diniz-Filho et al., 2012). Future studies are advised to select and, where appropriate, integrate these approaches depending on the specific research question, data structure, and analytical objectives, and to further compare their practical value and explanatory power.
The development of the phylolm.hp package is also consistent with recent trends in quantitative ecology: a large-scale review by Gao et al. (2025) showed a growing reliance on advanced R-based tools in ecological research over the past 15 years. Looking ahead, we aim to further enhance the performance and scalability of the phylolm.hp package. Although the current implementation is effective for models with a moderate number of predictors, computational efficiency may become a limiting factor when analyzing high-dimensional datasets. Future development will focus on optimizing algorithmic speed and memory usage, thereby ensuring that the method remains robust and practical for increasingly complex data in ecological and evolutionary research.
AcknowledgementsThis research was supported by the National Natural Science Foundation of China (32271551, 32571954), National Key Research and Development Program of China (2023YFF0805800) and the Metasequoia funding of Nanjing Forestry University.
CRediT authorship contribution statement
Jiangshan Lai: Writing – original draft, Data curation, Conceptualization. Yan He: Writing – original draft, Formal analysis, Data curation. Mi Hou: Data curation. Aiying Zhang: Data curation. Gang Wang: Writing – original draft, Data curation. Lingfeng Mao: Writing – review & editing, Investigation.
Data accessibility statement
The phylolm.hp package is available for installation from the Comprehensive R Archive Network (CRAN) at http://cran.r-project.org/web/packages/phylolm.hp/ or GitHub at https://github.com/laijiangshan/phylolm.hp. The exact processed datasets used in all code examples, together with the associated code (example_data.RData and code.R), are included in the supplementary materials as attachments.
Declaration of competing interest
The authors declare that they have no competing financial interests or personal relationships that could have appeared to influence the work reported in this paper.
Appendix A. Supplementary data
Supplementary data to this article can be found online at https://doi.org/10.1016/j.pld.2025.06.003.
Adams, D.C., Collyer, M.L., 2018. Multivariate phylogenetic comparative methods: evaluations, comparisons, and recommendations. Syst. Biol., 67: 14-31. DOI:10.1093/sysbio/syx055 |
Allen, C.D., Macalady, A.K., Chenchouni, H., et al., 2010. A global overview of drought and heat-induced tree mortality reveals emerging climate change risks for forests. For. Ecol. Manag., 259: 660-684. |
Bååth, E., Anderson, T.H., 2003. Comparison of soil fungal/bacterial ratios in a pH gradient using physiological and PLFA-based techniques. Soil Biol. Biochem., 35: 955-963. |
Bi, J., 2012. A review of statistical methods for determination of relative importance of correlated predictors and Identification of drivers of consumer liking. J. Sensory Stud., 27: 87-101. |
Budescu, D.V., 1993. Dominance analysis: a new approach to the problem of relative importance of predictors in multiple regression. Psychol. Bull., 114: 542-551. |
Cavender-Bares, J., Ackerly, D.D., Baum, D.A., et al., 2004. Phylogenetic overdispersion in Floridian oak communities. Am. Nat., 163: 823-843. |
Cavender-Bares, J., Kozak, K.H., Fine, P.V., et al., 2009. The merging of community ecology and phylogenetic biology. Ecol. Lett., 12: 693-715. DOI:10.1111/j.1461-0248.2009.01314.x |
Chevan, A., Sutherland, M., 1991. Hierarchical partitioning. Am. Stat., 45: 90-96. |
Cornwallis, C.K., Griffin, A.S., 2024. A guided tour of phylogenetic comparative methods for studying trait evolution. Annu. Rev. Ecol. Evol. Syst., 55: 181-204. DOI:10.1146/annurev-ecolsys-102221-050754 |
Crisp, M.D., Cook, L.G., 2012. Phylogenetic niche conservatism: what are the underlying evolutionary and ecological causes?. New Phytol., 196: 681-694. DOI:10.1111/j.1469-8137.2012.04298.x |
Diniz-Filho, J.A.F., Bini, L.M., Rangel, T.F., et al., 2012. On the selection of phylogenetic eigenvectors for ecological analyses. Ecography, 35: 239-249. DOI:10.1111/j.1600-0587.2011.06949.x |
Felsenstein, J., 1985. Phylogenies and the comparative method. Am. Nat., 125: 1-15. |
Feng, Y., Wang, B., 2024. Relative contribution of phylogeny on fruit type divergence decreases along latitudinal gradients. Acta Oecol.-Int. J. Ecol., 122: 103980. |
Freckleton, R.P., Harvey, P.H., Pagel, M., 2002. Phylogenetic analysis and comparative data: a test and review of evidence. Am. Nat., 160: 712-726. |
Fridley, J.D., Bauerle, T.L., Craddock, A., et al., 2022. Fast but steady: an integrated leaf-stem-root trait syndrome for woody forest invaders. Ecol. Lett., 25: 900-912. DOI:10.1111/ele.13967 |
Gao, M., Ye, Y., Zheng, Y., et al., 2025. A comprehensive analysis of R's application in ecological research from 2008 to 2023. J. Plant Ecol., 18: rtaf010. |
Garland, T., Ives, A.R., 2000. Using the past to predict the present: confidence intervals for regression equations in phylogenetic comparative methods. Am. Nat., 155: 346-364. DOI:10.2307/3078871 |
Genizi, A., 1993. Decomposition of R2 in multiple regression with correlated regressors. Stat. Sin., 3: 407-420. |
Grömping, U., 2007. Estimators of relative importance in linear regression based on variance decomposition. Am. Stat., 61: 139-147. |
Guo, K., Pyšek, P., Chytrý, M., et al., 2022. Ruderals naturalize, competitors invade: varying roles of plant adaptive strategies along the invasion continuum. Funct. Ecol., 36: 2469-2479. DOI:10.1111/1365-2435.14145 |
Guo, L., Deng, M., Li, X., et al., 2024. Evolutionary and ecological forces shape nutrient strategies of mycorrhizal woody plants. Ecol. Lett., 27: e14330. |
Ho, L.S.T., Ané, C., 2014. A linear-time algorithm for Gaussian and non-Gaussian trait evolution models. Syst. Biol., 63: 397-408. DOI:10.15460/hup.79.606 |
Ives, A.R., Garland, T., 2010. Phylogenetic logistic regression for binary dependent variables. Syst. Biol., 59: 9-26. DOI:10.1093/sysbio/syp074 |
Ives, A.R., 2019. R2s for correlated data: phylogenetic models, LMMs, and GLMMs. Syst. Biol., 68: 234-251. DOI:10.1093/sysbio/syy060 |
Ives, A.R., 2022. Random errors are neither: on the interpretation of correlated data. Methods Ecol. Evol., 13: 2092-2105. DOI:10.1111/2041-210x.13971 |
Jin, Y., Qian, H., 2023. U.PhyloMaker: an R package that can generate large phylogenetic trees for plants and animals. Plant Divers., 45: 347-352. |
Johnson, J., Omland, K., 2004. Model selection in ecology and evolution. Trends Ecol. Evol., 19: 101-108. |
Kahl, T., Arnstadt, T., Baber, K., et al., 2017. Wood decay rates of 13 temperate tree species in relation to wood properties, enzyme activities and organismic diversities. For. Ecol. Manag., 391: 86-95. |
Kruskal, W.H., Majors, R., 1989. Concepts of relative importance in recent scientific literature. Am. Stat., 43: 2-6. |
Lai, J.S., Tang, J., Li, T.Y., et al., 2024. Evaluating the relative importance of predictors in Generalized Additive Models using the gam.hp R package. Plant Divers., 46: 542--546. |
Lai, J.S., Zhu, W.J., Cui, D.F., et al., 2023. Extension of the glmm.hp package to zero-inflated generalized linear mixed models and multiple regression. J. Plant Ecol., 16: rtad038. |
Lai, J.S., Zou, Y., Zhang, J.L., et al., 2022a. Generalizing hierarchical and variation partitioning in multiple regression and canonical analyses using the rdacca.hp R package. Methods Ecol. Evol., 13: 782-788. DOI:10.1111/2041-210x.13800 |
Lai, J.S., Zou, Y., Zhang, S., et al., 2022b.
glmm.hp: an R package for computing individual effect of predictors in generalized linear mixed models. J. Plant Ecol., 15: 1302-1307. DOI:10.1093/jpe/rtac096 |
Laliberté, E., Kardol, P., Didham, R.K., et al., 2017. Soil fertility shapes belowground food webs across a regional climate gradient. Ecol. Lett., 20: 1273-1284. DOI:10.1111/ele.12823 |
Lindeman, R. H., Merenda, P. F., Gold, R. Z., 1980. Introduction to Bivariate and Multivariate Analysis. Scott, Foresman & Company.
|
Losos, J.B., 2008. Phylogenetic niche conservatism, phylogenetic signal and the relationship between phylogenetic relatedness and ecological similarity among species. Ecol. Lett., 11: 995-1003. DOI:10.1111/j.1461-0248.2008.01229.x |
Lynch, M., 1991. Methods for the analysis of comparative data in evolutionary biology. Evolution, 45: 1065-1080. |
Mao, L.F., Dong, Y.R., Xing, B.B., et al., 2023. Maximum canopy height is associated with community phylogenetic structure in boreal forests. J. Plant Ecol., 16: rtac104. |
Medeiros, C.D., Henry, C., Trueba, S., et al., 2023. Predicting plant species climate niches on the basis of mechanistic traits. Funct. Ecol., 37: 2786-2808. DOI:10.1111/1365-2435.14422 |
Münkemüller, T., Lavergne, S., Bzeznik, B., et al., 2012. How to measure and test phylogenetic signal. Methods Ecol. Evol., 3: 743-756. |
Nakagawa, S., Schielzeth, H., 2013. A general and simple method for obtaining R2 from generalized linear mixed-effects models. Methods Ecol. Evol., 4: 133-142. DOI:10.1111/j.2041-210x.2012.00261.x |
Niinemets, Ü., 2001. Global-scale climatic controls of leaf dry mass per area, density, and thickness in trees and shrubs. Ecology, 82: 453-469. |
Niinemets, Ü., 2010. Responses of forest trees to single and multiple environmental stresses from seedlings to mature plants: past stress history, stress interactions, tolerance and acclimation. For. Ecol. Manag., 260: 1623-1639. |
O'Brien, M.J., Leuzinger, S., Philipson, C.D., et al., 2014. Drought survival of tropical tree seedlings enhanced by non-structural carbohydrate levels. Nat. Clim. Change, 4: 710-714. DOI:10.1038/nclimate2281 |
Omer, A., Fristoe, T., Yang, Q., et al., 2022. The role of phylogenetic relatedness on alien plant success depends on the stage of invasion. Nat. Plants, 8: 906-914. DOI:10.1038/s41477-022-01216-9 |
Ostonen, I., Püttsepp, Ü., Biel, C., et al., 2007. Specific root length as an indicator of environmental change. Plant Biosyst., 141: 426-442. DOI:10.1080/11263500701626069 |
Perez-Harguindeguy, N., Diaz, S., Garnier, E., et al., 2016.
Corrigendum to: New handbook for standardised measurement of plant functional traits worldwide. Aust. J. Bot., 64: 715-716.. DOI:10.1071/bt12225_co |
R Core Team, 2024. R: A language and environment for statistical computing. R Foundation for Statistical Computing. |
Ray-Mukherjee, J., Nimon, K., Mukherjee, S., et al., 2014. Using commonality analysis in multiple regressions: a tool to decompose regression effects in the face of multicollinearity. Methods Ecol. Evol., 5: 320-328. |
Reich, P.B., Wright, I.J., Cavender-Bares, J., et al., 2003. The evolution of plant functional variation: traits, spectra, and strategies. Int. J. Plant Sci., 164: S143-S164. |
Uyeda, J.C., Zenil-Ferguson, R., Pennell, M.W., 2018. Rethinking phylogenetic comparative methods. Syst. Biol., 67: 1091-1109. DOI:10.1093/sysbio/syy031 |
van Kleunen, M., Xu, X., Yang, Q., et al., 2020. Economic use of plants is key to their naturalization success. Nat. Commun., 11: 3201. |
Wang, G., Ives, A.R., Zhu, H., et al., 2022. Phylogenetic conservatism explains why plants are more likely to produce fleshy fruits in the tropics. Ecology, 103: e03555. |
Wickham, H., 2016. ggplot2: Elegant Graphics for Data Analysis , second ed. Springer-Verlag. https://ggplot2.tidyverse.org.
|
Wiens, J.J., Graham, C.H., 2005. Niche conservatism: integrating evolution, ecology, and conservation biology. Annu. Rev. Ecol. Evol. Syst., 36: 519-539. DOI:10.1146/annurev.ecolsys.36.102803.095431 |
Wright, I.J., Reich, P.B., Westoby, M., et al., 2004. The worldwide leaf economics spectrum. Nature, 428: 821-827. |
Yang, S., Ooi, M.K., Falster, D.S., et al., 2025. Continental-scale empirical evidence for relationships between fire response strategies and fire frequency. New Phytol., 246: 528-542. DOI:10.1111/nph.20464 |