Application of incremental dynamic analysis and the cloud method in the seismic vulnerability analysis of underground structures
-
摘要: 为了研究基于云图法与增量动力分析方法地下结构地震易损性对比分析,本文以两层双跨地铁车站结构为研究对象,基于ABAQUS/standard软件平台,建立了考虑土-结构相互作用的二维有限元模型。采用非线性时程动力分析方法,获取了结构在502条原始地震动记录(云图法)以及基于44条地震动调幅后(增量动力分析方法)作用下的动力响应。以层间位移角为结构损伤指标,PGA为地震动强度指标,分别建立了基于云图法与增量动力分析方法计算结果的地铁车站地下结构地震易损性曲线。结果表明:基于云图法与增量动力分析方法所评估的地下结构震后功能失效概率基本相等,最大差异仅为7.5%。与云图法相比,得益于调幅的优势,基于增量动力分析方法的地震易损性分析可以获取地下结构在任意地震动强度作用下的失效概率。上述成果可为基于性能的地下结构抗震设计分析方法提供科学参考依据。Abstract: By taking the structure of a two-story two-span subway station as the research object, a two-dimensional finite element model considering soil-structure interaction is established on the ABAQUS/standard software platform to study the seismic vulnerability analysis of underground structures based on the cloud and incremental dynamic analysis (IDA) methods. The model employs the nonlinear time-history dynamic analysis method to obtain the dynamic response of the structure under the action of 502 original ground motion records (cloud method) and 44 scaled ground motions (IDA method). Interstory drift ratio is selected as the damage measure index, and PGA is chosen as the intensity measure index of ground motion. The seismic fragility curves of the underground subway station structure are established on the basis of the calculation results of the cloud and IDA methods. The postearthquake functional failure probability of the underground structure evaluated by the cloud method is equal to that calculated by the IDA method, and the maximum difference between both values is only 7.5%. In contrast to the cloud method, the seismic vulnerability analysis based on the IDA method can assess the failure probability of the underground structure at any ground motion intensity level because the amplitude can be scaled. The finding mentioned above could provide a scientific reference for a performance-based method for the analysis of the seismic design of underground structures.
-
开发利用地下空间是实现城市可持续发展的重要途经之一。然而,在1995年日本阪神地震,1999年台湾集集地震和1999年土耳其Izmit地震中均观测到了地铁地下结构不同程度的破坏现象[1-3]。地下结构在地震中一旦发生破坏,具有经济损伤大,震后修复难等特点。传统安全或延性的抗震设计方法已不再满足当前结构抗震韧性的需求。基于性能的抗震设计理念旨在对结构震后的人员伤亡、经济损伤、修复时间等特征进行评估[4-5],是未来结构抗震设计发展的主要方向。地震易损性分析的工作可以评估结构震后失效概率,是基于性能抗震设计框架中的重要环节。
结构的地震易损性分析需要基于大量的震后破坏数据资料,数据的来源主要有以下3种途径:基于地震工程专家的意见、历史震害经验数据与数值分析方法[6-7]。随着计算机技术的迅速发展,目前基于数值模拟的地震易损性分析应用最为广泛[8],依据对地震动强度调幅手段的不同,又可分为云图法[9-10]、多条带法(multiple stripe analysis, MSA)[11]、增量动力分析方法(incremental dynamcal analysis, IDA[12-13]与耐震时程分析方法(endulance time method, ETM)[14-15]。云图法选用未经调幅的原始地震动记录进行结构的非线性动力时程分析,并基于最小二乘法对结构的响应与地震动强度参数进行拟合。MSA、IDA以及ETM方法则逐级输入幅值增大的地震动记录进行结构的非线性动力时程分析,以获取结构从弹性至弹塑性响应的全过程,通常采用极大似然估计法或线性回归拟合对结构响应与地震动强度参数关系进行预测。以上地震易损性分析方法在地上结构中的应用相对成熟,然而,由于地下结构抗震设计研究起步较晚,基于地下结构的地震易损性分析研究成果相对较少。仅有少数学者针对地下框架结构开展了地震易损性分析[16-23]。然而,目前尚未见不同数值地震易损性分析方法在地下结构应用的对比研究文献。
综上所述,本文以城市地铁车站地下框架结构横断面为研究对象,基于ABAQUS/Standard有限元软件平台,建立考虑土—结构相互作用的有限元模型。以峰值层间位移角为损伤指标,峰值加速度为地震动强度指标,分别基于云图法与IDA方法建立城市地下框架结构地震易损性曲线,并对2种方法所得到的结构震后失效概率进行对比研究。
1. 地震易损性分析方法
1.1 地震易损性分析基本概念
作为基于性能抗震设计框架的重要组成部分,地震易损性分析旨在给出不同水平地震动强度作用下结构失效概率,主要包括2部分工作:结构概率损伤分析以及概率地震需求分析。其中,结构概率损伤分析的目的是为建立描述结构震后功能失效程度与结构响应之间的联系,即结构承载力限值,一般采用单一损伤指标进行描述。结构概率地震需求分析的主要任务是建立结构响应与地震强度之间的关系,在地震易损性分析中,其结构响应参数一般与损伤指标相对应。FEMA-P58[4]报告与FEMA-P695[24]报告均建议采用高斯分布函数模型来建立结构的地震易损性曲线,即:
$$ P_{L S}=\phi\left[\frac{\ln \left(S_{d} / S_{\mathrm{c}}\right)}{\sqrt{\beta_{\mathrm{RTR}}^{2}+\beta_{C}^{2}+\beta_{\mathrm{MDL}}^{2}}}\right] $$ (1) 式中: $\phi$为标准正态分布函数; $S_{c}$为结构承载力均值; $S_{d}$为地震响应均值; $\beta_{\mathrm{RTR}}$由地震动记录所引起的不确定性; $\beta_{C}$结构承载能力或建设质量的不确定性; $\beta_{\mathrm{MDL}}$分析模型的不确定性。
对于相同结构而言,其结构的损伤模型是一致的,因此,基于云图法与IDA方法的地震易损性的主要区别在于如何求解结构在地震动作用下的响应均值。
1.2 云图法
云图法的概念是通过对结构输人一组包含不同水平强度的原始地震动记录, 以获得结构在不同地震动强度下的地震响应。如图 1所示, 为了估计结构云响应的统计特征, 一般假设结构地震响应(本文取峰值层间位移角为损伤指标: $\hat{\theta}_{\mathrm{IDR}}$) 与地震动强度参数(本文取峰值加速度为地震动强度指标: $\left.I_{\mathrm{PGA}}\right)$的自然对数存在线性关系式:
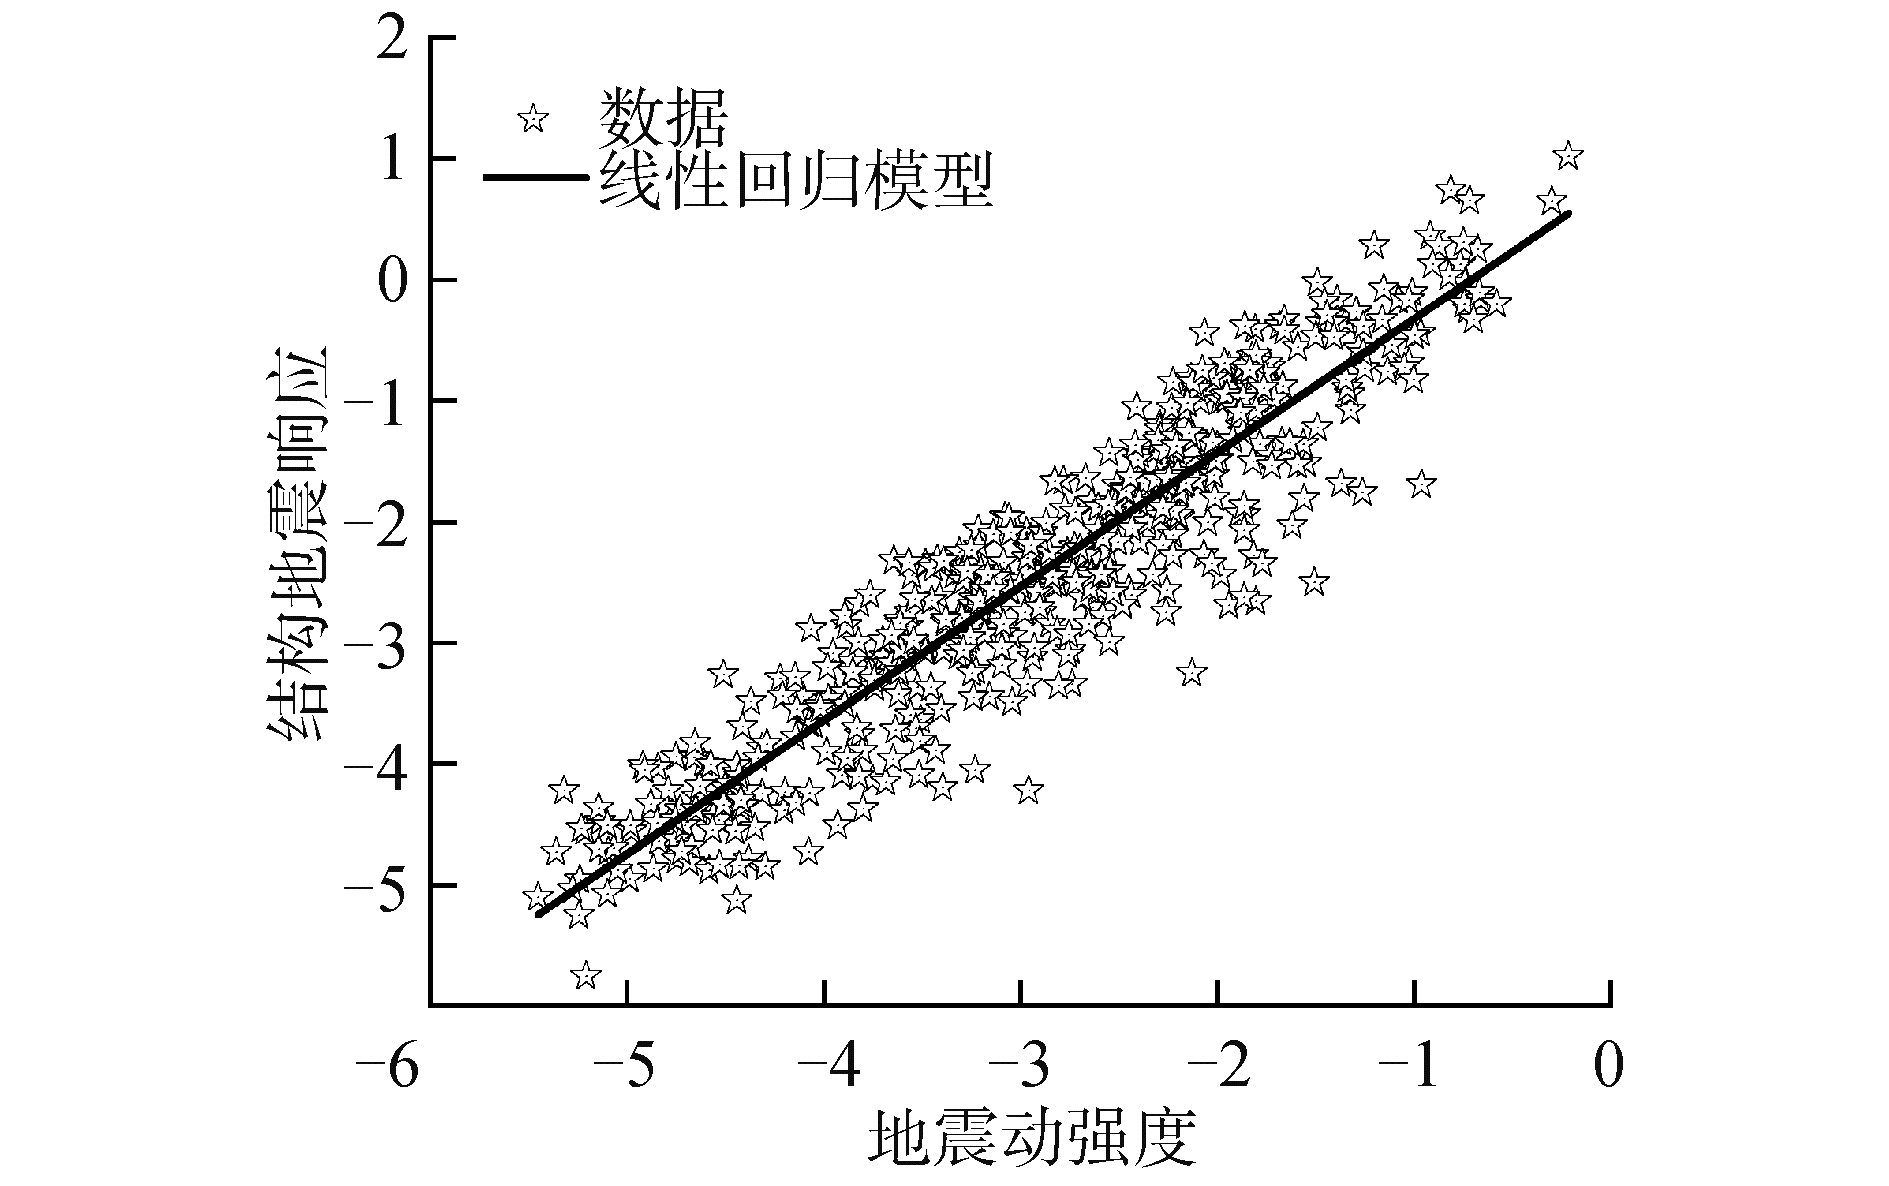 图 1 地震动作用下结构的“云”响应(对数坐标)Fig. 1 Cloud response of structure under ground motion excitation (logarithmic coordinate)
 下载:
全尺寸图片
下载:
全尺寸图片
$$ \ln \left(\hat{\theta}_{\mathrm{IDR} \mid \mathrm{PGA}}\right)=\alpha+b \ln \left(I_{\mathrm{PGA}}\right) $$ (2) 式中: $\hat{\theta}_{\mathrm{IDR} \mid \mathrm{PGA}}$为相同水平地震动强度输人下结构的峰值层间位移角的估计均值; $a$与$b$为线性回归系数。
云图法中结构响应的离散度可以通过计算数据的标准差获得:
$$ \hat{\beta}_{\mathrm{IDR} \mid \mathrm{PGA}}=\sqrt{\frac{\sum\limits_{i=1}^{N}\left(\ln \left(d_{i}\right)-\ln \left(\hat{\theta}_{\mathrm{IDR} \mid \mathrm{PGA}, i}\right)^{2}\right.}{N-2}} $$ (3) 式中: $d_{i}$代表在相应地震动强度水平作用下结构的峰值层间位移角; $N$为输人的地震动记录条数; $\hat{\beta}_{\text {IDR | PGA }}$为结构云响应数据的标准差, 即式(1) 中由地震动记录所引起的不确定性$\beta_{\mathrm{RTR}}$。
1.3 IDA方法
IDA方法的核心是通过反复调整输入结构的地震动强度,以获得结构从弹性到塑性乃至破坏的全部反应过程。如图 2所示,为基于IDA方法的概率地震需求分析步骤:
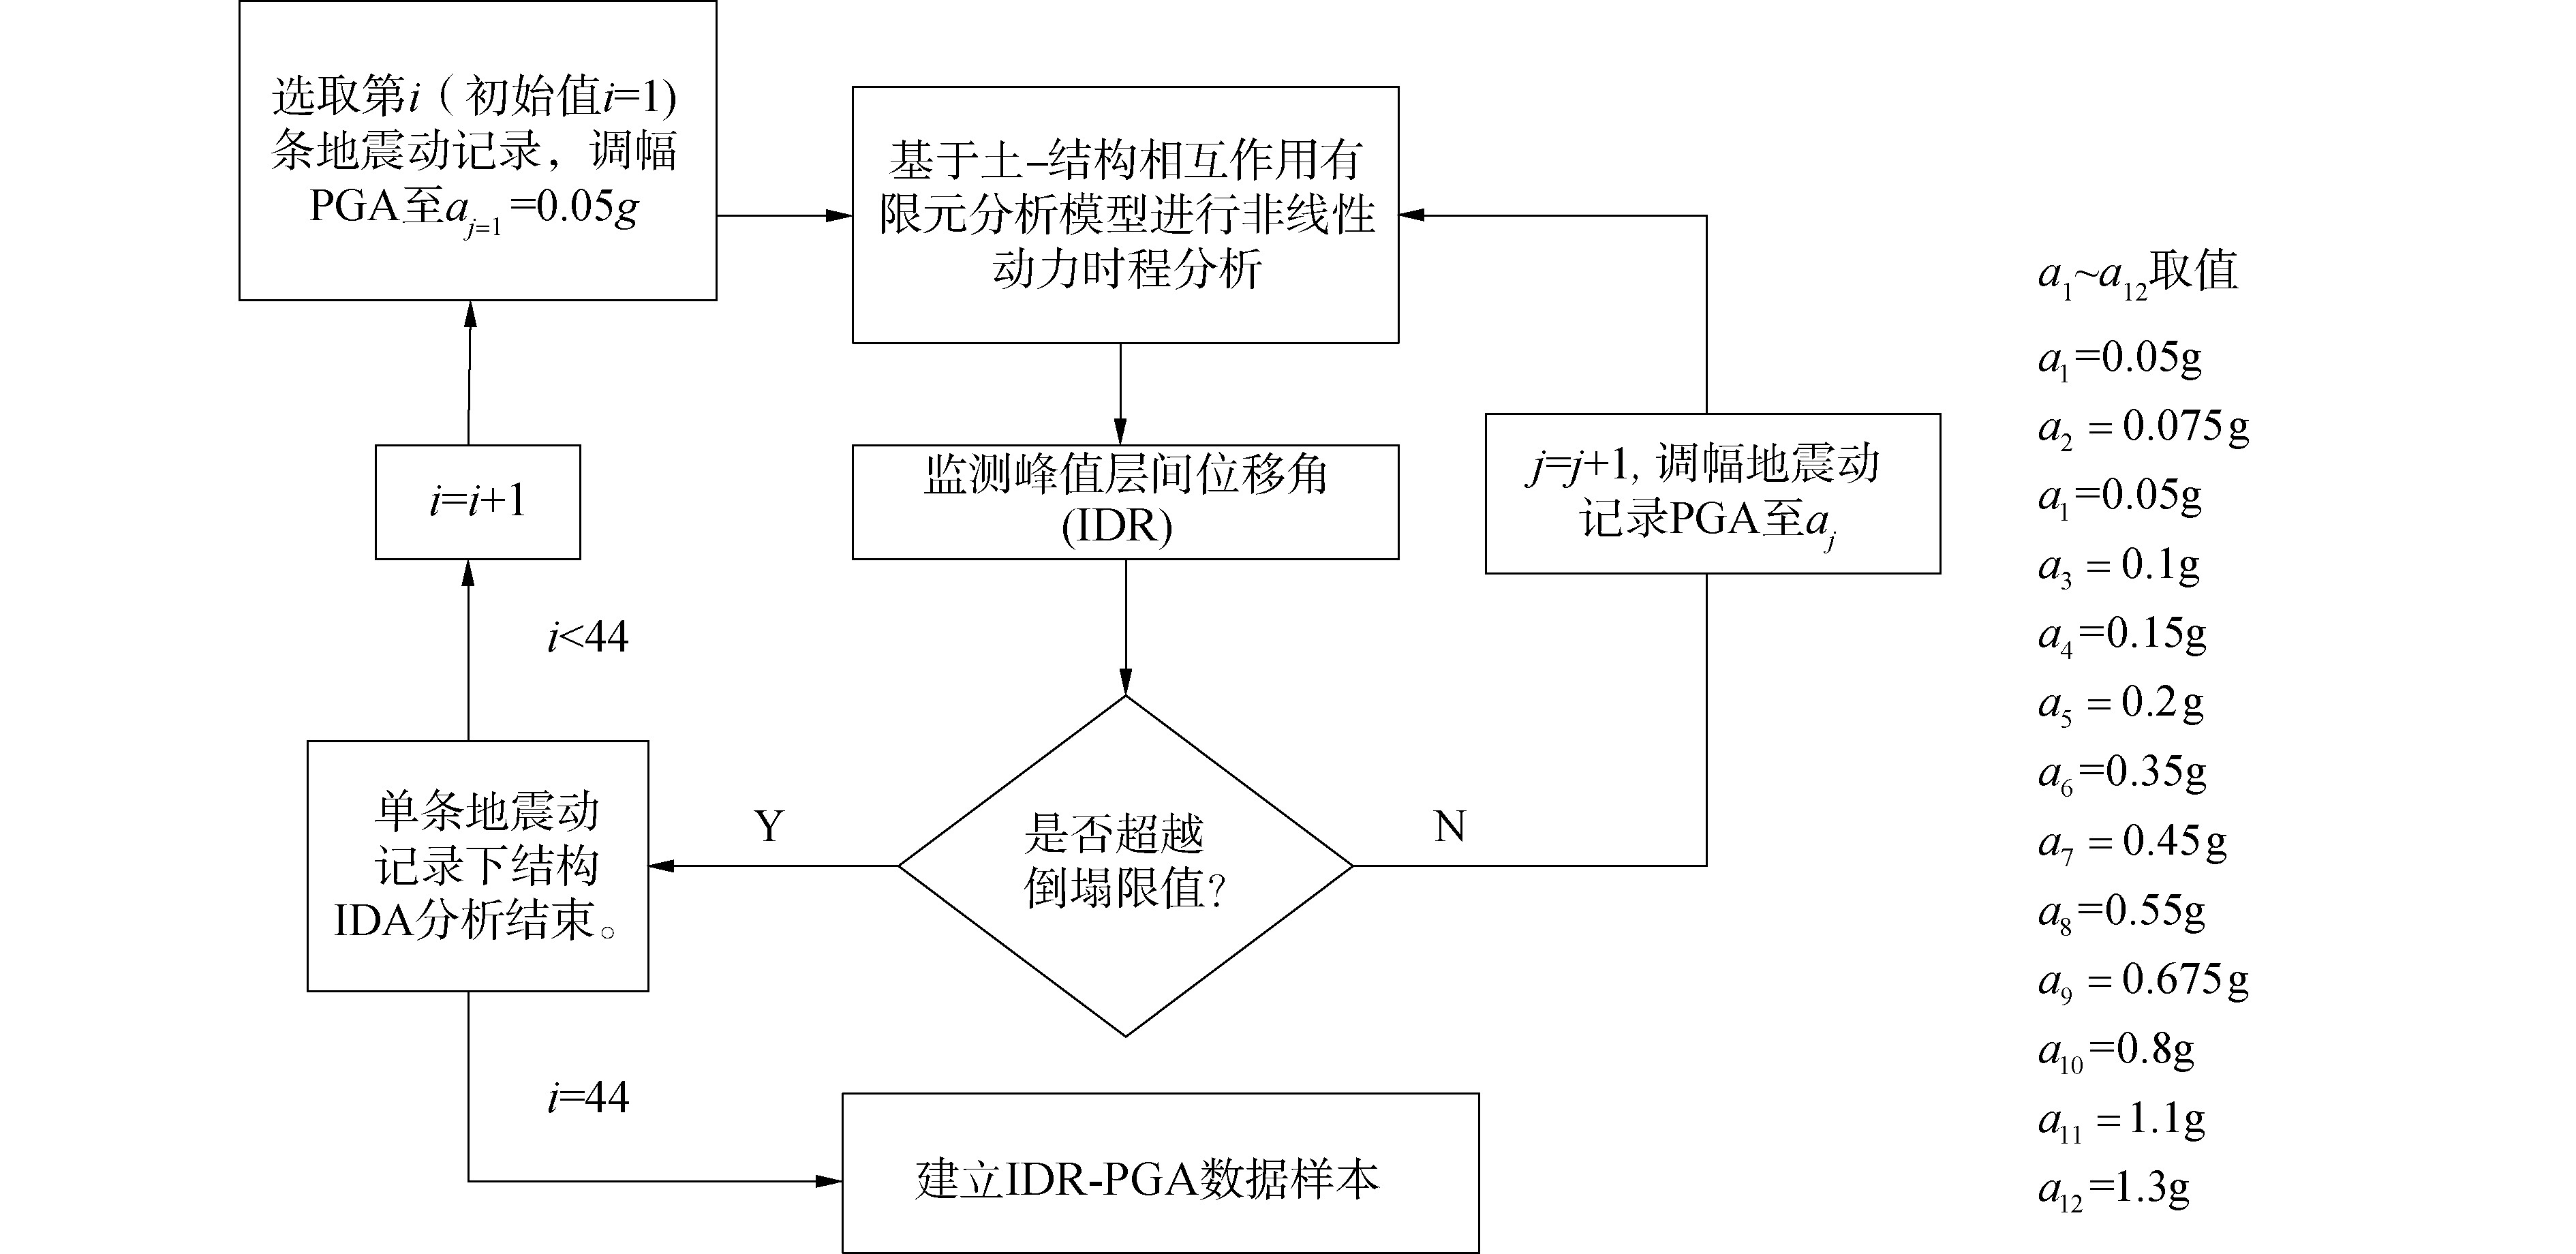 图 2 IDA方法的实施流程Fig. 2 The implementation process of the IDA method下载:
全尺寸图片
图 2 IDA方法的实施流程Fig. 2 The implementation process of the IDA method下载:
全尺寸图片
1) 选取拟输人的地震动记录$i(i=1)$, 基于$I_{\mathrm{PGA}}$调幅至$a_{\mathrm{j}=1}=0.05 \mathrm{~g}$, 进行土一地下结构体系非线性动力时程分析, 获取峰值层间位移角。
2) 若峰值层间位移角小于地下结构的倒塌极限, 进人3)。若峰值层间位移角大于地下结构的倒塌极限, 返回1), 对下一条拟输人的地震动记录$(i=i+1)$重复1$)$的过程; 当$i=N(N$为所选取地震动总条数) 时, 即计算完成。
3) 令$j=j+1$, 基于$I_{\mathrm{PGA}}$调幅至$a_{j}+1$, 例如, $a_{j+1}=0.1 \mathrm{~g}$, 再次进行土- 地下结构体系非线性动力时程分析, 并获取结构峰值层间位移角, 返回2)。
4) 确定峰值层间位移角的估计均值以及标准差。参考云图法,假设结构响应与地震动强度参数自然对数之间服从线性关系,采用线性回归拟合得到结构的响应均值与标准差。
2. 算例概括
2.1 工程背景
为对比研究基于云图法与IDA法所建立的地下结构地震易损性曲线。本文选取北京4号线某浅埋地铁车站结构为研究对象,如图 3所示,车站的横断面为2层双跨矩形框架形式,其断面整体尺寸为20.9 m×13.8 m(长×高),中柱截面为1 m×1.1 m, 侧墙厚度0.7 m,顶板厚度0.8 m,底板厚度0.7 m。结构中柱混凝土强度为C50,其他主体部分混凝土强度为C40,钢筋型号为HRB335。车站顶板埋深2 m,周边土层分布及其基本物理力学性质见表 1,主要由砂土、黏土和粉土构成。
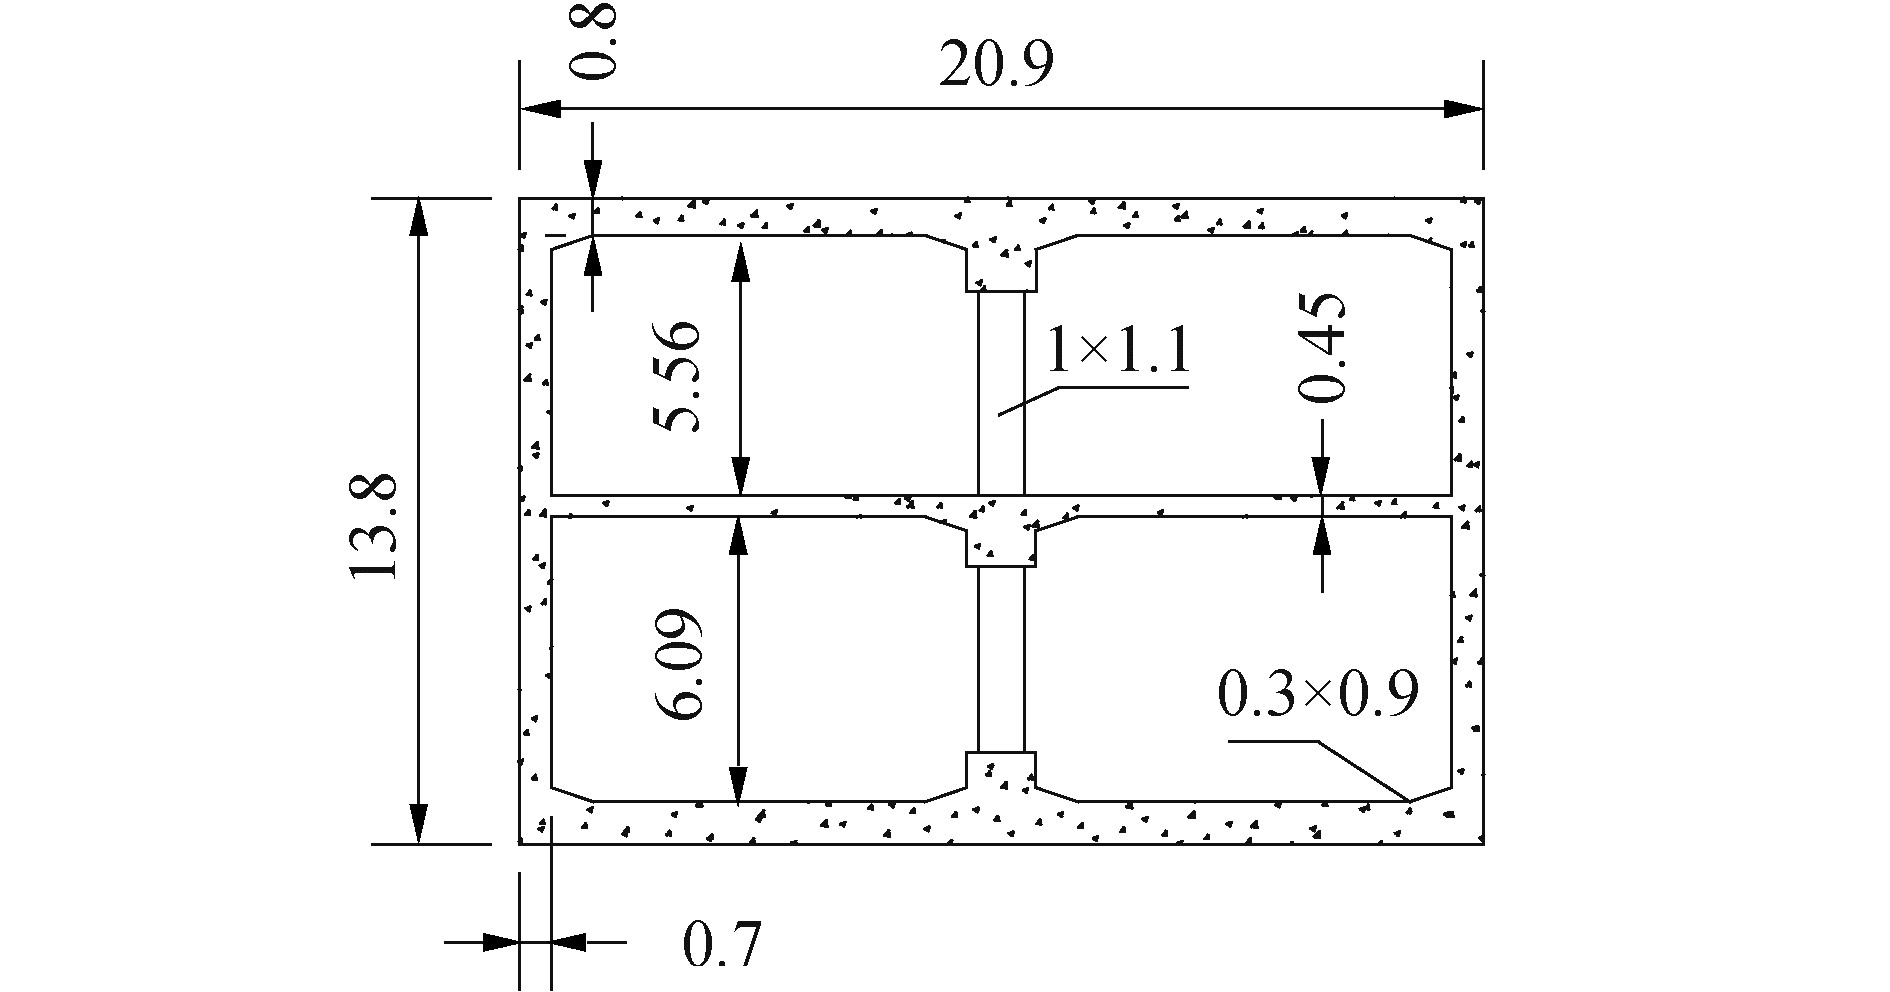 图 3 典型车站断面尺寸信息(单位:m)Fig. 3 The dimension information of typical subway station cross-section(Unit: m)下载:
全尺寸图片
表 1 岩土物理力学参数Table 1 The parameters of soil physical and mechanical
图 3 典型车站断面尺寸信息(单位:m)Fig. 3 The dimension information of typical subway station cross-section(Unit: m)下载:
全尺寸图片
表 1 岩土物理力学参数Table 1 The parameters of soil physical and mechanical编号 类型 厚度/m 密度/(kg/m3) 剪切波速/(m/s) 泊松比 1 回填土 2 1 700 147 0.35 2 粉土 6 2 020 190 0.35 3 黏土 7 2 000 193 0.36 4 砂土 2 2 050 274 0.33 5 黏土 10 2 020 300 0.36 6 砂土 3 2 050 328 0.33 7 黏土 2 1 990 331 0.36 8 砂土 6 2 050 368 0.33 9 粉土 7 2 000 382 0.35 10 基岩 - 2 500 700 0.25 2.2 有限元模型
如图 4所示,为基于ABAQUS/Standard[25]软件平台建立考虑土-结构相互作用的二维有限元模型,模型长度取车站横断面宽度5倍或以上,模型深度取至基岩面,共45 m。选用实体单元模拟土体,基于改进的Davidenkov骨架曲线的non-Masing本构模型描述岩土的动力非线性和滞回特性[26-27]。选用梁单元模拟结构混凝土构件,采用塑形损伤本构描述结构在地震动荷载作用下的受拉-压力学行为[28-29]。选用桁架单元模拟钢筋,通过关键字*rebar定义在梁单元中,采用理想弹塑性本构模拟钢筋的力学行为[30]。为保证网格单元尺寸小于地震波长的1/10[31],全局尺寸取0.5 m,结构附近土体单元网格尺寸为0.25 m,结构与钢筋的单元网格尺寸均为0.25 m。为考虑土体与结构之间的动力相互作用,结构与土体接触面的径向采用硬接触,切向采用摩擦接触,其摩擦系数取0.4,这种假设已被广泛应用于地下结构地震数值分析方法的研究[32-34]。
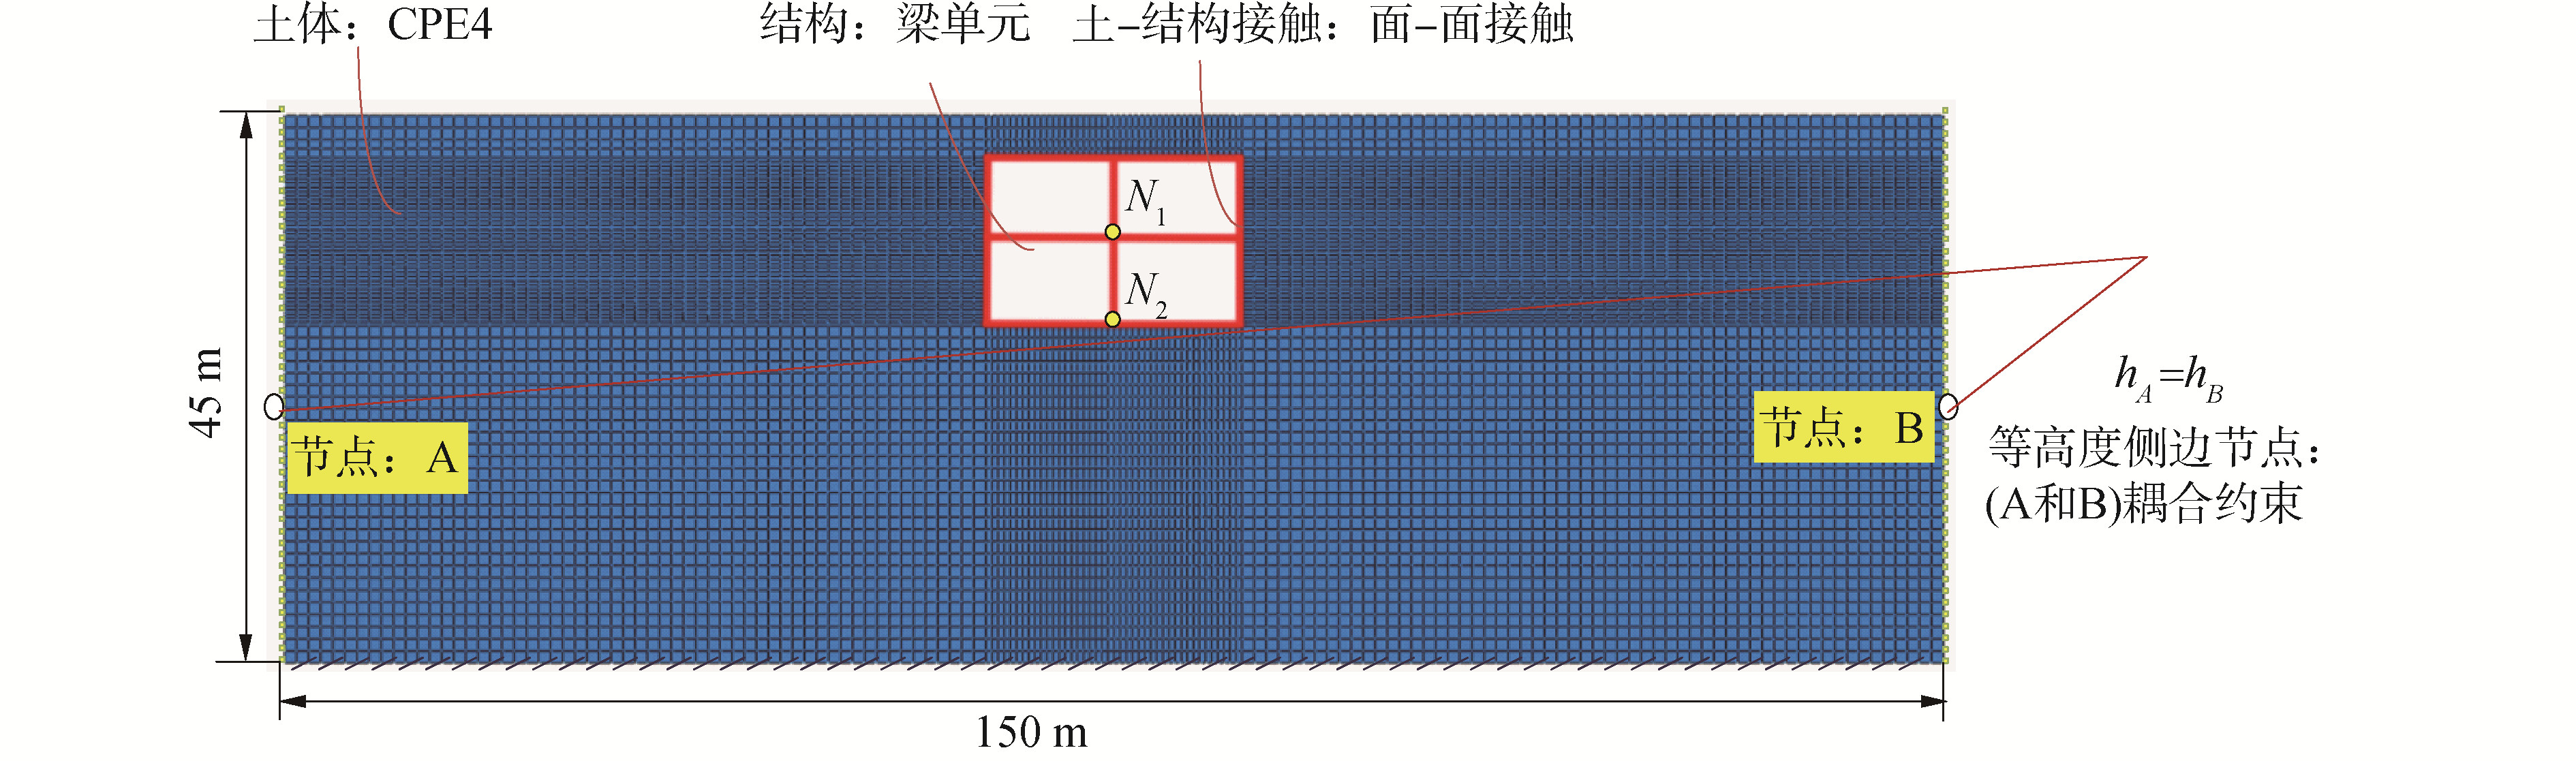 图 4 有限元分析模型示意Fig. 4 The diagram of the finite element analysis model下载:
全尺寸图片
图 4 有限元分析模型示意Fig. 4 The diagram of the finite element analysis model下载:
全尺寸图片
由于需要考虑初始地应力,本文数值模拟过程分为2步:1)重力荷载,设置模型底部固定,两侧边界仅放开竖向的自由度,完成重力荷载的分析后,提取边界支反力;2)输入地震动荷载,在1)分析的基础上,将模型两侧边界设置为捆绑边界[35-37],即对同一高度的侧边节点进行运动耦合约束;导入1)重力计算结果的支反力与地应力,完成模型的地应力平衡。由于模型底部边界已经延伸至基岩面,本文采用振动法输入地震动荷载。分析过程中监测结构下层中柱节点N1与N2(图 4)的位移时程曲线。
2.3 地震动记录
本文参考FEMA-P695报告[24],选取了22组远场地震动记录,共计44条加速度时程曲线,作为IDA方法的输入地震动荷载。基于PEER Ground Motion Database数据库[38]选取了251条远场地震动记录(包括IDA方法中的22条),共计502条加速度时程曲线作为云图法的输入地震动荷载,限于篇幅,这里仅列出上述地震动记录的加速度反应谱,见图 5。
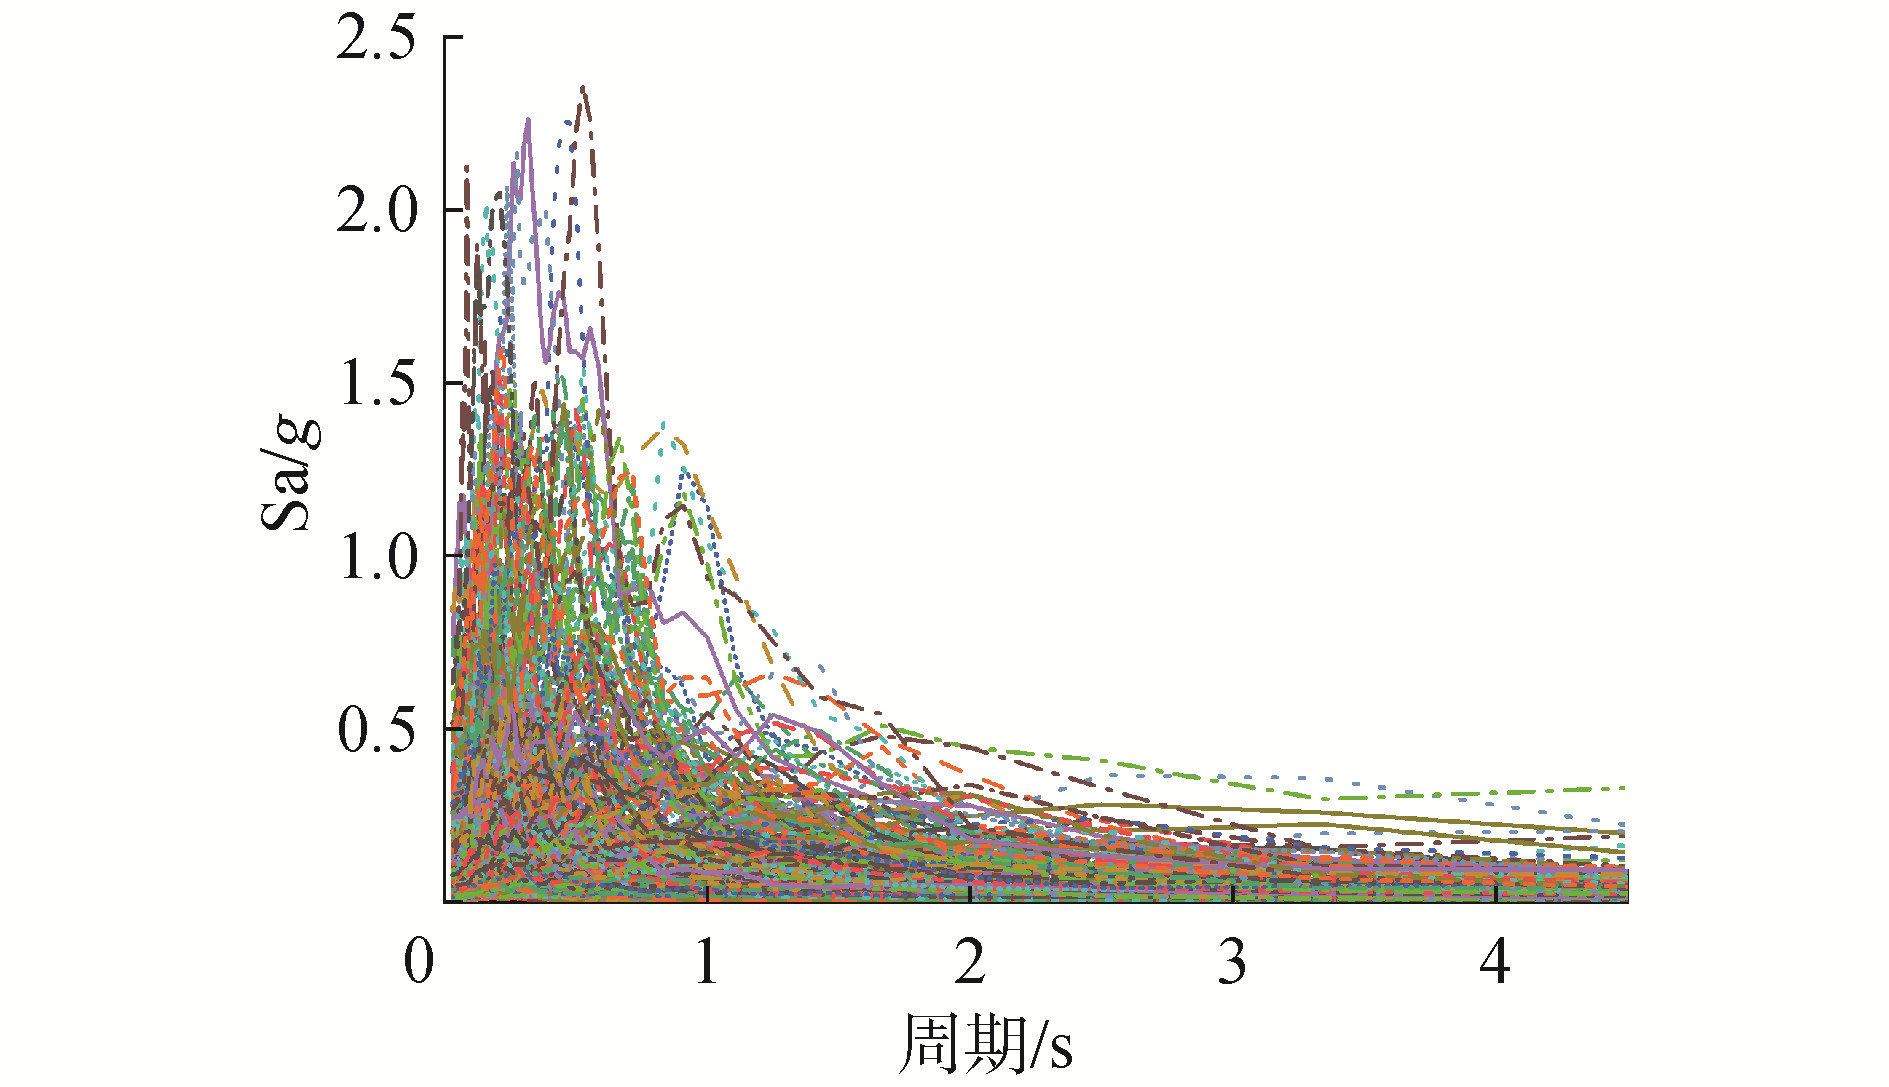 图 5 地震动记录加速度反应谱(阻尼比:5%)Fig. 5 Acceleration response spectra of seismic records (damping ratio 5%)下载:
全尺寸图片
图 5 地震动记录加速度反应谱(阻尼比:5%)Fig. 5 Acceleration response spectra of seismic records (damping ratio 5%)下载:
全尺寸图片
3. 计算结果
3.1 回归分析
基于所监测的$N_{1}$与$N_{2}$节点的位移时程曲线, 计算得到不同水平地震动强度作用下结构峰值层间位移角。为对比研究基于云图法与IDA方法所建立的结构概率地震需求模型, 基于式(2) 函数对$\hat{\theta}_{\mathrm{IDR}}-I_{\mathrm{PGA}}$的自然对数样本进行线性回归分析, 结果如下:
基于云图法分析所得到的回归模型:
$$ \ln (\mathrm{IDR})=1.11 \ln (\mathrm{PGA})+0.65 $$ (4) 基于IDA分析所得到的回归模型:
$$ \ln (\text { IDR })=1.06 \ln (\text { PGA })+0.6 $$ (5) 如图 6所示, 图中黑色散点为基于IDA方法计算结果, 红色散点为基于云图法计算结果, 所对应的黑实线与红实线分别为基于IDA方法与云图法的数据回归所得。由图 6可以发现, 黑色实线与红色实线具有很高的重合度, 这说明基于IDA方法与云图法所得到的$\hat{\theta}_{\mathrm{IDR}}-I_{\mathrm{PGA}}$对数线性回归模型基本一致。此外, 基于IDA方法所得到的$\hat{\theta}_{\mathrm{IDR}}$标准差为0.35, 而基于云图法所得到的$\hat{\theta}_{\mathrm{IDR}}$标准差为0.49, 这说明基于2种方法所得到的$\hat{\theta}_{\mathrm{IDR}}$离散性具有一定的差异性。进一步观察图 6可以发现, 基于云图法所得到的红色散点相当数量分布于地震动强度相对较小的区域, 而在高强度地震动坐标仅有少数样本数据, 相比于云图法, IDA方法所得到的数据样本分布则相对均匀。这主要归因于2种方法基于不同地震记录输人的结果, 后续地震易损性曲线的对比研究将对该问题作进一步阐述。
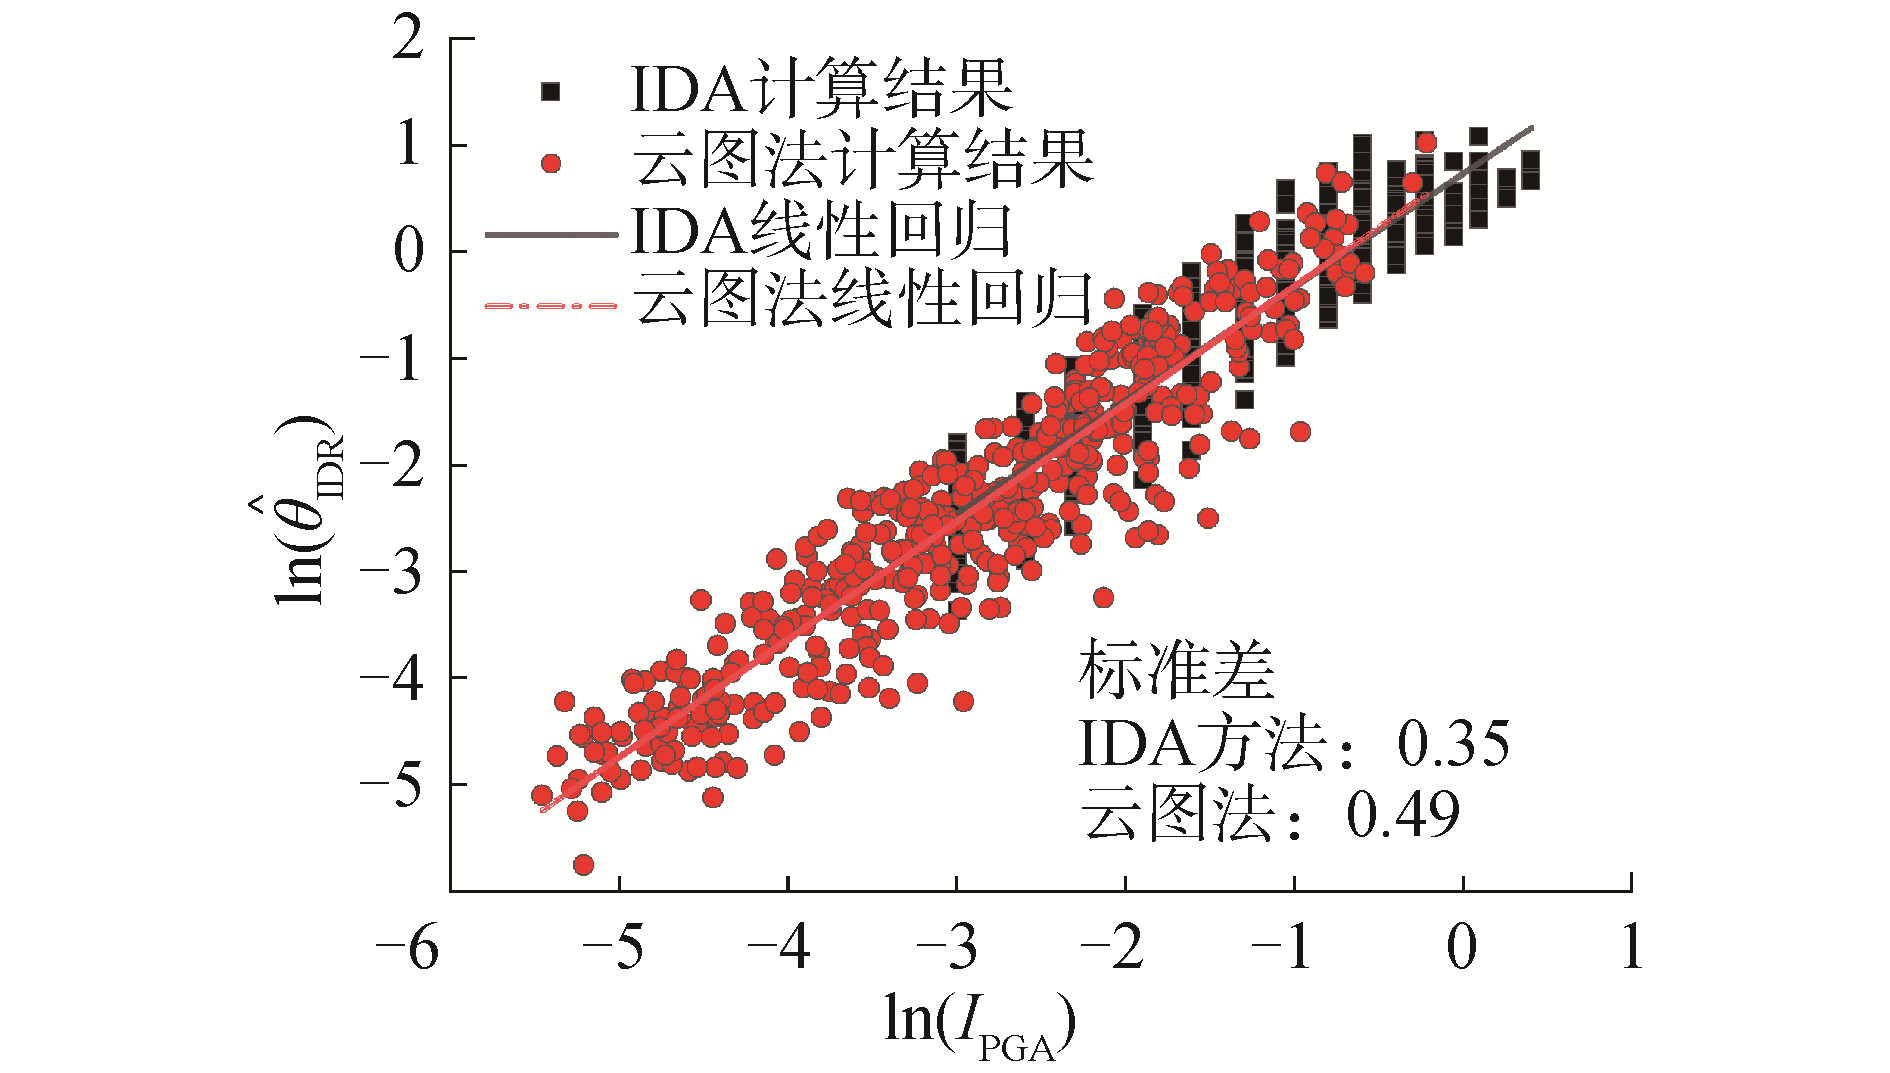 图 6 基于不同方法计算所得数据样本的线性回归模型Fig. 6 Linear regression model based on data samples generated from different analysis methods下载:
全尺寸图片
图 6 基于不同方法计算所得数据样本的线性回归模型Fig. 6 Linear regression model based on data samples generated from different analysis methods下载:
全尺寸图片
3.2 地震易损性曲线
地震易损性曲线的建立不仅需要确定结构的概率地震需求模型, 还需要建立结构的损伤模型, 即定义抗震性能指标。Du等[39]结合地铁工程在城市生态环境中的重要地位, 对地铁车站结构的震后性能水准进行了划分, 并基于层间位移角建立了具有概率统计意义的地下框架结构抗震性能指标限值, 因此, 本文引用该文献所建立的层间位移角限值为损伤指标, 见表 2。此外, 参考FEMA-P695报告[24], 式(1) 中结构与分析模型的不确定系数分别取$\beta_{C}=0.3, \beta_{\mathrm{MDL}}=0.2$。
表 2 矩形框架地铁地下结构性能水准定义Table 2 Definition of structural performance level of shallow rectangular subway station性能水准 功能状态 定性描述 层间位移角限值/% 1 正常使用 主体与非主体结构没有损伤,设备功能完好,能够正常运行。 0.08 2 可以使用 地铁地下抗震关键构件基本完好,设备功能完好,可以正常运行。 0.29 3 修复后使用 地铁地下抗震关键构件发生中度损伤,设备功能整体正常,经修复后可以正常运行。 0.62 4 不能使用 地铁地下抗震关键构件发生不可修复的严重破坏,设备功能失常。 0.96 如图 7所示, 为结构基于云图法与IDA方法所得到的地震易损性曲线。受限于原始地震动记录信息的不足, 基于云图法的地震易损性曲线仅给出了结构在地震动强度$I_{\mathrm{PGA}}$小于$0.5 \mathrm{~g}$以下的失效概率。相比于云图法, 得益于调幅的优势, 基于IDA方法计算的地震易损性曲线给出了任意地震动强度水平作用下结构的失效概率。由图 7可知, 2条曲线具有高度的重合性, 由此说明基于云图法与IDA方法建立的地震易损性曲线非常接近。例如, 当输人地震动强度$I_{\mathrm{PGA}}=0.05 \mathrm{~g}$, 基于云图法的计算所得到的地下框架结构性能水准1的失效概率为$50 \%$, 而基于IDA方法计算得到的地下框架结构性能水准1的失效概率为$52 \%$; 当所输人的地震动强度$I_{\mathrm{PGA}}$等于$0.4 \mathrm{~g}$时, 结构基于云图法与IDA方法的计算得到的性能水准3的失效概率分别为$67 \%$与$72 \%$。以上结果表明基于云图法与IDA方法的地震易损性分析结果是一致的。为进一步阐述基于2种方法地震易损性分析评估结果的差异, 定义参数$\Delta_{p}$为2种方法计算结构失效概率的绝对差值, 即:
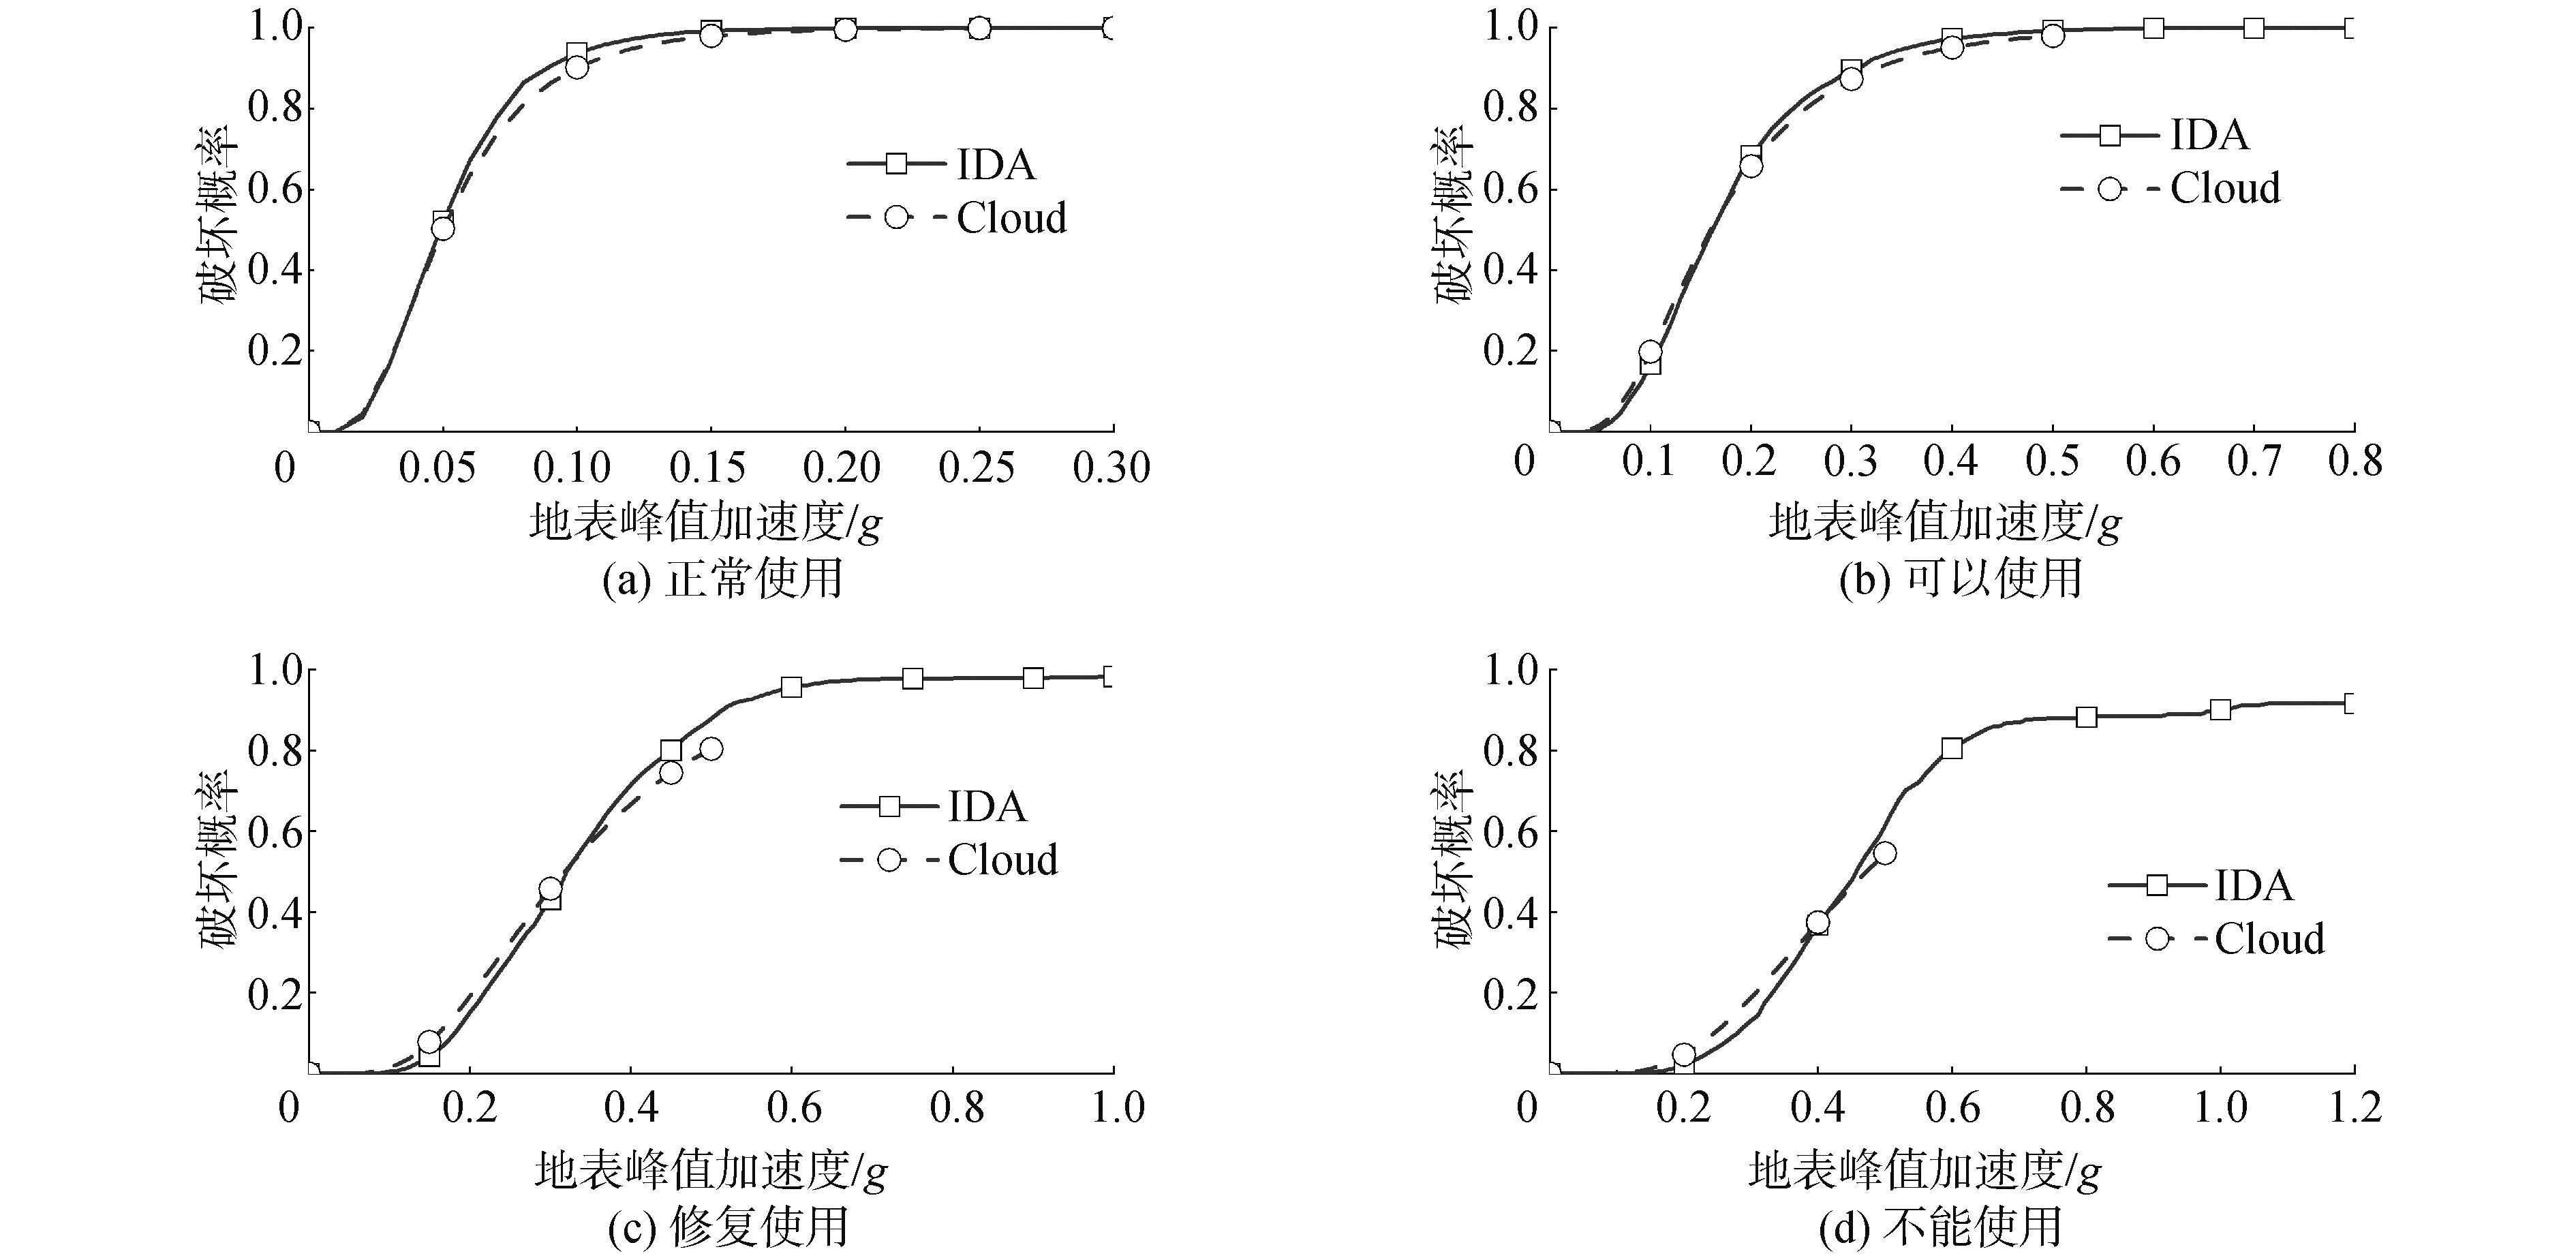 图 7 基于云图法与IDA方法的地震易损性曲线对比Fig. 7 The comparison of seismic fragility curves based on the method of cloud and IDA下载:
全尺寸图片
图 7 基于云图法与IDA方法的地震易损性曲线对比Fig. 7 The comparison of seismic fragility curves based on the method of cloud and IDA下载:
全尺寸图片
$$ \Delta_{p}=\left|\mathrm{P}_{\mathrm{IDA}}-\mathrm{P}_{\text {cloud }}\right| $$ (6) 式中: $\Delta_{P}$失效概率的绝对差值; $P_{\mathrm{IDA}}$为基于IDA方法所得到的结构失效概率; $P_{\text {cloud }}$为基于云图法所得到的结构失效概率。
如图 8所示,基于2种方法在不同性能水准的最大Δp分别为:性能水准1-正常使用为5.5%,性能水准2-可以使用为3.6%,性能水准3-修复后使用为7.5,性能水准4-不能使用为7%。可以看出,随着评估的性能水准等级逐渐递增,基于云图法与IDA方法的结构失效概率之间的差异会逐渐增大。但总体而言,基于云图法与IDA方法计算所得到的结构失效概率非常接近,其概率绝对误差最大值仅为7.5%。相比于地震动记录与结构模型中不确定性所带来的影响,上述差异在工程中基本可以忽略不计。
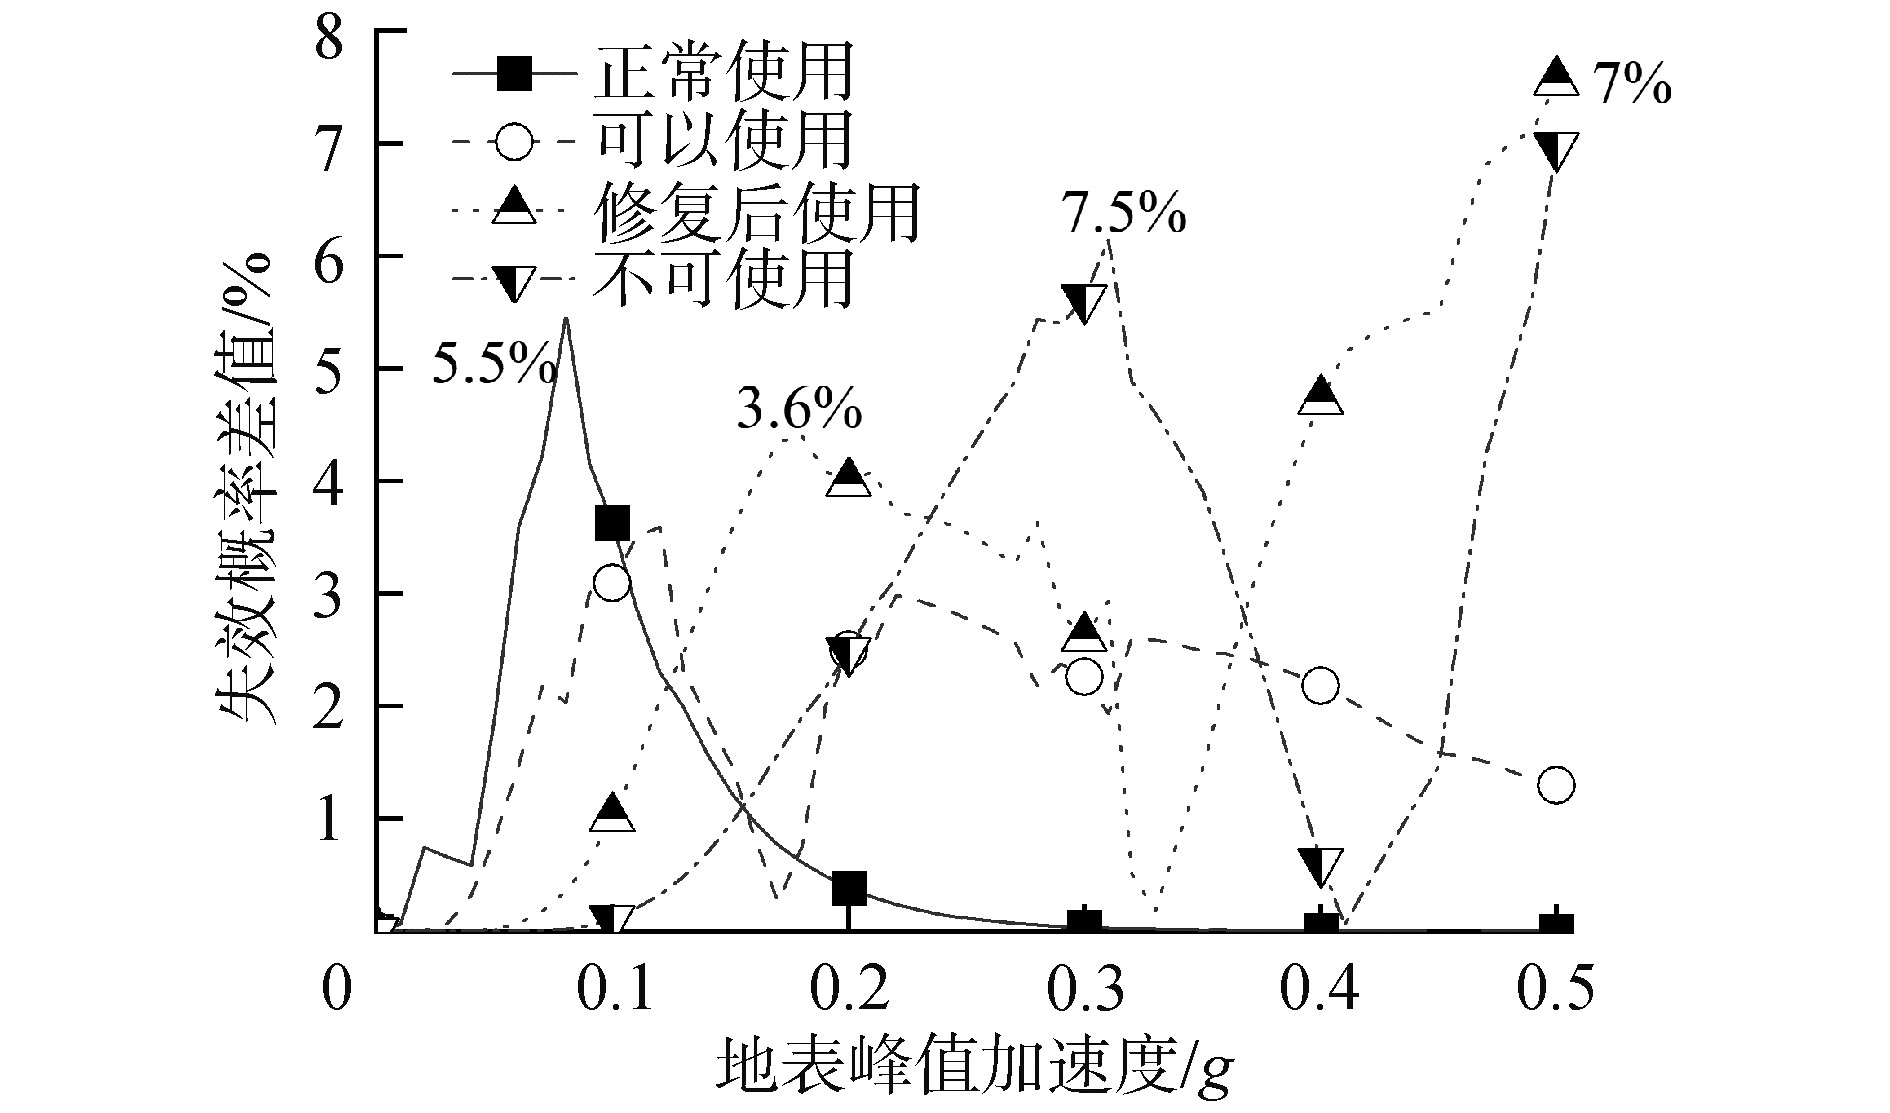 图 8 失效概率差值计算结果Fig. 8 The calculation result of difference of failure probability下载:
全尺寸图片
图 8 失效概率差值计算结果Fig. 8 The calculation result of difference of failure probability下载:
全尺寸图片
综上所述,基于云图法与IDA方法所得到地铁车站的层间位移角线性回归模型基本一致,虽然计算所得到的层间位移角标准差具有一定的差异性,但基于云图法与IDA方法计算的结构震后功能失效概率非常接近,最大绝对误差仅为7.5%。
4. 结论
1) 基于云图法:采用非线性动力时程分析方法获得了车站结构在502条远场原始地震动荷载作用下结构的峰值层间位移角;基于IDA方法:选取44条远场地震动加速度时程曲线,并基于PGA进行调幅,采用非线性动力时程分析方法获得了车站结构在调幅后地震动作用下的峰值层间位移角。采用最小二乘法原理,对分析所得到的层间位移角-PGA数据样本进行了回归分析,并在此基础上分别建立了基于云图法与IDA方法的结构地震易损性曲线。
2) 基于云图法与IDA方法得到的线性回归分析模型非常接近,即采用2种方法所预测的结构峰值层间位移角响应均值基本相等,但基于2种方法计算的层间位移角的标准差具有一定的差异。进一步的地震易损性曲线对比结果表明:基于云图法与IDA方法所所预测的地铁车站结构地震易损性曲线吻合度较好,两者误差随着待评估性能水准的递增而增加,但所预测的失效概率最大差异仅为7.5%,与地震动记录本身或其他工程参数所引起的不确定性相比,该差异基本可以忽略。
3) 由于受到地震波记录选取的限制,基于云图法的地下结构地震易损性分析仅能评估结构在相对较小地震动强度作用下的失效概率,得益于调幅的优势,IDA方法的评估范围则不受限制。
-
图 1 地震动作用下结构的“云”响应(对数坐标)
Fig. 1 Cloud response of structure under ground motion excitation (logarithmic coordinate)
下载:
全尺寸图片
图 2 IDA方法的实施流程
Fig. 2 The implementation process of the IDA method
下载:
全尺寸图片
图 3 典型车站断面尺寸信息(单位:m)
Fig. 3 The dimension information of typical subway station cross-section(Unit: m)
下载:
全尺寸图片
图 4 有限元分析模型示意
Fig. 4 The diagram of the finite element analysis model
下载:
全尺寸图片
图 5 地震动记录加速度反应谱(阻尼比:5%)
Fig. 5 Acceleration response spectra of seismic records (damping ratio 5%)
下载:
全尺寸图片
图 6 基于不同方法计算所得数据样本的线性回归模型
Fig. 6 Linear regression model based on data samples generated from different analysis methods
下载:
全尺寸图片
图 7 基于云图法与IDA方法的地震易损性曲线对比
Fig. 7 The comparison of seismic fragility curves based on the method of cloud and IDA
下载:
全尺寸图片
图 8 失效概率差值计算结果
Fig. 8 The calculation result of difference of failure probability
下载:
全尺寸图片
表 1 岩土物理力学参数
Table 1 The parameters of soil physical and mechanical
编号 类型 厚度/m 密度/(kg/m3) 剪切波速/(m/s) 泊松比 1 回填土 2 1 700 147 0.35 2 粉土 6 2 020 190 0.35 3 黏土 7 2 000 193 0.36 4 砂土 2 2 050 274 0.33 5 黏土 10 2 020 300 0.36 6 砂土 3 2 050 328 0.33 7 黏土 2 1 990 331 0.36 8 砂土 6 2 050 368 0.33 9 粉土 7 2 000 382 0.35 10 基岩 - 2 500 700 0.25 表 2 矩形框架地铁地下结构性能水准定义
Table 2 Definition of structural performance level of shallow rectangular subway station
性能水准 功能状态 定性描述 层间位移角限值/% 1 正常使用 主体与非主体结构没有损伤,设备功能完好,能够正常运行。 0.08 2 可以使用 地铁地下抗震关键构件基本完好,设备功能完好,可以正常运行。 0.29 3 修复后使用 地铁地下抗震关键构件发生中度损伤,设备功能整体正常,经修复后可以正常运行。 0.62 4 不能使用 地铁地下抗震关键构件发生不可修复的严重破坏,设备功能失常。 0.96 -
[1] DOWDING C H, ROZAN A. Damage to rock tunnels from earthquake shaking[J]. Journal of the geotechnical engineering division, 1978, 104(2): 175-191. doi: 10.1061/AJGEB6.0000580 [2] UENISHI K, SAKURAI S. Characteristic of the vertical seismic waves associated with the 1995 Hyogo-Ken Nanbu (Kobe), Japan earthquake estimated from the failure of the Daikai Underground Station[J]. Earthquake engineering & structural dynamics, 2000, 29(6): 813-821. [3] IIDA H, HIROTO T, YOSHIDA N, et al. Damage to Daikai subway station[J]. Soils and foundations, 1996, 36(Special): 283-300. doi: 10.3208/sandf.36.Special_283 [4] FEMA-P58-1. Seismic performance assessment of buildings (volume 1-Methodology)[R]. Washington, DC: Federal Emergency Management Agency 2018. [5] FEMA-P58-2. Seismic performance assessment of buildings (volume 1-Methodology)[R]. Washington, DC: Federal Emergency Management Agency, 2018. [6] 黄忠凯, 张冬梅. 地下结构地震易损性研究进展[J]. 同济大学学报(自然科学版), 2021, 49(1): 49-59, 115. https://www.cnki.com.cn/Article/CJFDTOTAL-TJDZ202101007.htm HUANG Zhongkai, ZHANG Dongmei. Recent advance in seismic fragility research of underground structures[J]. Journal of Tongji University (natural science), 2021, 49(1): 49-59, 115. https://www.cnki.com.cn/Article/CJFDTOTAL-TJDZ202101007.htm [7] ATC-40. Seismic evaluation and retrofit of existing concrete building[R]. Red Wood City, California: Applied Technology Council, 1996. [8] GHOSH S, GHOSH S, CHAKRABORTY S. Seismic fragility analysis in the probabilistic performance-based earthquake engineering framework: an overview[J]. International journal of advances in engineering sciences and applied mathematics, 2021, 13(1): 122-135. doi: 10.1007/s12572-017-0200-y [9] JALAYER F, DE RISI R, MANFREDI G. Bayesian cloud analysis: efficient structural fragility assessment using linear regression[J]. Bulletin of earthquake engineering, 2015, 13(4): 1183-1203. doi: 10.1007/s10518-014-9692-z [10] JALAYER F, EBRAHIMIAN H, MIANO A. Record-to-record variability and code-compatible seismic safety-checking with limited number of records[J]. Bulletin of earthquake engineering, 2021, 19(15): 6361-6396. doi: 10.1007/s10518-020-01024-6 [11] 于晓辉, 吕大刚. 基于云图-条带法的概率地震需求分析与地震易损性分析[J]. 工程力学, 2016, 33(6): 68-76. https://www.cnki.com.cn/Article/CJFDTOTAL-GCLX201606009.htm YU Xiaohui, LYU Dagang. Probabilistic seismic demand analysis and seismic fragility analysis based on a cloud-stripe method[J]. Engineering mechanics, 2016, 33(6): 68-76. https://www.cnki.com.cn/Article/CJFDTOTAL-GCLX201606009.htm [12] VAMVATSIKOS D, CORNELL C A. Seismic performance, capacity and reliability of structures as seen through incremental dynamic analysis[D]. CA, USA: Stanford University Stanford, 2002. [13] VAMVATSIKOS D, CORNELL C A. Applied incremental dynamic analysis[J]. Earthquake spectra, 2004, 20(2): 523-553. doi: 10.1193/1.1737737 [14] ESTEKANCHI H, VAFAEI A, AZAR M S. Endurance time method for seismic analysis and design of structures[J]. Scientia iranica, 2004, 11(4): 361-70. [15] 白久林, 杨乐, 欧进萍. 结构抗震分析的耐震时程方法[J]. 地震工程与工程振动, 2014, 34(1): 8-18. https://www.cnki.com.cn/Article/CJFDTOTAL-DGGC201401004.htm BAI Jiulin, YANG Le, OU Jinping. The endurance time method for seismic response analyses of building structures[J]. Earthquke engineering and engineering dynamics, 2014, 34(1): 8-18. https://www.cnki.com.cn/Article/CJFDTOTAL-DGGC201401004.htm [16] 陈之毅, 黄鹏飞. 基于概率神经网络的地铁车站易损性分析[J]. 同济大学学报(自然科学版), 2021, 49(6): 791-798. https://www.cnki.com.cn/Article/CJFDTOTAL-TJDZ202106004.htm CHEN Zhiyi, HUANG Pengfei. Fragility analysis of a subway station based on probability artificial neural network[J]. Journal of Tongji University (natural science), 2021, 49(6): 791-798. https://www.cnki.com.cn/Article/CJFDTOTAL-TJDZ202106004.htm [17] 许民泽, 崔春义, 李静波, 等. 饱和砂土场地中地铁车站结构地震易损性分析[J]. 工程力学, 2021, 38(S1): 251-258. https://www.cnki.com.cn/Article/CJFDTOTAL-GCLX2021S1037.htm XU Minze, CUI Chunyi, LI Jingbo, et al. Seismic vulnerability analysis of subway station embedded in saturated sand layers[J]. Engineering mechanics, 2021, 38(S1): 251-258. https://www.cnki.com.cn/Article/CJFDTOTAL-GCLX2021S1037.htm [18] 钟紫蓝, 严智豪, 史跃波, 等. 基于IDA方法的地铁车站结构抗震性能评价[J]. 北京工业大学学报, 2021, 47(7): 680-690. https://www.cnki.com.cn/Article/CJFDTOTAL-BJGD202107003.htm ZHONG Zilan, YAN Zhihao, SHI Yuebo, et al. Seismic performance evaluation of station structures based on IDA method[J]. Journal of Beijing University of Technology, 2021, 47(7): 680-690. https://www.cnki.com.cn/Article/CJFDTOTAL-BJGD202107003.htm [19] 钟紫蓝, 甄立斌, 申轶尧, 等. 基于耐震时程分析法的地下结构抗震性能评价[J]. 岩土工程学报, 2020, 42(8): 1482-1490. https://www.cnki.com.cn/Article/CJFDTOTAL-YTGC202008019.htm ZHONG Zilan, ZHEN Libin, SHEN Yiyao, et al. Seismic performance evaluation of underground structures using endurance time analysis[J]. Chinese journal of geotechnical engineering, 2020, 42(8): 1482-1490. https://www.cnki.com.cn/Article/CJFDTOTAL-YTGC202008019.htm [20] HUANG Zhongkai, PITILAKIS K, TSINIDIS G, et al. Seismic vulnerability of circular tunnels in soft soil deposits: the case of Shanghai metropolitan system[J]. Tunnelling and underground space technology, 2020, 98: 103341. [21] JIANG Jiawei, EL NGGAR H M, XU Chengshun, et al. Effect of ground motion characteristics on seismic fragility of subway station[J]. Soil dynamics and earthquake engineering, 2021, 143: 106618. [22] KWON S Y, YOO M, HONG S. Earthquake risk assessment of underground railway station by fragility analysis based on numerical simulation[J]. Geomechanics and engineering, 2020, 21(2): 143-152. [23] ZHUANG Haiyang, YANG Jing, CHEN Su, et al. Statistical numerical method for determining seismic performance and fragility of shallow-buried underground structure[J]. Tunnelling and underground space technology, 2021, 116: 104090. [24] FEMA-P695. Quantifcation of building seismic performance factors[R]: Federal Emergency Management Agency, 2009. [25] MANUAL A U. Abaqus user manual[EB/OL]. Providence USA, Simulia Corp. 2018. https://simulation.technia.com/files/simulia-abaqus-2018-documentation/ . [26] 赵丁凤, 阮滨, 陈国兴, 等. 基于Davidenkov骨架曲线模型的修正不规则加卸载准则与等效剪应变算法及其验证[J]. 岩土工程学报, 2017, 39(5): 888-895. https://www.cnki.com.cn/Article/CJFDTOTAL-YTGC201705018.htm ZHAO Dingfeng, RUAN Bin, CHEN Guoxing, et al. Validation of modified irregular loading-unloading rules based on Davidenkov skeleton curve and its equivalent shear strain algorithm implemented in ABAQUS[J]. Chinese journal of geotechnical engineering, 2017, 39(5): 888-895. https://www.cnki.com.cn/Article/CJFDTOTAL-YTGC201705018.htm [27] CHEN Guoxing, WANG Yanzhen, ZHAO Dingfeng, et al. A new effective stress method for nonlinear site response analyses[J]. Earthquake engineering & structural dynamics, 2021, 50(6): 1595-1611. [28] HILLERBORG A, MODÉER M, PETERSSON P E. Analysis of crack formation and crack growth in concrete by means of fracture mechanics and finite elements[J]. Cement and concrete research, 1976, 6(6): 773-781. [29] LEE J, FENVES G L. Plastic-damage model for cyclic loading of concrete structures[J]. Journal of engineering mechanics, 1998, 124(8): 892-900. [30] BESSELING J F. A theory of elastic, plastic, and creep deformations of an initially isotropic material showing anisotropic strain-hardening, creep recovery, and secondary creep[J]. Journal of applied mechanics, 1958, 25(4): 529-536. [31] 廖振鹏, 刘晶波. 离散网格中的弹性波动(Ⅰ)[J]. 地震工程与工程振动, 1986, 6(2): 1-16. https://www.cnki.com.cn/Article/CJFDTOTAL-DGGC199002000.htm LIAO Zhenpeng, LIU Jingbo. Elastic wave motion in discrete grids[J]. Earthquake engineering and engineering vibration, 1986, 6(2): 1-16. https://www.cnki.com.cn/Article/CJFDTOTAL-DGGC199002000.htm [32] XU Zigang, DU Xiuli, XU Chengshun, et al. Numerical research on seismic response characteristics of shallow buried rectangular underground structure[J]. Soil dynamics and earthquake engineering, 2019, 116: 242-252. [33] JIANG Jiawei, XU Chengshun, EL NAGGAR H M, et al. Improved pushover method for seismic analysis of shallow buried underground rectangular frame structure[J]. Soil dynamics and earthquake engineering, 2021, 140: 106363. [34] DU Xiuli, MA Chao, LU Dechun, et al. Collapse simulation and failure mechanism analysis of the Daikai subway station under seismic loads[J]. China civil engineering journal, 2017, 50(1): 53-62. [35] ARGYROUDIS S, TSINIDIS G, GATTI F, et al. Effects of SSI and lining corrosion on the seismic vulnerability of shallow circular tunnels[J]. Soil dynamics and earthquake engineering, 2017, 98: 244-256. [36] TSINIDIS G, PITILAKIS K, TRIKALIOTI A D. Numerical simulation of round robin numerical test on tunnels using a simplified kinematic hardening model[J]. Acta geotechnica, 2014, 9(4): 641-659. [37] HLEIBIEH J, WEGENER D, HERLE I. Numerical simulation of a tunnel surrounded by sand under earthquake using a hypoplastic model[J]. Acta geotechnica, 2014, 9(4): 631-640. [38] BAKER J W, LIN T, SHAHI S K, et al. New ground motion selection procedures and selected motions for the PEER transportation research program[R]. CA, University of California Berkeley, 2011. [39] DU Xiuli, JIANG Jiawei, EL NAGGAR M H, et al. Interstory drift ratio associated with performance objectives for shallow-buried multistory and span subway stations in inhomogeneous soil profiles[J]. Earthquake engineering & structural dynamics, 2021, 50(2): 655-672.