 2017, Vol. 60


2 Ore Deposit and Exploration Centre(ODEC), Hefei University of Technology, Hefei 230009, China;
3 Geological Survey of Anhui Province, Hefei 230001, China
Edge detection and enhancement techniques have been widely used in geophysical exploration, and have yielded important implications in revealing deep-lying geological structures, intrusions, and ore bodies.
Primary gravity-magnetic anomaly data cannot locate effectively geologic body distributions, but their maximum horizontal derivatives and the zero values of vertical derivatives commonly correspond to geologic boundaries. Vertical derivative was first used to delineate gravity-magnetic bodies by Evjen (1936), but early edge detection techniques could not show the boundaries of shallow-level and deep-level anomalies together. This is because derivatives of the anomalies drop steadily with depths, and thus deeper geologic boundaries cannot be clearly detected (Cordell, 1979; Nabighian, 1984; Blakely et al., 1986; Roest et al., 1992; Hsu, 1996). To solve this issue, i.e., to simultaneously and clearly distinguish deep-/shallow-level geologic boundaries, many previous researches were dedicated to equalize the edge detection filter. The first equalizing edge detection tilt angle method (Miller and Singh, 1994) could well equalize anomaly amplitudes of different intensities, but still could not clearly distinguish geologic boundaries. Rajagopalan and Milligan (1995) used automatic gain control techniques to equalize anomaly amplitudes of different intensities, the results of which are dependent on the choice of window sizes. The THDR method (Verduzco et al., 2004), which is based on the total horizontal derivatives of tilt angle, is susceptible to noise influence and could not reveal deep-level geologic boundaries satisfactorily.
The Theta method (Wijns et al., 2005), which equalizes the total horizontal derivatives via analyzing the signal amplitudes (Roest et al., 1992), has achieved satisfactory results, yet the boundaries delineated are diffused to some extent. Cooper and Cowan (2006) proposed an improvement on the tilt angle TDX method to identify the anomaly boundaries, whilst Cooper (2009) proposed the adoption of the Hilbert transform method for geologic boundary delineation, a method that analyzes signals and could clearly show the magnetic source boundaries. Ma et al.(2012, 2013, 2015) put forward the enhanced equalization and local phase filters for edge detection by integrating the different order horizontal derivatives. Li (2014) used the normalized total horizontal derivative method to obtain the horizontal location and depth of the anomalies. In recent years, works were reported concerning the edge detection by using the Gravity Gradient Tensor (GGT) data characteristics (Sertcelik and Kafadar, 2012; Zhou et al., 2013; Yuan et al., 2014, 2015; Yuan Y et al., 2015; Wang et al., 2015). Besides, multi-resolution edge detection based on wavelet analysis was also documented (Hornby et al., 1999; Yan et al., 2015). The advancement of equalization filter research above mentioned made it possible to delineate clearer deep-/shallow-level geologic boundaries.
In this study, we defined a new edge detection filter based on the Theta method, which effectively minimizes the diffusion in the detected deep-level boundaries produced by the latter. Our design can balance the deep-level and shallow-level boundaries, and can clearly distinguish geologic boundaries. We have designed two models, with one model including positive/negative anomalies and Gaussian noise to test the method's stability and edge detection results. We used the measured gravity-magnetic data in the Luzong (Lujiang-Zongyang) ore district of the MLYB as a case study.
2 AN IMPROVED THETA METHOD-BASED EQUALIZATION FILTER 2.1 Theta Map FilterRoest et al. (1992) indicated that the maximum amplitudes of analytical signals can be used to distinguish geologic boundaries. Analytical signals are expressed as

|
(1) |
where f is total intensity, 
From Eq.(1), the maximum amplitude of the analytical signals is
|
(2) |
As for the Theta method (Wijns et al., 2005), it can be expressed as
|
(3) |
i.e.:
|
(4) |
Theta map method is very effective in distinguishing deep-level geologic boundaries. However, the shallow-level geologic boundaries are clear and refined, whereas the deep-level ones are clear but diffuse. In this study, we resolved this issue of the Theta method by first obtaining the vertical 1st order partial derivative (fz) of the total intensity (f) of the potential field, and then determining the new Theta values based on the fz values.
The Theta1 defined here is

|
(5) |
In the formula the vertical 2nd order partial derivative (fzz) has enhanced the details of the Theta1 calculation results. From practical applications, we realized that excessive information would make geological interpretations difficult. Considering that fzx, fzy and fzz are relatively independent physical quantities, fzx and fzy are mainly used to distinguish the boundary on the x, y-axis, whilst the vertical 1st order derivative (fz) is used to replace the high-order fzz (divided by a multiple of sampling interval to equalize the physical quantity unit). This is defined as Theta2, which is expressed as

|
(6) |
where p is dimensionless quantity. After testing, we recognized that p = 0.05 ~ 5 yielded the best results (higher p values would reduce the equalization effect, whereas lower p values would make the boundary even finer). h is sampling interval of the gridded data, e.g., 0.5 km (1:50000 data) is used in this study.
2.3 Equations of the Theta Map Filterkx, ky of the wave-number domain are the wave-number in the x, y directions, respectively. The wave-number k is expressed as

|
(7) |
And the vertical 1st order partial derivative (f) is
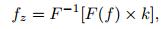
|
(8) |
fzx, fzy and fzz are expressed as
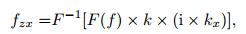
|
(9) |
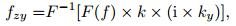
|
(10) |
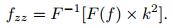
|
(11) |
From the above equations, it is indicated that kx, ky and k are determined by Fourier transformation of the measured horizontal potential field f (based on partial derivative and used the FFT calculation), multiplied by the corresponding wave-number, and then performing the inverse Fourier transformation (with the IFFT calculation) (Liu D J et al., 2009, 2012).
To prevent the Gibbs effect and data loss in the edge, it is necessary to perform edge extension to the raw data. In this study, we used the cosine edge extension method. To remove the high frequency interference in the frequency domain, we used least square smooth method.
Apart from the wave-number domain calculation procedure, we have also composed a corresponding spatial domain calculation procedure. Considering that direct deployment of high-order derivative calculation in the fzz spatial domain may increase noise interference, we used the horizontal derivatives and the following equation to calculate fzz :
|
(12) |
Programming and calculation of spatial domain is relatively complex and consumes more time, whereas that of wave-number domain is less complex and thus more efficient. Comparison of the calculation results in spatial and wave-number domains with model data by Theta1/Theta2 and the other methods used in this study showed good consistency. In general, the boundaries of the anomaly bodies can be accurately and clearly detected, and comparatively the spatial domain results contain less noise.
2.4 Filter ComparisonTo assess the edge detection results of our new filter, we compared our results with the Theta map (Wijns et al., 2005), THDR (Verduzco et al., 2004), TDX (Cooper and Cowan, 2006) and filters based on 3D gradient tensor (Yuan et al., 2015).
2.4.1 THDR and TDX methodsAs for the tilt angle filter defined by Miller and Singh (1994), it is expressed as
|
(13) |
Verduzco et al. (2004) proposed the THDR by calculating the T values again for the horizontal derivatives, which is expressed as
|
(14) |
Cooper and Cowan (2006) proposed the TDX by swapping the numerator and denominator of the T values, which is expressed as
|
(15) |
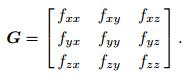
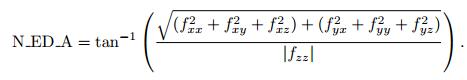
Zhou et al. (2013) and Yuan et al. (2015) have studied the 3D gradient tensor matrix of the potential field data, with the equation being
|
(16) |
According to Yuan et al. (2015), the N_ED_A (which yielded better results) is chosen for the comparison, which is expressed by
|
(17) |
A theoretic model was set up to assess our new edge detection method (Fig. 1). Assuming that there are four rectangular sources in a 100 km×100 km horizontal area, namely No.1 (0.5~1 km), No.2 (1.5~2 km), No.3 (2.5~3 km) and No.4 (3.5~4 km).

|
Fig. 1 Planar and 3D views of the synthetic model (a) Planar view; (b) 3D view. |
Take gravity model as an example, we considered two scenarios: (1) all the rectangles contain positive residual density (set to 0.3 g·cm-3). The gravity anomalies formed by this model is illustrated in Fig. 2a. (2) Rectangles No.1 and No.3 contain positive residual density (set to 0.3 g·cm-3) but rectangles No.2 and No.4 contain negative residual density (set to -0.3 g·cm-3), and a normal distributed random noise (3% anomalies peak values) is superimposed on the gravity anomalies. The gravity anomalies formed by this model is illustrated in Fig. 3a. The sampling intervals (h) of both models are set to 0.5 km.

|
Fig. 2 Comparison of results using different filters Synthetic gravity anomalies; (b) Theta map method; (c) THDR method; (d) TDX method; (e) N_ED_A of a method based on the 3D gradient tensor; (f) Theta1 method; (g) Theta2 method with p = 2. |

|
Fig. 3 Comparison of results using different filters (gravity data of synthetic model added by 3% Gaussian noise) Synthetic gravity anomalies; (b) Theta map method; (c) THDR method; (d) TDX method; (e) N_ED_A of method based on the 3D gradient tensor; (f) Theta1 method; (g) Theta2 method with p = 2. |
Based on the first scenario (i.e., all four rectangles contain positive residual density) and synthetic gravity anomaly data, we used the conventional Theta map, THDR, TDX and the N_ED_A methods, as well as the new Theta1 and Theta2 methods of this study to perform edge detection. The results are illustrated in Fig. 2.
The Theta edge detection results show that with the deepening of the rectangles No.1-No.4, the deep-level anomaly boundaries become coarser (Fig. 2b). The THDR results show distinct boundaries for the shallow-level anomalies, but the boundaries become blurred with increasing depths (Fig. 2c). The TDX results are more even and clearer, particularly for deep-level boundary (better than Theta) (Fig. 2d). The N_ED_A (based on 3D gradient tensor) results show relatively good balance in depth-/shallow-level anomalies, but the use of high-order partial derivative (fzz) has generated noise interference (Fig. 2e).
Compared to the Theta results, the Theta1 detected boundaries are more balanced, and the deep-level boundaries are finer (Fig. 2f). Because high-order partial derivative (fzz) was also adopted, noise interference was found in both Fig. 2e and Fig. 2f. Although both methods have generated noise interference, Theta1 shows more distinct boundary locations. To minimize the Theta1 noise interference, 1st order derivative (fz) (vertical) was used to replace high-order derivative (fzz) in the Theta2 method. The Theta2 edge detection results are shown in Fig. 2g. Compared with the results of other methods (Fig. 2b-2g), Theta2 is distinguished in producing balanced, clear and refined deep-/shallow-level boundaries and the minimization of interference.
To test the filter stability, we normalized the results of the various methods (Fig. 3).
All the Theta map, THDR, TDX and Theta2 methods created additional false boundaries. What is different is that the rectangular boundary detected by THDR is clearly covered by the noise, whereas that by Theta, TDX and Theta2 is clearly distinguishable despite the background noise. The boundary detected by Theta is the most diffused, whereas that by TDX is finer. We found that Theta2 generates the largest noise suppression area around the model. Its boundary locations are distinct under low background noise, and the boundary detected is finer than that by Theta and TDX. The high-order vertical partial derivative utilized by the N_ED_A and Theta1 have not generated other boundaries, yet the overall noise level is higher. These two methods (esp. Theta1) both magnify the noise interference and more clearly distinguish the boundary locations.
4 LUZONG ORE DISTRICT MAGNETIC-GRAVITY EDGE DETECTION 4.1 Geological BackgroundThe Luzong ore district is situated in the Middle-Lower Yangtze River faulted depression and the northern margin of the Yangtze plate, and bordered with the Qinling-Dabie orogen in its west. The Luzong district is one of the seven major ore districts of the MLYB (Chang et al., 1991; Zhai et al., 1992; Tang et al., 1998; Pan and Dong, 1999; Zhou et al., 2008, 2010; Yuan et al., 2008; Dong et al., 2010; Gao et al., 2010; Lü et al., 2014). The main part of the ore district is the NE-trending Luzong volcanic basin (60 km long, 1032 km2 in size) (Ren et al., 1993).
Exposed stratigraphy of the Luzong ore district includes mainly Silurian to Cretaceous and Quaternary rocks. Cambrian-Ordovician carbonates and clastics are mainly exposed in the Shengqiao-Donggushan area (northern part of the district), Silurian to Middle Triassic rocks are mainly exposed in the periphery of the Luzong volcanic basin, whilst stratigraphy exposed inside the basin comprises mainly Cretaceous continental volcanics. The basement of the basin consists of Middle Triassic to Middle Jurassic rocks. The Early Cretaceous volcanics in the Luzong basin (from old to young) are grouped into four volcanic cycles, namely Longmenyuan (134.8±1.8 Ma), Zhuanqiao (134.1±1.6 Ma), Shuangmiao (130.5±0.8 Ma) and Fushan (127.1±1.2 Ma) (Zhou et al., 2008).

|
Fig. 4 Geologic map of the Luzong ore district (after Zhou et al., 2010) |
Intrusive rocks are widely distributed in the Luzong ore district. There are over 40 intrusive bodies of different sizes, with lithology including mainly diorite, monzonite, syenite and A-type granite. Diorite is mainly outcropped in the Shaxi area (NW side of the Luzong basin), which hosts the Shaxi porphyry Cu deposit. A-type granite bodies are mainly distributed in the SE side of the Luzong basin, forming a NE-trending magmatic belt. Monzonite bodies are mainly distributed in the basin center. Syenite bodies were identified at deeper-levels of many ore deposits, e.g., the Longqiao, Luohe, Nihe and Xiaoling Fe deposits. These syenite bodies are mainly emplaced as laccoliths or batholiths in the Middle Triassic Dongma'anshan Group or the Lower Cretaceous Longmenyuan and Zhuanqiao formations. The intrusions can be divided into an early and a late generation. Early intrusions (ca. 134-130 Ma) are mainly monzonite and diorite, as represented by the Shaxi, Jiaochong, Longqiao and Bamaoshan plutons. The early intrusions are mainly distributed in the northern part of the Luzong basin. The late intrusions comprise mainly two types, the first type contains mainly syenite (ca. 129-123 Ma), as represented by the Batan, Dagangyao and Luoling plutons in the southern part of the district. The second type contains mainly A-type granite (ca. 126-123 Ma), as represented by the Zongyang and Huangmeijian plutons (Zhou et al., 2010; Fan et al., 2014).
The Luzong volcanic basin is controlled by four boundary faults, i.e., the Luohe-Quekou fault in the west, the Lujiang-Huangguzha-Tongling detachment fault in the north and the Changjiang thrust fault and Taojiawan-Shijiawan fault in the east (Ren et al., 1993; Lü et al., 2014).
4.2 Physical Property AnalysisPhysical properties connect geophysics and geology. As for the previous physical property studies in Luzong (Zhang et al., 2010), substantial amount of ore density and magnetic susceptibility measurements were made in the Project SinoProbe-03 (Liu Y et al., 2012), and 3D lithologic mapping and geological modeling experiments were initiated (Yan et al., 2014; Qi et al., 2014; Guo et al., 2014). Geophysical studies on the Luzong rocks indicated substantial differences in density and magnetization intensity among the various major rock types: The volcanic sediments, syenite and terrestrial red beds normally contain relatively low density (2.4~2.5 g·cm-3), whereas the monzonite, diorite, subvolcanics and sandstone, limestone contain higher density (2.6~2.7 g·cm-3) (Fig. 5). For the 3D geological modeling constraints, Qi et al. (2014) further subdivided the Luzong rock geophysical properties based on a priori density, e.g., the Cretaceous Fushan Formation (K1f) trachyte has a density range of 2.40~2.51 g·cm-3, the Cretaceous Shuangmiao and Longmenyuan formation (K1sh-K1l) trachyandesite and clastics have density range of 2.56~2.66 g·cm-3. The magnetic susceptibility contrast of the volcanics/sub-volcanics is even more distinct among the red bed deposits.

|
Fig. 5 Cross plot of rock's density and susceptibility relationship in Luzong ore district (after Yan et al., 2014) |
The E-W structural framework of the Luzong ore district consists of the Qianshan-Kongcheng depression in the west and the Luzong volcanic basin in the east, with the two tectonic depressions separated by an uplifted Paleozoic-Mesozoic basement along the Yijin-Luohe-Quekou area. The two depressions contain very different geophysical properties: the Qianshan-Kongcheng depression is generally non-magnetic, low density, low resistivity, and low velocity at shallow-level, similar to terrestrial clastic sediment geophysical properties and reflect characters of typical sedimentary basins. In contrast, the Luzong volcanic basin is generally strongly magnetic, high resistivity, high velocity at shallow-level, and contains distinct boundaries of gravity lows and highs, similar to geophysical properties of volcanic/intrusive rocks and reflects nearly vertical intrusive contacts. The horst structure of the Luzong ore district is present in its northern and eastern parts. The northern part includes large area of Paleozoic strata bounded by the Lujiang-Huangguzha-Tongling detachment fault (LHTD), whilst the eastern part (adjacent to the uplifted zone along the Yangtze River) is composed of the overthrust Paleozoic-Mesozoic strata, which form the local gravity highs (Lü et al., 2014).
4.3 Gravity-Magnetic Edge Detection ResultsThe 1:50000 (500 m×500 m spacing) gravity-magnetic data used in this study were from the SinoProbe-03 project and the investigation report of the Buried and Deep-level Mineral Potential in the Luzong area (Anhui province).
4.3.1 Magnetic data edge detectionThe Luzong ore district is situated in low-middle latitude, and hence transformation to vertical mag-netization is needed. We performed the transformation using the International Geomagnetic Reference Field (IGRF12): Geomagnetic inclination and declination of the ore district center is 46.29° and -4.58°, respectively. As shown in Fig. 6a, aeromagnetic anomalies in the district are generally NE-trending, and widening towards the NE (Liu et al., 2012). The anomaly belt is 95 km along strike (27 km wide in the NE part and 18 km in the SW part), with the major anomalies distributed around Sunjiaban and Jiangjunmiao and some isolated ones along the volcanic basin margin. The major anomalies include those at Luohe, Longqiao, Jiaochong, Qianjiapu and Yangjiashi, whose locations correspond well with the discovered porphyrite-type Fe sulfide deposits. As for the isolated anomalies (or anomaly belts) around the basin, the Shaxi (NW of the basin) anomaly belt is NNE-trending with intensity reaching 2000 nT, and corresponds to the Shaxi porphyry Cu deposit. The isolated aeromagnetic anomaly (with local gravity anomalies) at Tangchuanhe (northern margin of the basin) is generally ellipsoidal with intensity reaching 1400 nT. A weak magnetic anomaly is also identified at Shijiawan on the eastern margin of the basin.

|
Fig. 6 Comparison of the edge detection results with different filters on the Luzong magnetic data (a) RTP magnetic anomalies; (b) Theta map method; (c) THDR method; (d) TDX method; (e) N_ED_A method based on 3D gradient tensor; (f) Theta1 method; (g) Theta2 method with p = 1.8. |
The Luzong volcanic basin contains many shallow-level (1 km deep) mineral occurrences. Before the edge detection processing, upward continuation of the aeromagnetic data was performed to eliminate shallow-level interference. Comparing the upward continued (0.5 km, 1 km, 2 km, 3 km and 5 km) data results, upward continuation by 1 km can both eliminate shallow-level interference and preserve anomaly information of the geological bodies. As shown in Fig. 6b-6g, the boundary detected by THDR is relatively blurred, whereas that by Theta, TDX and Theta2 is closer to the actual measurement. The boundary detected by Theta is coarser than that by TDX, and that by Theta2 is the finest (and contains the lowest background values). In terms of revealing geological details, Theta and TDX can reveal some relatively small semi-closed boundaries, whilst Theta2 can reveal complete closed boundaries. N_ED_A and Theta1 have similar edge detection results, in which they both detect major and minor geologic boundaries. The boundaries detected by Theta1 appear to be more distinct.
4.3.2 Gravity data edge detectionThe Bouguer gravity anomalies of the Luzong ore district are shown in Fig. 7a. In general, the anomalies are NE-trending. The NW and SE margin of the district is featured by gravity low, and the district center contains high gravity background. In this high background gravity field there are alternating positive/negative gravity highs and lows. The Sunjiaban-Yangjiashi area (center of the basin), and the Shaxi, Tanchuanhe and Yangjiaqiao areas (basin margin) contain gravity highs, which spatially coincide with the major ore deposit distribution, e.g., the Luohe Fe, Shaxi Cu and Longqiao Fe deposits. A few deposits (e.g., the Nihe Fe deposit) are also situated in the highs of the low gravity background area.

|
Fig. 7 Comparison of the edge detection results with different filters on the Luzong gravity data (a) 1:50000 Bouguer gravity anomalies; (b) Theta method; (c) THDR method; (d) TDX method; (e) N_ED_A method; (f) Theta1 method; (g) Theta2 method, p = 1.8. |
In the Luzong ore district, the gravity change is relatively subtle, and hence the Bouguer gravity anomalies data were used for the edge detection. As shown in Fig. 7b-7g, the boundary detected by THDR is relatively blurred. The boundary detected by TDX is finer (and contains more details) than Theta. The edge detection results of N_ED_A and Theta1 are very similar, and comparatively the boundary detected by Theta1 is clearer. The major boundary detected by Theta2 is similar to that detected by Theta and TDX, but with even finer boundary. In terms of geological details, the relatively small, semi-closed boundaries detected by Theta and TDX are shown as completely closed by Theta2. In Luzong, the actual measured gravity data vary in a narrow range and lack abrupt changes. Therefore, the edge detection results performed with the various filters are relatively similar, and comparatively those by Theta2 can best preserve both clarity and finesse of the detected boundary.
4.4 Geological InterpretationComparison of the edge detection results and actual measurements in the Luzong ore district indicates that Theta2 yields the best results, as the method detects accurate and fine boundaries and does not produce excessive boundaries. The overlapping of the gravity-magnetic edge detection image (by Theta2) and the Luzong geologic map is shown in Fig. 8.

|
Fig. 8 Superimposed maps of the Luzong ore district, showing the geology and edge detection results of magnetic (a) and gravity (b) data (after Lü et al., 2014) |
Previous studies suggest that the negative magnetic anomalies in the Luzong district coincide spatially with the Cretaceous red beds and other older strata, whereas the positive ones coincide with the volcanic/intrusive rock distributions. The local gravity highs correspond to the Paleozoic-Mesozoic strata and diorite, whilst the local gravity highs in the volcanics may correspond to up-doming of the basement and/or mafic-intermediate intrusions. Local gravity lows outside the volcanics correspond to the Cretaceous red beds or Quaternary sediments, whilst those inside the volcanics are probably induced by the syenite/monzonite batholiths and laccoliths (Liu et al., 2012; Yan et al., 2014; Qi et al., 2014; Lü et al., 2014).
The Tanlu fault zone is well-depicted in the edge detection results, whose location matches closely the detected magnetic boundary. A NE-trending (nearly parallel to the Tanlu fault zone) boundary is also revealed by the gravity edge detection, yet it is located further SE of the fault. There are major geophysical differences on the two sides of the Tanlu fault zone: The western side is featured by very high resistivity, low density and high magnetism, and is associated with the intermediate-felsic magmatic rocks in the Dabie ultra-high pressure (UHP) metamorphic zone (Lü et al., 2014). Interpretations of the artificial seismic profile Lz09-02 (extends NW across the Tanlu fault zone) in the Luzong district (Lü et al., 2014) suggest that SE of the CDP 801 spot lies the main fault of the Tanlu fault zone, which is located close to the magnetic boundary detected, whilst the gravity boundary detected is close to a small fault near the CDP 1201 spot, and may represent a secondary fault of the fault zone.
A NE-NNE-trending gravity boundary is detected SE of the Luzong ore district adjacent to the interpreted deep-level Changjiang Thrust Fault (CTF) (Lü et al., 2014). This structure may represent part of the Yangtze River fault and is only locally shown in the magnetic edge detection, e.g., the gravity-magnetic boundary east of the Huangmeijian pluton. From a geophysical property perspective, the overthrust Paleozoic-Mesozoic strata that constitute the Luzong ore district contain a density range of 2.61~2.79 g·cm-3 (Qi et al., 2014), which is on average 0.155 g·cm-3 higher than the monzonite, trachyandesite and syenite in the basin (2.47~2.62 g·cm-3; Liu Y et al., 2012), leading to clear boundaries between the two and local gravity anomalies.
Up until now, there are different interpretations for the boundary of the Luzong volcanic basin (Ren et al., 1993; Dong et al., 2010; Gao et al., 2010; Lü et al., 2014). Deep reflection seismic profile revealed that the Luzong basin is an unsymmetrical basin ("ear-shape") along the NE-trending Luohe-Quekou fault (Dong et al., 2010; Gao et al., 2010). Deep-level integrated geophysical profiling interpreted that the Luzong basin is a half-graben bounded by faults dipping towards the basin (Lü et al., 2014). The Luzong basin comprises mainly mafic-intermediate volcanic, with the ore magnetic susceptibility varying between 0~0.2 SI. There are two magnetic susceptibility peak values identified in the drill core measurement data: (1) 0~400 m depth: average magnetic susceptibility=0.02254 SI (max 0.12 SI), caused mainly by andesite; (2) 600~1100 m depth: average magnetic susceptibility=0.04234 SI (max > 0.2 SI), caused mainly by Fe-Cu ore bodies. Residual magnetism and magnetic susceptibility in the wall rocks around the Fe-Cu ore bodies are also relatively high, indicating certain extent of alteration and mineralization. Combined with the statistical results shown in Fig. 5, the positive magnetic anomalies-related volcanic/intrusive rocks in the basin contain magnetic susceptibility of 0.02~0.04 SI, whereas that of the negative magnetic anomalies-related Cretaceous red beds and older strata outside the basin is 0.00001~0.00002 SI. This difference of three orders of magnitude in magnetic susceptibility between the two rock assemblages leads to a highly distinct magnetic boundary (Fig. 8a), which is present in a nearly-close ring-like shape. The area bounded by the magnetic boundary detected is NE-trending, with its western boundary near the Luohe-Quekou fault, its northern boundary at the Longqiao-Jiaochong line, and its eastern boundary extends from east of the Huangmeijian pluton through Qianjiapu, Yangjiashi, Taojiaxiang to Zongyang. The boundaries detected largely correspond to the mapped geological units. Both the geological evidence and magnetic boundary detected (1 km upward continuation) suggested that boundaries of the Luzong basin dip inwards towards the basin, in accordance to the results of previous geophysical investigations (Lü et al., 2014).
The detected gravity boundaries of the Luzong basin are only locally correlated with the geologic boundary, e.g., at the Huangmeijian syenite pluton NE of the basin (2.53~2.63 g·cm-3). East of the Huangmeijian pluton are the overthrust Paleozoic-Mesozoic limestone strata (2.61~2.79 g·cm-3), whilst in the north are the Middle Jurassic clastic rocks (2.62~2.72 g·cm-3) (Qi et al., 2014). The lower density (on average 0.1~0. 12 g·cm-3 lower) of the Huangmeijian pluton creates local gravity anomalies and highly distinct gravity boundaries.
Inside the basin, a close gravity boundary is detected between the Yangjiadun, Sunjiaban, Bailiu areas, which coincides spatially with the Cretaceous Fushan formation trachyte (K1f; 2.40~2.51 g·cm-3). Rocks in the surrounding include the Cretaceous Shuangmiao (K1sh) and Zhuanqiao (K1zh) Formation trachyandesite and clastic rocks (2.56~2.66 g·cm-3) to its NW (Qi et al., 2014). The lower density of the Fushan formation (on average 0.155 g·cm-3 lower) creates local low gravity anomalies and highly distinct gravity boundaries. Inside this low gravity confining area of the Fushan formation, there is one big ellipsoidal magnetic low (between Yangjiadun, Dianqiao and Bailiu) and one small ellipsoidal magnetic low (NW corner of Qianjiapu). Previous geological investigations suggested that these magnetic lows represent a caldera (Ren et al., 1993), which may have been intruded by intermediate-felsic granitoids (A-type granite or syenite) that are low magnetic and low density. Drilling is needed to further constrain the rock types and geophysical property of the area.
There are some ring-like or nearly-closed boundaries outside the Luzong ore district, which correspond to the deep-level buried intrusions, e.g., the magnetic body delineated to the SW of the exposed Shaxi pluton may represent the underground extension of the pluton, whereas that at Tanchuanhe corresponds to the buried mafic-ultramafic pluton discovered by drilling. In the magnetic-gravity body delineated at Yufeng, recent exploration has identified the presence of deeply buried diorite porphyrite with Fe-Cu skarn mineralization.
4.5 SummaryIn this study, we found that the volcanics and intrusive rocks inside the Luzong basin have a magnetic susceptibility three orders of magnitude higher than the Cretaceous red beds and older strata outside the basin, yielding the highly distinct magnetic edge detection results. Geophysical property analysis of the areas bounded by the detected gravity boundary suggests that for many places in Luzong, a density contrast of ≥0.1 g·cm-3 would be enough to generate satisfactory gravity edge detection results, e.g., the cases of the Huangmeijian pluton (0.1~0.12 g·cm-3 density difference) and Cretaceous Fushan Formation (0.155 g·cm-3 density difference). These results were obtained from 1:50000 gravity-density data, and more geological details would likely be yielded if higher resolution data (e.g., 1:10000) are used.
5 CONCLUSIONS(1) We defined a new edge detection filter based on the Theta map method via first getting the 1st order vertical derivative of the gravity-magnetic data, and then applying the Theta equation on the 1st order vertical derivative to perform edge detection. Theta2 is different from Theta1 in terms of the high-order vertical derivative transformation in the former, which enables clearer delineation of the major geologic boundary. Model testing and edge detection result comparison with other filters indicated that our new filter can distinctly suppress the magnification of the deep-level geologic boundaries (formed by Theta), better balance the deep-/shallow-level boundary, and thus more clearly locate the horizontal boundary of geological bodies.
(2) Case study of the Luzong ore district with 1:50000 gravity-magnetic data processing and interpretation indicated that the edge detection results accurately depict the Tanlu fault zone location: Magnetic boundary is situated near the main fault of the Tanlu fault zone, whilst the gravity boundary in the northern bank of the Yangtze River may represent part of the Yangtze River fault. The detected magnetic boundaries of the Luzong basin largely coincide with the geologic boundaries, and show that the boundary faults dip towards the basin in deeper levels. For the other ring-like boundaries detected outside the Luzong basin, their locations coincide with the deep-level plutons and Fe-Cu mineralization bodies identified in recent exploration, suggesting that these boundaries possess important implications in regional deep-level Fe-Cu exploration.
ACKNOWLEDGMENTSWe thank Mr. Lü and Yan from the SinoProbe-03 project team for their help. Figures in the manuscript were plotted with the GMT software (developed by Wessel and Smith). We appreciate the insightful comments made by the editor and reviewers. This work is supported by the National Natural Science Foundation of China(41320104003), and the National Key R & D Plan (2016YFC0600206).
| [] | Blakely R J, Simpson R W. 1986. Approximating edges of source bodies from magnetic or gravity anomalies. Geophysics , 51 (7) : 1494-1498. DOI:10.1190/1.1442197 |
| [] | Chang Y F, Liu X P, Wu Y C. 1991. The Copper-Iron Belt of the Lower and Middle Reaches of the Changjiang River[M]. Beijing: Geological Publishing House . |
| [] | Cooper G R J, Cowan D R. 2006. Enhancing potential field data using filters based on the local phase. Computers & Geosciences , 32 (10) : 1585-1591. |
| [] | Cordell L. 1979. Gravimetric expression of graben faulting in Santa Fe Country and the Espanola Basin, New Mexico. //New Mexico Geological Society Guidebook, 30th Field Conference, 59-64. |
| [] | Dong S W, Xiang H S, Gao R, et al. 2010. Deep structure and ore formation within Lujiang-Zongyang volcanic ore concentrated area in Middle to Lower Reaches of Yangtze River. Acta Petrologica Sinica , 26 (9) : 2529-2542. |
| [] | Evjen H M. 1936. The place of the vertical gradient in gravitational interpretations. Geophysics , 1 (1) : 127-136. DOI:10.1190/1.1437067 |
| [] | Fan Y, Qiu H, Zhou T F, et al. 2014. LA-ICP MS zircon U-Pb dating for the hidden intrusions in the Lu-Zong basin and its tectonic significance. Acta Geologica Sinica , 88 (4) : 532-546. |
| [] | Gao R, Lu Z W, Liu J K, et al. 2010. A result of interpreting from deep seismic reflection profile:Revealing fine structure of the crust and tracing deep process of the mineralization in Luzong deposit area. Acta Petrologica Sinica , 26 (9) : 2543-2552. |
| [] | Guo D, Yan J Y, Lü Q T, et al. 2014. 3D density mapping constrained by geological information:model study and application. Acta Geologica Sinica , 88 (4) : 763-776. |
| [] | Hornby P, Boschetti F, Horowitz F G. 1999. Analysis of potential field data in the wavelet domain. Geophysical Journal International , 137 (1) : 175-196. DOI:10.1046/j.1365-246x.1999.00788.x |
| [] | Hsu S H, Sibuet J C, Shyu C T. 1996. High-resolution detection of geologic boundaries from potential-field anomalies:An enhanced analytic signal technique. Geophysics , 61 (2) : 373-386. DOI:10.1190/1.1443966 |
| [] | Li L L, Huang D N, Han L G. 2014. Application of the normalized total horizontal derivative (NTHD) in the interpretation of potential field data. Chinese J. Geophys. , 57 (12) : 4123-4131. DOI:10.6038/cjg20141223 |
| [] | Liu D J, Hong T Q, Jia Z H, et al. 2009. Wave number domain iteration method for downward continuation of potential fields and its convergence. Chinese J. Geophys. , 52 (6) : 1599-1605. DOI:10.3969/j.issn.0001-5733.2009.06.022 |
| [] | Liu D J, Hong T Q, Liao X T, et al. 2012. Iterative solution of integral equation for potential field continuation from an irregular surface to a horizontal plane. Chinese J. Geophys. , 55 (10) : 3467-3476. DOI:10.6038/j.issn.0001-5733.2012.10.030 |
| [] | Liu Y, Lü Q T, Yan J Y, et al. 2012. The structure of Luzong ore district and its metallogenic indication from gravity and magnetic information. Acta Petrologica Sinica , 28 (10) : 3125-3138. |
| [] | Lü Q T, Liu Z D, Tang J T, et al. 2014. Upper crustal structure and deformation of Lu-Zong ore district:Constraints from integrated geophysical data. Acta Geologica Sinica , 88 (4) : 447-465. |
| [] | Ma G Q, Du X J, Li L L. 2013. New edge detection method of potential field data-enhanced horizontal derivative method. Progress in Geophys. , 28 (1) : 402-408. DOI:10.6038/pg20130145 |
| [] | Ma G Q, Huang D N, Yu P, et al. 2012. Application of improved balancing filters to edge identification of potential field data. Chinese J. Geophys. , 55 (12) : 4288-4295. DOI:10.6038/j.issn.0001-5733.2012.12.040 |
| [] | Ma G Q, Liu C, Huang D N. 2015. The removal of additional edges in the edge detection of potential field data. Journal of Applied Geophysics , 114 : 168-173. DOI:10.1016/j.jappgeo.2015.01.007 |
| [] | Miller H G, Singh V. 1994. Potential field tilta new concept for location of potential field sources. Journal of Applied Geophysics , 32 (2-3) : 213-217. DOI:10.1016/0926-9851(94)90022-1 |
| [] | Nabighian M N. 1984. Toward a three-dimensional automatic interpretation of potential field data via generalized Hilbert transforms:Fundamental relations. Geophysics , 49 (6) : 780-786. DOI:10.1190/1.1441706 |
| [] | Pan Y M, Dong P. 1999. The Lower Changjiang (Yangzi/Yangtze River) metallogenic belt, east central China:Intrusionand wall rock-hosted Cu-Fe-Au, Mo, Zn, Pb, Ag deposits. Ore Geology Reviews , 15 (4) : 177-242. DOI:10.1016/S0169-1368(99)00022-0 |
| [] | Qi G, Lü Q T, Yan J Y, et al. 2014. 3D geological modeling of Luzong ore district based on priori information constrained. Acta Geologica Sinica , 88 (4) : 466-477. |
| [] | Rajagopalan S, Milligan P. 1994. Image enhancement of aeromagnetic data using automatic gain control. Exploration Geophysics , 25 (4) : 173-178. DOI:10.1071/EG994173 |
| [] | Ren Q J, Wang D Z, Xu Z W, et al. 1993. Formation and development of the Mesozoic Lujiang-Zongyang volcanicstructural depression in Anhui Province and their relation to mineralization. Acta Geologica Sinica , 67 (2) : 131-145. |
| [] | Roest W R, Verhoef J, Pilkington M. 1992. Magnetic interpretation using the 3-D analytic signal. Geophysics , 57 (1) : 116-125. DOI:10.1190/1.1443174 |
| [] | Sertcelik I, Kafadar O. 2012. Application of edge detection to potential field data using eigenvalue analysis of structure tensor. Journal of Applied Geophysics , 84 : 86-94. DOI:10.1016/j.jappgeo.2012.06.005 |
| [] | Tang Y C, Wu Y C, Chu G Z, et al. 1998. Geology of Copper-Gold Polymetallic Deposits in the along Changjiang Area of Anhui Province. Beijing:Geological Publishing House : 10-21. |
| [] | Verduzco B, Fairhead J D, Green C M, et al. 2004. New insights into magnetic derivatives for structural mapping. The Leading Edge , 23 (2) : 116-125. DOI:10.1190/1.1651454 |
| [] | Wang J, Meng X H, Li F. 2015. Improved curvature gravity gradient tensor with principal component analysis and its application in edge detection of gravity data. Journal of Applied Geophysics , 118 : 106-114. DOI:10.1016/j.jappgeo.2015.04.013 |
| [] | Wijns C, Perez C, Kowalczyk P. 2005. Theta map:Edge detection in magnetic data. Geophysics , 70 (4) . |
| [] | Yan J Y, Lü Q T, Chen M C, et al. 2015. Identification and extraction of geological structure information based on multi-scale edge detection of gravity and magnetic fields:An example of the Tongling ore concentration area. Chinese J. Geophys. , 58 (12) : 4450-4464. DOI:10.6038/cjg20151210 |
| [] | Yan J Y, Lü Q T, Chen X B, et al. 2014. 3D lithologic mapping test based on 3D inversion of gravity and magnetic data:A case study in Lu-Zong ore concentration district, Anhui province. Acta Petrologica Sinica , 30 (4) : 1041-1053. |
| [] | Yuan F, Zhou T F, Fan Y, et al. 2008. Source, evolution and tectonic setting of Mesozoic volcanic rocks in Luzong basin, Anhui Province. Acta Petrologica Sinica , 24 (8) : 1691-1702. |
| [] | Yuan Y, Huang D N, Yu Q L, et al. 2014. Edge detection of potential field data with improved structure tensor methods. Journal of Applied Geophysics , 108 : 35-42. DOI:10.1016/j.jappgeo.2014.06.013 |
| [] | Yuan Y, Huang D N, Yu Q L. 2015. Using enhanced directional total horizontal derivatives to detect the edges of potential-field full tensor data. Chinese J. Geophys. , 58 (7) : 2556-2565. DOI:10.6038/cjg20150730 |
| [] | Yuan Y, Yu Q L. 2015. Edge detection in potential-field gradient tensor data by use of improved horizontal analytical signal methods. Pure and Applied Geophysics , 172 (2) : 461-472. DOI:10.1007/s00024-014-0880-1 |
| [] | Zhai Y S, Yao S Z, Ling X D. 1992. Regularities of Metallogenesis for Copper (Gold) Deposits in the Middle and Lower Reaches of the Yangtze River Area. Beijing:Geological Publishing House : 1-120. |
| [] | Zhang J S, Gao R, Li Q S, et al. 2010. Characteristics of gravity and magnetic field of Luzong volcano basin and its periphery. Acta Petrologica Sinica , 26 (9) : 2613-2622. |
| [] | Zhou T F, Fan Y, Yuan F. 2008. Advances on petrogensis and metallogeny study of the mineralization belt of the Middle and Lower Reaches of the Yangtze River area. Acta Petrologica Sinica , 24 (8) : 1665-1678. |
| [] | Zhou T F, Fan Y, Yuan F, et al. 2010. Temporal-spatial framework of magmatic intrusions in Luzong volcanic basin in East China and their constrain to mineralizations. Acta Petrologica Sinica , 26 (9) : 2694-2714. |
| [] | Zhou W N, Du X J, Li J Y. 2013. The limitation of curvature gravity gradient tensor for edge detection and a method for overcoming it. Journal of Applied Geophysics , 98 : 237-242. DOI:10.1016/j.jappgeo.2013.09.008 |