 2017, Vol. 60


2 Beijing Key Laboratory of Earth Prospecting and Information Technology, China University of Petroleum, Beijing 102249, China;
3 PetroChina, Changqing Oilfield Company, Xi'an 710018, China;
4 Xinjiang Xinchun Oil Company, SINOPEC, Shandong Dongying 257000, China;
5 Research Institute of Exploration and Development, Liaohe Oilfield, PetroChina, Liaoning Panjin 124010, China
Wettability is the relative adhesion of water or oil to a solid surface that determines the fluid microscopic distribution and the ease of fluid flow in the original reservoir, which has a significant effect on reservoir resistivity characteristic (Anderson, 1986a; Tiab and Donaldson, 1996). The Archie formula shows that resistivity is an important parameter for oil saturation evaluation (Archie, 1942). Therefore, study on wettability is of great importance in rock resistivity and conductive mechanism.
Researches on the effect of wettability on resistivity began since 1950s to 1960s. Based on petrophysical experiments, early researches mainly focused on the variation of saturation index (n) according to the variation of wettability. Sweeney and Jennings (1960) measured that the n value of oil-wet core was much larger than that of water-wet core when water saturation (Sw) is lower. In 1989, Donaldson and Siddiqui found that the n value and wettability showed a linear relation by experiments of Berea and Elgin sandstones. Then they made this relation quantitative. At that time, many other researchers also obtained similar results (Morgan and Pirson, 1964; Mungan and Moore, 1968; Anderson, 1986b; Sondenaa et al., 1991; Mao et al., 1997; Gao et al., 1998).
As is known to all, the n value and wettability have a good correlation. However, the n value can only reflect the character of resistivity under hydrocarbon-bearing condition. Only knowing the conductive mechanism of rock can we understand the variation of resistivity all the time during hydrocarbon accumulation period. Hence, it is very important to acquire the variation of resistivity and conductive mechanism of rock. The Archie formula can be applied to pure sandstones or sandstones with very little clay very well. The relation of resistivity index (Ir) and Sw is linear in a log-log plot. Nevertheless, it varies greatly in other complex reservoirs, which is concave or convex in oil displacing water process (Mungan and Moore, 1968; Rasmus, 1986; Mao and Zhang, 1995; Stalheim et al., 1999; Liu et al., 2003; Kumar et al., 2010; Ouyang et al., 2009). The former relation presents that the rise of n value is along with the decrease of Sw due to oil-wettability, while the latter shows the opposite result, which is mainly resulted from clay mineral, conductive mineral, micropore and rough surface of minerals (Stalheim et al., 1999). In the oil displacing water process, the Ir-Sw curve presents U-type, S-type or a two-stage shape (Fan et al., 1998; Yang et al., 2005).
The rock samples in this study were taken from deep lake deposits in Chang 8 formation, Yanchang group, Upper Triassic, the western Ordos basin of China, at the depth generally greater than 2000 m. After complex water-rock interaction during diagenesis and hydrocarbon accumulation period, as the main diagenetic mineral, chlorite cement not only fills in the pores, but also occurs in the form of thin film of different thicknesses coating sand grains. crude oil entered the reservoirs in the study area, and the heavy components adhere to the iron-rich chlorite film, resulting in the oil-wet reservoirs in the study area (Trantham and Clampitt, 1977; Zhang et al., 2000). As is shown in Fig. 1, the strong fluorescence on the edge of the minerals reflects the above oil-wet feature. As a result, high resistivity water layers appeared in large numbers (Feng et al., 2015). In order to understand the hydrocarbon accumulation mode and the corresponding conductive mechanism of reservoirs under the influence of wettability, typical cores were selected to measure contact angle, and conduct oil displacing water, ageing, and water displacing oil experiments. The obtained experimental data were analyzed and discussed in detail. The hydrocarbon accumulation mode, the corresponding conductive mechanism and main cause of abnormally high resistivity water layer are made clear, which is of theoretical significance in guiding the understanding of microscopic conductive mechanism, the identification of oil and wa-ter layers and the evaluation of water flooded layer.

|
Fig. 1 Fluorescence photomicrograph of a core sample from Chang 8 formation in the study area |
It is well known that reservoirs are considered water-wet initially. When the reservoir gradually becomes oil-wet, its resistivity is abnormally high relative to that of the same water-wet one (Tiab and Donaldson, 1996), and the NMR T2 spectra can not reflect pore structure (Wang and Li, 2009; Ge et al., 2016). On the basis of the above understandings, typical core samples with abnormally high resistivity and normal resistivity were selected for petrophysical experiments, and then thin slices were cut from some core samples to measure contact angle. All the core samples are well cemented sandstones, 2.5 cm in diameter, 4 cm in length, with a porosity range of 3.85%~19% and a permeability range of (0.03 ~ 20.4) × 10-3 μm2, mostly below 1×10⁻³ μm2. According to the actual viscosity of underground oil, the experimental oil was prepared by mixing crude oil with aviation kerosene in definite proportions. In order to avoid the influence of water salinity, the experimental water salinity was fixed at 30 g/L, which was the average formation water salinity in the study area.
The experimental measurements included resistivity under different wettability and water saturation con-ditions, the relation of formation factor (F) and porosity (POR), the relation of resistivity index (Ir) and water saturation (Sw) in oil displacing water and water displacing oil processes, and the variation of resistivity dur-ing ageing process. The thin slices were used to measure contact angle. In the experiment, washing oil was done via solvent extraction method. Based on industry standard (SY/T 5385-2007) (Wang et al., 2008), if the fluorescence grade was less than the third level, this process was accomplished. In addition, porosity and permeability were repeatedly measured after some interval of time. On condition that their values and relations kept unchanged, the oil was deemed to be washed thoroughly. The above two methods could basically eliminate errors caused by washing oil. Semi-permeable baffle plate method was used in the process of oil displac-ing water and water displacing oil. Resistivity was ac-quired via four-electrode method. The contact angle experiments were conducted in a water/air/rock system via the German experimental apparatus EASYDROP DSA20. The temperature and pressure was 70 ℃ and 25 MPa in the ageing process. The ageing process lasted over 30 days. The experimental flow chart is exhibited in Fig. 2.

|
Fig. 2 The experimental flow chart |
On the basis of the above experimental materials and flow chart, the contact angle experimental results of core samples after washing oil are presented in Fig. 3. Among them, the contact angles of abnormally high resistivity core samples are between 50° to 70°, while those of the normal ones are about 40°. According to Anderson's classification criterion of wettability (Anderson, 1986a), the wettability of abnormally high resistivity core samples is between water-wet and neutrally wet, while the others' is water-wet.

|
Fig. 3 Experimental results of contact angle after washing oil |
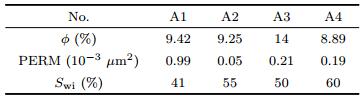
The F -POR relation is shown in Fig. 4. Their cementation indexes are 1.79 and 1.73 by regression analysis, indicating the difference is small. The Ir-Sw curves of four typical core samples in the oil displacing water process are shown in Fig. 5. Core samples A1, A2 and A3, A4 are abnormally high resistivity and normal resistivity respectively. Their curves are convex and linear respec-tively in a log-log plot. The porosity, permeability and irreducible water saturation are shown in Table 1. The comparison of resistivity before and after ageing of ab-normally high resistivity core samples is shown in Fig. 6. They have no obvious difference. The Ir-Sw curves of core samples A1 and A2 in the processes of oil displac-ing water and water displacing oil are shown in Fig. 7. The curves in the process of water displacing oil are linear. Those in the process of oil displacing water are not discussed in this study because they are clearly un-derstood (Fan et al., 1998; Yang et al., 2005).

|
Fig. 4 The relationship of formation factor and porosity |

|
Fig. 5 Experimental results of Ir-Sw curve in oil displacing water process |
|
|
Table 1 Porosity, permeability and irreducible water saturation of cores |

|
Fig. 6 Resistivity contrast of abnormal high resistivity cores before and after aging |

|
Fig. 7 Abnormal high resistivity core experimental results of Ir-Sw curve in water displacing oil process |
The previous research results presented that the wetta-bility of core samples changed after cleaning (Anderson, 1986a; Zhang et al., 2000). However, it doesn't mean the core samples are fully water-wet. In order to mea-sure the data more accurately, oil was washed twice in this experiment. The experimental results are shown in Fig. 3. According to Anderson's classification crite-rion of wettability (Anderson, 1986a), the wettability of abnormally high resistivity core samples is between water-wet and neutrally wet, while the others' is water-wet. It presents that abnormally high resistivity core samples are not fully water-wet after washing oil, indi-cating that oil film has become the structure component of rocks, which can not be washed completely.
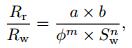
4.2 Oil Displacing Water and AgeingThe analysis of resistivity is based on the Archie formula (Archie, 1942). Its variable form is commonly as below.
|
(1) |
where a and b are model parameters; m is cementation index; n is saturation index; ϕ is porosity; Sw is water saturation; Rw is formation water resistivity, Ωm; Rt is formation resistivity, Ωm.
Under fully brine-saturated condition, the measured m values of abnormally high resistivity and normal core samples are 1.79 and 1.73 respectively. They have no difference, which implies that the measured resistivity of the two kinds of core samples are almost the same. Even though the contact angles show that the abnormally high resistivity core samples are slightly neutrally wet, this has no effect on its conducting path and measured resistivity.
Take the logarithm of Eq.(1) and get the following equation.

|
(2) |
where a, b and m are constants in similar reservoirs. When ϕ is acquired, the relation of Ir and Sw is linear in a log-log plot.
Figure 8 shows that the Ir-Sw curves of normal resistivity core samples is linear in a log-log plot, especially when Sw is higher than 55%. The calculated n value is 1.78 (Fig. 5). This conforms with the feature of water-wet reservoirs. However, the Ir-Sw curves of abnormally high resistivity core samples are obviously convex in a log-log plot. Moreover, it is different from the previous research results. The previous results show Ir-Sw curves are mainly linear when oil displacing water in large pores. Its n value equals to that of water-wet reservoirs, as shown in segment Ⅰ, Fig. 8. When oil displacing water in small pores, the Ir-Sw curves present convex feature because of the influence of clay mineral, conductive mineral and micropore (Stalheim et al., 1999). The convex feature in this experiment includes two stages. The first stage is segment Ⅱ in Fig. 8. At this time, the calculated n value is much greater than that of normal resistivity core samples, and the curve is convex. The second stage is segment Ⅲ in Fig. 8, which is similar with segment Ⅰ. The porosity, permeability and irreducible water saturation indicate that the resistivity influence factors (lithology, physical property, pore structure et al.) are not the main cause of the above abnormal phenomena.

|
Fig. 8 The analysis of Ir-Sw curves in oil displacing water process |
The above convex feature of Ir-Sw curves suggests that oil film has been formed in oil displacing water process. And the wettability of rocks has transformed into oil-wet. Segment Ⅱ shows that the abnormal increase of Ir resulted from not only the decrease of Sw, but also the change of wettability. Furthermore, the influence of the latter is greater. When Sw decreases to Sw1, the increase of Ir is mainly affected by the decrease of Sw. The influence of wettability is not obvious. Based on the above analyses, the convex feature of core samples A1 and A2 is the result of inhomogeneous changes of wettability. At the beginning of oil displacing water, the oil mostly adheres to the iron-rich chlorite film. Then some of the following oil gathers in the pores. Finally, when Sw is less than Sw1, most of the oil fills in the pores. The process is continuous, which makes the Ir-Sw curves exhibit convex feature.
Figure 6 shows that the resistivity of abnormally high resistivity core samples before and after ageing is basically the same, which indicates that the wettability keeps unchanged before and after ageing.
In order to verify the above viewpoints about Ir-Sw curves, nuclear magnetic resonance (NMR) T2 (trans-verse relaxation time) spectra of abnormally high resistivity core sample A1 under different conditions are analyzed (Xiao et al., 2012; Ge et al., 2015) (Figs. 9 and 10). The NMR T2 spectra were measured by the MARAN DRX2 apparatus manufactured by Oxford Instrument Company, UK, with a waiting time of 6 s and an echo interval of 0.2 ms. In the experiment, cleaning, filling the experimental water, centrifuging, filling the experimental water again, oil displacing water, ageing and water displacing oil are conducted in order. In the process of filling the experimental water, if porosity measured by water equals to that by helium, the process is accomplished. Analyses and discussions are as below.

|
Fig. 9 Volume relaxation time of oil and water |

|
Fig. 10 NMR T2 spectra of abnormal high resistivity core A1 under different conditions |
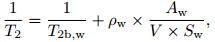
Looyestijn and Hofman (2006) thought that in a uniform magnetic field, when there were oil and water in the pores and the rock wettability was not water-wet, the NMR T2 relaxation time of water could be calculated as
|
(3) |
where T2 is transverse relaxation time, ms; T2b, w is volume relaxation time of water, ms; ρw is the surface relaxation intensity of water, μm·ms-1; Aw is pore surface area wetted by water, μm2; V is pore volume, μm3; Sw is water saturation.
Firstly, the NMR T2 spectra under hydrocarbon-bearing condition (non-ageing and ageing) in Fig. 10 are almost the same, which verifies that the wetta-bility keeps unchanged before and after ageing. The NMR T2 spectra under residual oil and 100% water saturation conditions are also shown in Fig. 10 respectively. Under both conditions, the large pores are full of the experimental water. Eq.(3) is used to analyze this difference. The NMR T2 relaxation time is much larger under residual oil condition (ageing), but T2b, w, ρw, V and Sw remain the same basically, which indicates that the rock surface wetted by water (Aw) decreases, and the pores turn neutrally wet or oil-wet in the residual oil condition. However, the above analysis shows that the wettability keeps unchanged before and after ageing. It can only change in oil displacing water process.
Combining resistivity and NMR T2 spectra analyses, oil film of abnormally high resistivity core samples has been formed during oil displacing water process, which represents the change of wettability. Ageing process has little effect on the change of wettability.
4.3 Water Displacing Oil ProcessIn order to understand the influence of wettability on conductive mechanism, salinity of the experimental water in this experiment was the same. So the influence of water salinity can be ignored in the analyzing process. In Yang's experiments (Yang et al., 2005), a "sharp down to slow down" curve was obtained. It means that the resistivity of core samples drops rapidly at the beginning of water displacing oil. When Sw reaches a characteristic value, the decreasing tendency of Ir slows down, until there is no decrease. However, the result acquired in this experiment is obviously different. As shown in Fig. 7, the Ir-Sw curves of abnormally high resistivity core samples A1 and A2 present linear fea-ture in water displacing oil process. In order to under-stand the abnormal phenomenon, take core sample A1 as an example to analyze and discuss (Fig. 11). The above analysis exhibits that the change of wettability appears in oil displacing process and ageing process has little effect on it. Therefore, core samples are not water-wet. The Ir-Sw curve of core sample A1 in water displacing oil process is segment Ⅳ in Fig. 11. It shows that the decrease of Ir is less than the increase of Ir in segment Ⅲ with the variation of Sw, indicating that the conductive structure formed in oil displacing water process doesn't change. The decrease of Ir is mainly caused via the increase of Sw. When oil saturation (So) reaches the residual oil saturation (Sor), the residual oil is reserved as oil film. The conductive structure doesn't increase. Therefore, the Ir-Sw curves of water displacing oil process exhibit linear feature in this experiment, which is different from Yang's results (Yang et al., 2005).

|
Fig. 11 The analysis of Ir-Sw curves in water displacing oil process |
Based on the above analyses and discussions of experimental data, an applicable hydrocarbon accumulation mode and the corresponding conductive mechanism in low-permeability reservoirs is proposed on the premise that formation water salinity keeps unchanged.
The hydrocarbon accumulation mode is similar to previous research results (Yang et al., 2005) in water-wet low-permeability reservoirs. Continuous conductive paths always exist during oil displacing water and water displacing oil processes (Fig. 12a).

|
Fig. 12 The cross-sectional views of oil and water distribution in rocks (a) Represents water-wet rocks under irreducible water saturation condition; (b) Represents oil-wet rocks under fully brine-saturated condition; (c) and (d) Represents oil-wet rocks in oil displacing water process; (e) Represents oil-wet rocks under irreducible water saturation condition; (f) Represents oil-wet rocks under residual oil condition. |
Before hydrocarbon accumulation, the sectional view of reservoirs is exhibited in Fig. 12b. The reservoirs are fully brine-saturated, which have continuous conductive paths. Their resistivity features are the same as water-wet reservoirs. Hence, the measured m of abnormally high resistivity and normal resistivity core samples are almost equal after washing oil. In the hydrocarbon accumulation period, oil displaces formation water under the action of displacement pressure and capillary pressure (from right to left, the same below) (Fig. 12c). The iron-rich chlorite film coats sand grains. Oil touches and adheres to it. The connectivity of the oil films in both sides of the throat makes it blocking. Meanwhile, the corresponding continuous conductive path breaks. Oil can only migrate through other continuous paths, as is shown as arrows in Fig. 12c, which results in the increase of conductive path length and decrease of conductive path number. Owing to the decrease of Sw and the destruction of continuous conductive path, the resistivity of the reservoirs increases rapidly. Then oil migrates through smaller throats. At this time, the throats are more probably destroyed. The phenomenon appears in Fig. 12d. It means that the filling oil is all used to form oil films and destroy the throats. The number of continuous conductive paths is very small. At this moment, even though So is not very high, the resistivity is abnormally high. This is resulted from the destruction of continuous conductive paths. If the dynamic force of hydrocarbon accumulation is big enough, oil can reach small pores (Fig. 12e). During this period, the change in the pores is only Sw. So the rise rate of resistivity obviously decreases.
In water displacing oil process, free oil is replaced by formation water little by little. Under residual oil condition, free oil disappears but the oil films can not be destroyed. The conductive structure keeps unchanged from the end of hydrocarbon accumulation process (Fig. 12f). Therefore, the decrease of Ir is mainly controlled by the increase of Sw during water displacing oil period.
According to the above hydrocarbon accumulation mode and the corresponding conductive mechanism, many abnormal phenomena of resistivity can be well interpreted in low-permeability reservoirs with complex wettability. Take the typical high resistivity water layers as example. Once the reservoirs experience hydrocar-bon accumulation, it reaches the condition in Fig. 12d. Then, the hydrocarbon accumulation stops because of the lack of dynamic force of hydrocarbon accumulation. However, the oil film, which destroys the continuous conductive path, has been formed. Abnormally high resistivity oil and water layers may appear. Another more probable condition is that the oil reservoirs are destroyed after the hydrocarbon accumulation. Nevertheless, the oil films are not destroyed. In this way, the connected oil films destroy the continuous conductive path (Fig. 12f). Even though Sw is high, there is little continuous conductive path. It exhibits high resistivity feature. Normal pay zones are shown in Fig. 12a. Even though Sw is small, there are many continuous conductive paths. What's more, the contrast of oil and water is not obvious in low-permeability reservoirs. Therefore, the resistivity of abnormally high resistivity water layers can be higher than that of normal resistivity pay zones. This is of great importance for understanding the conductive mechanism, oil layers identification and the evaluation of water flooded formation in low-permeability reservoirs with complex wettability.
6 CONCLUSIONSThe contact angle and resistivity experimental data, during oil displacing water, ageing and water dis-placing oil processes in low-permeability reservoirs with complex wettability, are analyzed and discussed. The resistivity response characteristic and microcosmic conductive mechanism are made clear. After washing oil, abnormally high resistivity core samples are not fully water-wet. However, the measured m values of abnormally high resistivity and normal resistivity core samples are almost the same because the difference of wettability has little effect on resistivity measurement. In oil displacing water process, the Ir-Sw curves of abnormally high resistivity and normal resistivity core samples exhibit convex and linear feature respectively. The resistivity of abnormally high resistivity core samples keeps unchanged during the ageing process. In combination with the analysis of NMR T2 spectra, the change of wettability is inferred during the beginning of oil displacing water process. The abnormal increase of Ir is mainly controlled by wettability. During the late period, the wettability keeps unchanged and the rate of Ir increase is decreased. The ageing process has little effect on the change of wettability. In water displacing oil process, the Ir-Sw curves of abnormally high resistivity core samples exhibit approximately linear feature, indicating that the decrease of Ir is mainly controlled by the increase of Sw. The oil films and destroyed continuous conductive paths are not recovered. Based on these analyses and discussions, the applicable hydrocarbon accumulation mode and the corresponding conductive mechanism in low-permeability reservoirs with complex wettability are understood, which explains that the abnormally high resistivity water layers are caused by the destruction of continuous conductive paths. The researches and experiments are of great importance for understanding the conductive mechanism, oil layers identification and the evaluation of water flooded formation in low-permeability reservoirs with complex wettability.
ACKNOWLEDGMENTSThis work was supported by the China National Science and Technology Major Project (2016ZX05050008) and the Scientific Research Starting Foundation of China University of Petroleum-Beijing at Karamay (RCYJ20-16B-01-008).
| [] | Anderson W G. 1986a. Wettability literature survey-part 2:wettability measurement. Journal of Petroleum Technology , 38 (11) : 1246-1262. DOI:10.2118/13933-PA |
| [] | Anderson W G. 1986b. Wettability literature survey-part 3:the effects of wettability on the electrical properties of porous media. Journal of Petroleum Technology , 38 (12) : 1371-1378. DOI:10.2118/13934-PA |
| [] | Archie G E. 1942. The electrical resistivity log as an aid in determining some reservoir of characteristics. Trans. A. I.M. E , 146 : 54-60. |
| [] | Donaldson E C, Siddiqui T K. 1989. Relationship between the Archie saturation exponent and wettability. SPE Formation Evaluation , 4 (3) : 359-362. DOI:10.2118/16790-PA |
| [] | Fan Y R, Deng S G, Liu B K. 1998. Experiment on rock resistivity in the process of fresh water drive. Well Logging Technology , 22 (3) : 153-155. |
| [] | Feng C, Mao Z Q, Shi Y J, et al. 2015. Correlation analysis of well logs and its application to identifying pay zones with complex wettability. Science Technology and Engineering , 15 (21) : 117-122. |
| [] | Gao C Q, Zhang C G, Mao Z Q. 1998. The effects of wettability on the electrical properties of rocks. Progress in Geophysics , 13 (1) : 60-72. |
| [] | Ge X M, Fan Y R, Li J T, et al. 2015. Pore structure characterization and classification using multifractal theory-an application in tight reservoir of Santanghu basin in Western China. Journal of Petroleum Science and Engineering , 127 : 297-304. DOI:10.1016/j.petrol.2015.01.004 |
| [] | Ge X M, Fan Y R, Cao Y C, et al. 2016. Investigation of organic related pores in unconventional reservoir and its quantitative evaluation. Energy Fuels , 30 (6) : 4699-4709. DOI:10.1021/acs.energyfuels.6b00590 |
| [] | Huang L J. 1995. Model evaluation of wettability effect on rock resistivity. Acta Geophysica Sinica , 38 (3) : 405-410. |
| [] | Kumar M, Sok R, Knackstedt M A, et al. 2010. Mapping 3D pore scale fluid distributions:how rock resistivity is influenced by wettability and saturation history. Petrophysics , 51 (2) : 102-117. |
| [] | Liu T Y, Fu R S, Wang S M. 2003. On a new conducting model combining rock wettability. Well Logging Technology , 27 (2) : 99-103. |
| [] | Looyestijn W J, Hofman J. 2006. Wettability-index determination by nuclear magnetic resonance. SPE Reservoir Evaluation & Engineering , 9 (2) : 146-153. |
| [] | Mao Z Q, Zhang C G. 1995. The study of capillary and electrical properties of porous rock samples at reservoir conditions. Progress in Geophysics , 10 (1) : 77-91. |
| [] | Mao Z Q, Zhang C G, Lin C Z. 1997. The effect of wettability of reservoir on the log-derived water saturation. Well Logging Technology , 21 (1) : 50-54. |
| [] | Morgan W B, Pirson S J. 1964. The effect of fractional wettability on the Archie saturation exponent. //SPWLA 5th Annual Logging Symposium. Midland, Texas. |
| [] | Mungan N, Moore E J. 1968. Certain wettability effects on electrical resistivity in porous media. Journal of Canadian Petroleum Technology , 7 (1) : 20-25. DOI:10.2118/68-01-04 |
| [] | Ouyang J, Mao Z Q, Xiu L J, et al. 2009. Study on Genetic Mechanism and Evaluation Method Via Well Logs in Low-Contrast Reservoirs[M]. Beijing: Petroleum Industry Press . |
| [] | Rasmus J C. 1986. A summary of the effect of various pore geometries and their wettabilities on measured and in situ values of cementation and saturation exponent. //SPWLA 27th Annual Logging Symposium. Houston, Texas. |
| [] | Sondenaa E, Bratteli F, Normann H P, et al. 1991. The effect of reservoir conditions, and wettability on electrical resistivity. //SPE Asia-Pacific Conference. Perth, Australia. |
| [] | Stalheim S O, Eidesmo T, Rueslatten H. 1999. Influence of wettability on water saturation modeling. Journal of Petroleum Science and Engineering , 24 (2-4) : 243-253. DOI:10.1016/S0920-4105(99)00046-7 |
| [] | Sweeney S A, Jennings H Y Jr. 1960. Effect of wettability on the electrical resistivity of carbonate rock from a petroleum reservoir. The Journal of Physical Chemistry , 64 (5) : 551-553. DOI:10.1021/j100834a009 |
| [] | Tiab D, Donaldson E C. 1996. Petrophysics[M]. Houston, TX: Gulf Publishing . |
| [] | Trantham J C, Clampitt R L. 1977. Determination of Oil Saturation After Waterflooding in an Oil-Wet Reservoir the North Burbank Unit, Tract 97 Projiec. Journal of Petroleum Technology , 29 (5) : 491-500. DOI:10.2118/5802-PA |
| [] | Wang C T, Cai M L, Han X H, et al. 2008. SY/T 5385-2007, Measurement and calculation methods of rock resistivity paramenters in laboratory[M]. Beijing: Petroleum Industry Press . |
| [] | Wang K W, Li N. 2009. Numerical simulation on effects of reservoir characteristics and saturation on T2 spectra of nuclear magnetic resonance. Acta Petrolei Sinica , 30 (3) : 422-426. |
| [] | Xiao L, Mao Z Q, Wang Z N, et al. 2012. Application of NMR logs in tight gas reservoirs for formation evaluation:A case study of Sichuan basin in China. Journal of Petroleum Science and Engineering , 81 : 182-195. DOI:10.1016/j.petrol.2011.12.025 |
| [] | Yang C M, Li H Q, Lu D W, et al. 2005. The relationship between rock resistivity and water saturation in water-drive-oil and oil-drive-water process. Journal of Jilin University (Earth Science Edition) , 35 (5) : 667-671. |
| [] | Zhang G Q, Huang C C, Hirasaki G J. 2000. Interpretation of wettability in sandstones with NMR analysis. Petrophysics , 41 (3) : 223-233. |