 2017, Vol. 60


2 Jiangsu Collaborative Innovation Center for Climate Change, Nanjing University, Nanjing 210023, China
Tropical cyclones (TCs) are synoptic weather systems that form over warm tropical or subtropical oceans, which consist of organized convections and non-frontal cyclonic circulations. Among the worldwide TC genesis regions, the western North Pacific (WNP) is not only the most frequent TC genesis region, but also the only ocean region where TC activities can be observed year round. Strong and super strong TCs are most likely to occur over this region. TCs approaching coastal areas and making landfall are often accompanied with strong wind gusts, rainstorms and storm surges, resulting in catastrophic losses and economic damages (Wang et al., 2005).
Specific oceanic and atmospheric conditions are a prerequisite for TC genesis and development. This is why the atmospheric circulation and ocean thermal condition can modulate TC activities. On the other hand, the feedback of TC activities also affects the atmospheric circulation and ocean thermal condition, so frequent TC activities have certain climatic effects. In recent years, numerous TC climatology studies have been conducted with a focus on the modulation of TC activities by atmospheric and oceanic conditions (Chan et al., 1985; Lin et al., 2004; Webster et al., 2005; Chen et al., 2006a; Ma et al., 2006; Zhou et al., 2009; Song et al., 2010; Guan et al., 2011). However, studies of the direct feedback of TC activities on climate are still very limited. Feedback of TC activities on the large-scale environment includes feedback on the atmosphere and on the ocean. TCs moving over the warm ocean surface induce strong surface winds and cyclonic convergences, which can lead to large vertical mixing and cooling in the upper ocean surface layer and downward heat flux transport. These heat fluxes are then transported poleward through ocean circulations (Sriver et al., 2007; Sriver et al., 2008), affecting ocean heat balance and climate. TCs can significantly change the atmospheric circulation within their influential area. In particular, strong wind gusts and precipitation accompanying TCs have important impacts on regional weather and climate (Kubota et al., 2009). In addition, after their formation over the tropical oceans, TCs move northward, bringing huge amounts of heat and moisture to the middle and high latitudes. Such kinds of energy transport and dissipation from the tropics to extra tropics by TCs exert pronounced impacts on global energy transport and distribution as well as energy balance.
Emanuel (2001) first raised the opinion that TC activities could greatly affect global climate via their influences on ocean heat transport. Wang and Chan (2002) found that TC activities made great contributions to interannual variability of the atmospheric circulation. Ha (2013) indicated that the total kinetic energy of TC enhances significantly during El Niño, and the poleward transport of kinetic energy induced by TCs becomes larger and persisted longer, and can reach higher latitudes than normal, suggesting that the influence of TCs on the meridional transport of atmospheric kinetic energy has an interannual variability associated with the ENSO cycle.
Sobel and Camargo (2005) first revealed TC impacts on the mean climate state using regression analysis. In their study, atmospheric and oceanic fields were regressed on ACE, which was used as an index to represent TC activity intensity. Based on the variation feature that is consistent in all the lag regressed environmental fields, they suggested that TC activities on a weekly time scale are closely related to ENSO signal, and TC activities could affect the ENSO cycle. However, they also pointed out that the feedback of TCs on a weekly time scale is possibly underestimated since the feedback of TCs is a complicated and slow-evolving process. In addition, TCs of different sizes might have different influences on large-scale environment. Therefore, it is necessary to use TC activities over a longer time period to investigate the influences of TCs on large-scale environment. In the present study, monthly average ACE is used as the index of TC activities to investigate the TC feedback on large-scale environment. Differences and relationships between the results using weekly and monthly ACE as index are also investigated.
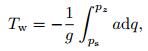
2 DATA AND METHODData used in the present study include the best TC track data in the WNP for the period of 1971–2000 published by the U.S. Joint Typhoon Warning Center (JWTC), the NCEP/NCAR reanalysis product with the horizontal resolution of 2.5°×2.5°(Kalnay et al., 1996), the daily outgoing longwave radiation (OLR) product provided by NOAA Climate Prediction Center (CPC) (Liebmann et al., 1996), the CPC Merged Analysis of Precipitation (CMAP) (Xie et al., 1997), and the Reynolds sea surface temperature (SST) data with a spatial resolution of 1°×1°(Reynolds et al., 2002). Vertical integration from the surface to 300 hPa of water vapor mixing ratio extracted from the NCEP reanalysis product is taken as the column water vapor content. The calculation is expressed as
|
(1) |
where q is the mixing ratio, p is the pressure, g is the gravitational acceleration, ps is the surface pressure, pz is the pressure at z level, Tw is the column water vapor with the unit of mm.
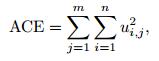
Following the approach of Sobel and Camargo (2005), ACE is also used in the present study as an index to represent the intensity of TC activity. According to Bell (2000), ACE is defined as the sum of the squares of the maximum sustained surface wind speed (knots) measured every six hours for all named storms that reach the tropical storm strength. ACE is expressed as
|
(2) |
where n is the number of records for each individual TC, m is the TC frequency, ui, j is the wind speed at the ocean surface with the unit of m·s-1. Higher frequency, longer lifetime and stronger intensity always correspond to larger accumulated TC energy.
ACE is a physical variable that describes the TC intensity over its entire lifetime, and can be used as the index to study TC influences on climate. ACE is a physical variable that describes the TC intensity during its entire lifetime, and can be used as the index to study the TC impact on climate. Note that ACE gives a relatively high weight to the records of stronger intensity during the lifetime of a specific TC.
In the present study, multiple environmental variables are lag regressed on time series of monthly ACE anomalies at leads and lags within a two-month range (hereafter denoted by M -2, M -1, M0, M + 1 and M + 2). Statistically significant signals of TC influence on the environment are extracted to discuss influences of TC activities on large-scale environment on the weekly and monthly time scales. The relation and differences between the TC influences at the two time scales are also investigated.
3 INTERPRETATION OF REGRESSION ANALYSIS RESULTS 3.1 Relative Vorticity at 850 hPaFigure 1 displays the relative vorticity at 850 hPa lag regressed on monthly ACE anomalies. A zonally extending belt of positive vorticity is found to the north of the equator, while a corresponding belt of negative vorticity is located to the south of the equator. From M-2 to M0, the positive vorticity belt obviously intensifies and moves northwestward, consistent with the moving direction of most TCs in the WNP. Similarly, the negative vorticity belt also intensifies but moves southeastward. The intensity of the positive and negative vorticity belt reaches their maximum at M0. From M0 to M + 2, however, the positive and negative vorticity belts both weaken and move southeastward. Different to the results of Sobel and Camargo (2005), which were obtained by regressing the environmental variables on ACE anomalies on a weekly time scale, results of the present study indicate that from M + 1 to M + 2, the positive and negative vorticity belts to the north and south of the equator demonstrate a distinct dipole pattern, particularly in the M + 2 when the signal of the dipole pattern reaches its maximum. This is possibly indicative of the ENSO signal. Warm SST anomalies (SSTA) in the equatorial central eastern Pacific can induce abnormal westerlies to the west of the warm SSTA region and result in the formation of cyclonic circulation symmetrical about the equator as shown in Fig. 1d and Fig. 1e, which actually reflects the Rossby wave response to SSTA in the equatorial central eastern Pacific (Gill, 1980). Thereby, regression of 850 hPa relative vorticity on ACE on the monthly scale can better represent the atmospheric response to El Niño induced by warm SSTA in the equatorial central eastern Pacific.

|
Fig. 1 Lag regression of monthly relative vorticity at 850 hPa on ACE (a) M-2, (b) M-1, (c) M0, (d) M + 1, (e)M +2. M0 rep-resents simultaneous correlation, M-1 indicates ACE lags behind the relative vorticity by one month, M +1 means ACE leads the relative vorticity by one month, and the similar for M-2 and M + 2. The amplitude represents the correlation corresponding to one standard deviation of ACE anomaly. |
The regressed zonal winds in the surface are presented in Fig. 2, which shows large westerly wind anomalies near 120°E–160°W, 10°S–10°N at all leads and lags out to one and two months. From M - 2 to M0, the westerly wind anomalies intensify and move northwestward, consistent with the moving direction of most TCs in the WNP. Meanwhile, weak easterly wind anomalies appear to the north of the westerly wind anomalies, which first intensify and then weaken from M-2 to M + 2. Note that from M - 2 to M + 2, both the intensity and scope of easterly wind anomalies over the Maritime Continent (MC) and the Indian Ocean continuously increase, whereas the increase in the intensity is not the same distinct in the regression results on the weekly time scale. In addition, both the intensity and scope of the zonal winds regressed on the monthly scale are larger than that regressed on the weekly scale, which suggests that the interaction between TCs and the large scale environment is more significant on the monthly scale. In their studies of the relation between TC and surface westerly wind anomalies in the equatorial region, Keen (1982) and Lander (1990) found that strong westerly anomalies are sometimes associated with tropical cyclones pairing on both sides of the equator. Although the pair of tropical cyclones rarely occurs, the studies of Harrison (1991) and Kindle (1995) suggested that single TC can also trigger surface westerly wind anomalies over the equatorial region. The above studies clearly show that the surface westerly wind anomalies over the equatorial region are associated with TC activities. The results of the present study cannot show that the surface westerly wind anomalies over the equatorial region are directly triggered by TC activities, but it can be deduced that TCs near the equator with high intensity and long lifetime have positive impacts on triggering and intensifying the westerly wind anomalies in the surface.

|
Fig. 2 Same as Fig. 1, but for surface zonal wind |
The column water vapor regressed on the ACE index is displayed in Fig. 3, which shows that from M-2 to M0, positive moisture anomalies intensify and move northwestward, while negative moisture anomalies maintain over the MC region and intensify continuously. This is possibly because that following the TC genesis and development, huge amounts of water vapor are transported from the MC to WNP. From M0 to M + 2, positive moisture anomalies weaken and retreat to the east of 160°E, while negative moisture anomalies still maintain over the MC and further extend northeastward, covering the entire Philippine Sea and superimposing the area of TC genesis and development. Different to the regression results at weekly time scale, the distribution of column water vapor on the monthly time scale is similar to SST distribution that corresponds to El Niño. It is worth noting that OLR, volumetric water vapor content, precipitation and SST etc. all demonstrate a distribution feature corresponding to El Nin

|
Fig. 3 Same as Fig. 1, but for total column water vapor |
Figure 4 shows that negative OLR anomalies are located near the equator. From M-2 to M0, the area of negative OLR anomalies becomes larger and moves northwestward as a whole, which is similar to changes in the column water vapor shown in Fig. 3. However, different to the column water vapor content, negative OLR anomalies extend eastward continuously, and reach near 85°W in M0. From M-2 to M + 2, positive OLR anomalies intensify and move northwestward as a whole. Compared to the results on the weekly time scale, positive OLR anomalies on the monthly time scale extend further northeastward and cover the area of TC genesis and development. Based on the changes from M + 1 to M + 2 shown in Fig. 3 and Fig. 4, it can be found that the column water vapor decreases while OLR increases in the TC genesis region, which to a certain degree reduces the potential for TC genesis over this region. This result is consistent with that of Sobel and Camargo (2005). Such kinds of atmospheric effects with column water vapor decrease and OLR increase are attributed partly to direct TC influences and partly to indirect effects of SST decrease.

|
Fig. 4 Same as Fig. 1, but for OLR |
Figure 5 presents precipitation regressed on the ACE index. From M-2 to M0, positive anomalies intensify and move northwestward as a whole, which indicates that the TC rain belt moves northwestward following the TC movement. Significant negative anomalies remain over the MC and intensify from M-2 to M0, suggesting that precipitation decreases continuously in this region. This is consistent with the fact that convective precipitation moves northwestward as a whole following the TC track. Similarly, the rain belt retreats southeastward from M0 to M + 2, but the negative precipitation anomalies continue to exist over the MC while the maximum precipitation area moves northeastward. This pattern of precipitation distribution is quite similar to SST distribution pattern, indicating that tropical precipitation is associated with ENSO.

|
Fig. 5 Same as Fig. 1, but for precipitation |
SST regressed on the ACE index is displayed in Fig. 6, which shows typical El Niño features in all the five panels. Warm SSTA appears over the equatorial central eastern Pacific, cold SSTA appears in the equatorial western Pacific, and the warm SSTA extends from the low latitudes near the dateline to the Pacific Northwest of U.S. with a southwest-northeast orientation. This spatial pattern of SST distribution indicates that ENSO and ACE are closely associated with each other. ENSO is the strongest signal of interannual variability of the atmosphere and ocean in the tropical Pacific, thereby it imposes strong modulation on ACE.

|
Fig. 6 Same as Fig. 1, but for SST |
The warm SSTA in the equatorial central eastern Pacific persists through the entire period from M-2 to M + 2 and the scope of largest SSTA gradually increases. Such a slow intensification of the warm SSTA indicates that El Niño is developing. The sea surface warming in the equatorial region is a result of the dynamic ocean response to westerly wind anomalies in the surface. Zonal wind distribution in the surface shows that distinct westerly wind anomalies occur near the equatorial region from 120°E–140°W and remain there from M-2 to M + 2, which intensify the warm SSTA in the equatorial central eastern Pacific. Gao (1998) argued that TCs in the equatorial region could promote the El Niño development via intensifying surface westerly wind anomalies and triggering Kelvin waves. Although there is still not sufficient evidence to support the above assumption, the consistent lag regression patterns of various environmental variables on the ACE index shown in the present study indicate that those high-intensity, long-lifetime TCs near the equator have positive effects on triggering or intensifying surface westerly wind anomalies in this region, which will subsequently intensify the El Niño that is developing. The El Niño event in turn will increase SSTA over the tropical oceans near the dateline and to its east, which is consistent with the assumption of Bjerknes (1969). Although the SST decrease caused by the cold tail effect of typhoon only occurs over a small area, it can be spread to a large area through the conduction of ocean and atmosphere. Effects of such feedback do not occur instantaneously but with a certain lag, which explains why the signal of TC influences on large-scale environment is more pronounced at the monthly time scale.
Figure 7 and Fig. 8 are longitude-time cross sections of SST and surface zonal winds regressed on ACE from M-6 to M + 6. In general, SST and zonal winds both slowly increase with time, and the increase is particularly significant for SST. However, in certain time periods, they also present a rapid increasing trend. Zonal wind increases rapidly at around M-1 while SST rapidly increases at M0. Meanwhile, the area of zonal wind increase is largely located to the west of the dateline within 20°longitude, while the SST increase mainly occurs near the dateline and to its east. The slow increases in SST and zonal winds represent the continuous developing process of ENSO. On the one hand, the strongest zonal wind and SSTA occur be-tween M0 and M + 6 possibly because ENSO usually reaches its peak in winter in the northern hemisphere while TC activities (i.e. the ACE signal) reach the maximum in the summer and autumn. The correlation coefficient between monthly ACE anomaly and Niño- 3.4 monthly index (see Fig. 9) also increases during the period from M-6 to M + 5 and reaches the largest between M + 4 and M + 5, which is consistent with the fact that ENSO reaches its peak in winter and TCs are most active in summer and autumn. On the other hand, the rapid increases of zonal wind at around M-1 and SST at around M0 reflect the direct influences of TC on the large-scale environment, and the delayed response of SST compared to that of zonal wind is possibly attributed to the eastward propagation of oceanic Kelvin waves. Since the SST response lags behind that of the zonal wind by about one month, and the distance between their responsive areas is about 6000 km, the propagation speed of the Kelvin waves can be estimated based on the above information. The result is consistent to the Kelvin wave speed of 2.3 m·s-1 proposed by Hendon (1998), which also further confirms the results of Sobel and Camargo (2005).

|
Fig. 7 Longitude-time cross section of SST regressed on ACE in the equatorial region (5.5°S–5.5°N average) at the monthly time scale from M-6 to M + 6. Positive lag means ACE leads SST |

|
Fig. 8 Same as Fig. 7, but for surface zonal wind |

|
Fig. 9 Variation of correlation coefficient between monthly ACE anomaly and monthly Niño-3.4 index from M-6 to M + 6, where positive lag means ACE leads Niño-3.4 |
In the present study, multiple oceanic and atmospheric variables such as the relative vorticity in the lower troposphere and winds and SST etc. are regressed on time series of monthly ACE anomalies at various leads and lags out to two months. Statistically significant influence signals of TCs on their large-scale environment are extracted to discuss TC impacts on the large-scale environment on the monthly time scale. Differences and relationships between the TC impacts on the weekly and monthly time scales are also investigated. Major results are as follows.
(1) The time scale of ENSO cycle is much larger than that of TC activity period. Thereby the modulation of TC by ENSO is significant. The regressions of environmental variables on the series of ACE anomaly mainly show the signal of ENSO cycle. On the monthly time scale, OLR, column water vapor content, precipitation, and SST etc. all demonstrate a distinct feature corresponding to ENSO. In contrast, on the weekly time scale, only the SST pattern shows a feature of ENSO. Differences of these environmental variables between the monthly and weekly time scales indicate that TC activities on the monthly time scale are more closely associated with ENSO signals over the Pacific.
(2) Both the intensity and the scope of zonal wind regressed on the ACE on the monthly time scale are larger than that on the weekly time scale, suggesting that the interaction between TC activities and large scale environment is more significant on the monthly time scale. The surface westerly anomalies in the equatorial region promote the El Niño development via intensifying SSTA in the equatorial central eastern Pacific. Those high-intensity, long-lifetime TCs near the equator impose positive effects on triggering or intensifying surface westerly anomalies in the equatorial region.
(3) One to two months after the genesis of TCs, the column water vapor content over the TC genesis region decreases while OLR increases, which to a certain degree reduces the potential for TC genesis. Although SST decreases induced by TCs only occur over a small area, they can be spread to a larger area through the oceanic and atmospheric propagation, exhibiting a feedback effect. Such feedback does not occur instantaneously but with a certain lag, which explains why the signal of TC influences on large-scale environment is more pronounced on the monthly time scale.
TC influences on the large-scale environment depend on its intensity and size. Therefore, it is necessary to introduce into ACE the effect of TC size for the purpose to more precisely describe changes in TC intensity and better reveal the TC feedback on large-scale environment.
ACKNOWLEDGMENTSThis work was supported by the National Natural Science Foundation of China (41430426), and the R & D Special Fund for Public Welfare Industry (Meteorology) (GYHY201306025).
| [] | Bell G D, Halpert M S, Schnell R C, et al. 2000. Climate assessment for 1999. Bull. Amer. Meteor. Soc. , 81 (6) : S1-S50. DOI:10.1175/1520-0477(2000)81[s1:CAF]2.0.CO;2 |
| [] | Chen G H, Huang R H. 2006. The effect of warm pool thermal states on tropical cyclone in west northwest Pacific. Journal of Tropical Meteorology , 22 (6) : 527-532. |
| [] | Chan J C L. 1985. Tropical cyclone activity in the northwest Pacific in relation to the El Niño/Southern Oscillation phenomenon. Mon. Wea. Rev. , 113 (4) : 599-606. DOI:10.1175/1520-0493(1985)113<0599:TCAITN>2.0.CO;2 |
| [] | Eisenman I, Yu L S, Tziperman E. 2005. Westerly wind bursts:ENSO's tail rather than the dog?. J. Climate , 18 (24) : 5224-5238. DOI:10.1175/JCLI3588.1 |
| [] | Emanuel K. 2001. Contribution of tropical cyclones to meridional heat transport by the oceans. J. Geophys. Res. , 106 (D14) : 14771-14781. DOI:10.1029/2000JD900641 |
| [] | Gao S Y, Wang J S, Ding Y H. 1988. The triggering effect of near-equatorial cyclones on El Niño. Adv. Atmos. Sci. , 5 (1) : 87-95. DOI:10.1007/BF02657349 |
| [] | Gill A E. 1980. Some simple solutions for heat-induced tropical circulation. Quart. J. Roy. Meter. Soc. , 106 (449) : 447-462. DOI:10.1002/(ISSN)1477-870X |
| [] | Guan H, Wang H J, Zhou L, et al. 2011. A numerical simulation study on the typhoon-ocean interaction in the South China Sea. Chinese J. Geophys. , 54 (5) : 1141-1149. DOI:10.3969/j.issn.0001-5733.2011.05.001 |
| [] | Ha Y, Zhong Z, Hu Y J, et al. 2013. Influences of ENSO on western North Pacific tropical cyclone kinetic energy and its meridional transport. Journal of Climate , 26 (1) : 322-332. DOI:10.1175/JCLI-D-11-00543.1 |
| [] | Harrison D E, Giese B S, et al. 1991. Episodes of surface westerly winds as observed from islands in the western tropical Pacific. J. Geophys. Res. , 96 (S01) : 3221-3237. DOI:10.1029/90JC01775 |
| [] | Hendon H H, Liebman B, Glick J D. 1998. Oceanic Kelvin waves and the Madden-Julian oscillation. J. Atmos. Sci. , 55 (1) : 88-101. DOI:10.1175/1520-0469(1998)055<0088:OKWATM>2.0.CO;2 |
| [] | Kalnay E, Kanamitsu M, Kistler R, et al. 1996. The NCEP/NCAR 40-Year Reanalysis Project. Bull. Am. Meteor. Soc. , 77 (3) : 437-497. DOI:10.1175/1520-0477(1996)077<0437:TNYRP>2.0.CO;2 |
| [] | Keen R A. 1982. The role of cross-equatorial tropical cyclone pairs in the Southern Oscillation. Mon. Wea. Rev. , 110 (10) : 1405-1416. DOI:10.1175/1520-0493(1982)110<1405:TROCET>2.0.CO;2 |
| [] | Kindle J C, Phoebus P A. 1995. The ocean response to operational westerly wind bursts during the 1991-1992 El Niño. J. Geophys. Res. , 100 (C3) : 4893-4920. DOI:10.1029/94JC02392 |
| [] | Kubota H, Wang B. 2009. How much do tropical cyclones affect seasonal and interannual rainfall variability over the western North Pacific. J. Climate , 22 (20) : 5495-5510. DOI:10.1175/2009JCLI2646.1 |
| [] | Lander M A. 1990. Evolution of the cloud pattern during the formation of tropical cyclone twins symmetrical with respect to the equator. Mon. Wea. Rev. , 118 (5) : 1194-1202. DOI:10.1175/1520-0493(1990)118<1194:EOTCPD>2.0.CO;2 |
| [] | Liebmann B, Smith C A. 1996. Description of a complete (interpolated) outgoing longwave radiation dataset. Bull. Am.Meteor. Soc. , 77 : 1275-1277. |
| [] | Lin H J, Zhang Y C. 2004. Climatic features of the tropical cyclone influencing China and its relationship with the sea surface temperature in the Pacific Ocean. Journal of Tropical Meteorology , 20 (2) : 218-224. |
| [] | Ma L P, Chen L S, Xu X D. 2006. On the characteristics of correlation between global tropical cyclone activities and global climate change. Journal of Tropical Meteorology , 22 (2) : 147-154. |
| [] | Reynolds R W, Rayner N A, Smith T M, et al. 2002. An improved in situ and satellite SST analysis for climate. J.Climate , 15 : 1609-1625. DOI:10.1175/1520-0442(2002)015<1609:AIISAS>2.0.CO;2 |
| [] | Sobel A H, Camargo S J. 2005. Influence of western North Pacific tropical cyclones on their large-scale environment. J.Atmos. Sci. , 62 (9) : 3396-3407. DOI:10.1175/JAS3539.1 |
| [] | Song J J, Wang Y. 2010. Some characteristics on extratropical transition of tropical cyclones over the Western North Pacific. Journal of Nanjing University (Natural Sciences) , 64 (3) : 328-336. |
| [] | Sriver R L, Huber M. 2007. Observational evidence for an ocean heat pump induced by tropical cyclones. Nature , 447 (7144) : 577-580. DOI:10.1038/nature05785 |
| [] | Sriver R L, Huber M, Nusbaumer J. 2008. Investigating tropical cyclone-climate feedbacks using the TRMM Microwave Imager and the Quick Scatterometer. Geochem. Geophys. Geosyst. , 9 : Q09V11. DOI:10.1029/2007GC001842 |
| [] | Sriver R L. 2013. Observational evidence supports the role of tropical cyclones in regulating climate. Proc. Natl. Acad.Sci. USA , 110 (38) : 15173-15174. DOI:10.1073/pnas.1314721110 |
| [] | Wang B, Chan J C L. 2002. How strong ENSO events affect tropical storm activity over the western North Pacific. J.Climate , 15 (13) : 1643-1658. DOI:10.1175/1520-0442(2002)015<1643:HSEEAT>2.0.CO;2 |
| [] | Wang J B, Qian W H. 2005. Statistic analysis of tropical cyclone impact on the China mainland during the last half century. Chinese J. Geophys. , 48 (5) : 992-99. |
| [] | Webster P J, Holland G J, Curry J A, et al. 2005. Changes in tropical cyclone number, duration, and intensity in a warming environment. Science , 309 (5742) : 1844-1846. DOI:10.1126/science.1116448 |
| [] | Xie P, Arkin P A. 1997. Global precipitation:a 17-year monthly analysis based on gauge observations, satellite estimates, and numerical model outputs. Bull. Am. Meteor. Soc. , 78 (11) : 2539-2558. DOI:10.1175/1520-0477(1997)078<2539:GPAYMA>2.0.CO;2 |
| [] | Yu R S, Weller R A, Liu W T. 2003. Case analysis of a role of ENSO in regulating the generation of westerly wind bursts in the western equatorial Pacific. J. Geophys. Res. , 108 : 3128. DOI:10.1029/2002JC001498 |
| [] | Zhou B T, Cui X. 2009. Modeling the influence of spring Hadley circulation on the summer tropical cyclone frequency in the western North Pacific. Chinese J. Geophys. , 52 (12) : 2958-2963. DOI:10.3969/j.issn.0001-5733.2009.12.004 |