 2017, Vol. 60


2 National Engineering Laboratory for Exploration and Development of Low-Permeability Oil & Gas Fields, Xi'an 710018, China
Tight gas reservoir is defined with permeability of reservoir less than 0.1 mD (1 mD=0.987×10⁻³ μm2), which is completely different from conventional sandstone reservoir with high porosity (Zou et al., 2011). Therefore, the rock physics model is quite different from the conventional model. It requires us to develop adapted rock physics model to characterize the tight gas reservoir. As we know, rock is a multiphase material of solid frame saturated with pore fluid. Its effective properties generally are characterized by the following parameters: solid frame modulus of dry rock, pore fluid modulus and environmental factors (such as pressure, temperature, wave frequencies et al.). The goal of developing rock physics theory is to find the relation among these parameters, moreover, we prefer to simplify the complicated parameters for the field reservoir based on some assumptions so that we could quantitatively analyze the relations between the petrophysical parameters (porosity, saturation et al.) and effective elastic properties. The rock physics model can be divided into effective medium theory and wave propagation theory (Chen et al., 2009; Liu, 2009; Yang and Cao, 2009; Ma et al., 2010; Ba, 2013). Generally, if effective medium theory is considered to predict effective elastic modulus quantitatively in a proper way, we need to specify the volume fraction of each components, the elastic modulus of mineral components, and the distribution of mineral components. However, if only volume fraction of mineral components and elastic properties of mineral are known, the elastic modulus bounds can be predicted. If the accurate effective elastic modulus is expected, then we also need to learn the detailed geometry of rock frame. The iso-stress model, known as similar to a series model, could calculate the ratio of average stress to average strain when the stress on each component is equal (Reuss, 1929). The iso-strain model, known as a parallel model, gives the ratio of stress to average strain when the strain is equal on each component (Voigt, 1910). The Voigt-Reuss-Hill average model considers the arithmetic mean of upper bound of Voigt model and lower bound of Reuss model to estimate the effective modulus of rock (Hill, 1952). The Hashin-Shtrikman bound, calculating the effective modulus of rock by exchanging the rock components, is the narrowest bound limit of rock without knowing detailed geometry.
When the seismic wave propagates through the complicated porous medium, the rock frame saturated with fluid could generate corresponding response. Therefore, it leads us to utilize the seismic wave propagation theory to predict the elastic properties of rock.
Biot (1956a, b) firstly developed the porous medium theory. His most important contribution is to theoretically predict the existence of slow P-wave. White (1975) proposed the seismic dispersion and energy attenuation theory at the mesoscopic scale in the porous rock with gas bubble model. Then both porosity and crack density are considered as the function of effective elastic model to directly estimate the elastic properties of porous-crack medium with explicit mathematical equations (Eshelby, 1957; Walsh, 1965; O'Connell and Budiansky, 1974; Kuster and Toksoz, 1974; Hudson, 1980, 1981, 1994). Dutta and Ode (1979) merged the Biot model into White model. Moreover, they symmetrically deduced the coupled motion equations when the seismic wave passes through the solid porous rock frame with saturated fluid under the condition of abolishing the assumption of White model. Therefore, the relationship between the attenuation coefficient varying with frequency and gas saturation and the size of gas bubble is quantitatively deduced. Pride and Berryman (2003a, b) discussed the linear motion feature of double porosity double permeability model from wave constitutive equations and sonic attenuation and fluid motion equations. Mavko and Nur (1975) argued that the squirt flow may occur in the micro-scale when the seismic wave propagates through the fluid-saturated porous rock. Therefore, BISQ model is proposed, to some degree, to interpret the spectrum energy attenuation and velocity dispersion of P-wave and S-wave for the field data. In addition, Ba et al. (2012), starting from classic Hamilton theory, characterized the local fluid perturbation caused by P-wave in partially saturated rock using Rayleigh theory. Yang and Chen (2001) discussed BISQ model in the multi-porous model. Nie et al. (2010) studied the velocity dispersion and energy attenuation in the low porosity and low permeability shaly sandstone.
The laboratory measurement is the most reliable option to obtain geophysical data. Generally, the measured ultrasonic data enable us to calculate the elastic properties of rock (Shi et al., 1995; Jiang and Shi, 1998; Wu et al., 2000; Wang et al., 2006). The specific workflow is as follows: (1) implementing the ultrasonic measurement on core samples, developing the relation between the measured parameters (porosity, saturation, and density) and elastic parameters (velocity, Poisson's ratio etc.); (2) fluid substitution, understanding the fluid type effect on the velocity dispersion and energy attenuation; (3) developing reasonable and simplified rock physical model, and then applying it in the exploration.
Rock physics model aims at solving the elastic parameters prediction, fluid substitution, and optimized parameters determination to improve the precision of reservoir prediction. Currently, Xu-White model (1995, 1996) is primarily applied to the shaly sandstone to predict the elastic properties. This model considers the porosity, pore shape, and clay volume to predict the velocity. However, due to the low porosity and low permeability of shaly sandstone, Xu-White model cannot fairly characterize its elastic properties (Bai et al., 2010; Zhao et al., 2012). Therefore, a novel rock physical model of characterizing the elastic properties of shaly sandstone is required. Brie et al. (1995) studied the relationship between the rock frame of tight sandstone and the variation of exponent e. Their advantage of fit between measured and calculated data will directly affect the accuracy of predicted rock parameters (Jiang et al., 2015).
This paper explicitly analyzes the laboratory data of Sulige field. Meanwhile, the Brie model is applied to fit the measured data. As a result, the suitable rock physical model is developed to calculate the elastic properties of Sulige field. According to the law of rock physical parameters varying as gas saturation, it can guide us to implement the gas exploration of Sulige field.
2 ROCK PHYSICAL MODEL OF TIGHT GAS SANDSTONE 2.1 Laboratory Measurement AnalysisSulige gas field at Ordos Basin belongs to typical "low porosity and low permeability" reservoir. The acoustic impedance difference between reservoir and cap rock layers is very weak (Yang et al., 2013). In order to study the geophysical parameters relations in this area, 51 samples from 17 wells of He8 reservoir of Shihezi formation in Permian Period of the Paleozoic Era are laboratory measured. Finally, total 304 group data of P-wave, S-wave and Possion's ratio etc. are acquired, which are measured under varying water saturation (Table 1). Rock physical model for Sulige gas field is developed based on the analysis of the relations between the gas saturation and P-wave velocity, S-wave velocity, Poisson's ratio, QP and QS. Therefore, it can provide theoretical basis for the reservoir prediction. The laboratory measurement procedure is similar with the references (Wu et al., 2000; Wang et al., 2006). The measuring temperature is 105 ℃, confining pressure is 29 MPa. The measurement misfit of P-wave and S-wave is 1% and 2%, respectively. The spectral amplitude method is applied to calculate the Q value, the misfit is about 10%. The ultrasonic dominant frequency is 1 MHz. According to the related research (Sothocott et al., 2000), at high and low frequencies, although the variation magnitude of both the wave velocity and attenuation is different, the general variation trend is same.
|
|
Table 1 Statistics of measurements of rock samples from Sulige field |

The measured data are classified based on the porosity distribution. Five groups of data with different ranges of porosity (unit: %) are listed: 3.81~4.20, 4.96~5.62, 6.44~7.19, 8.27~8.48, and 9.7~10.8. Moreover, the crossplot between the gas saturation degree and P-wave velocity, S-wave velocity, Poisson's ratio, QP, and QS are analyzed. After correct the abnormal measured point, the classified data are specifically analyzed as follows:
(1) The relations between the P-wave velocity and gas saturation
Figure 1 shows that the decrement rate of P-wave velocity of high porosity sandstone gradually increases with the increment of gas saturation. Moreover, the P-wave velocity is obviously slower than that of low porosity sandstone. Fig. 2 indicates that S-wave velocity slightly increases with the increment of gas saturation, while the increment trend is not obvious.

|
Fig. 1 P-wave velocity VP versus gas saturation (Sg) from five sets of rock samples |

|
Fig. 2 S-wave velocity VS versus gas saturation (Sg) from five sets of rock samples |
(2) The relations between attenuation and gas saturation
Figure 3 suggests that, the Q value of P-wave trends to be small as the increment of porosity, it means that the attenuation is more intensive. If we correct the measured misfit for porosity group data from 6.44% to 7.19%, it can be observed that Q value of P-wave firstly increases, then it starts to decrease till the gas saturation reaches 60%~70%, the Q value of P-wave reaches maximum. Subsequently, the Q value of P-wave gradually decreases as the increment of gas saturation.

|
Fig. 3 Quality factors of the P-wave (QP) versus gas saturation from five sets of rock samples |
Figure 4 shows that Q value of S-wave decreases as the increment of gas saturation when the porosity ranges from 3.81% to 4.2%. While the Q value of S-wave is kind of complicated when the porosity ranges from 4.96% to 7.19%, we think that individual points are randomized due to the measurement misfit. The porosity instead of gas saturation degree has vital impact on the Q value of S-wave.

|
Fig. 4 Quality factors of the S-wave (QS) versus gas saturation from five sets of rock samples |
(3) The relations between the Poisson's ratio and gas saturation
Figure 5 suggests that the Poisson's ratios are distributed widely when the gas saturation degree is equal. Moreover, the variation trend is more complicated. However, the dataset suggests that the higher gas saturation degree, the less Poisson's ratio. In addition, the Poisson's ratio decreases slowly when the gas saturation is less than 40%, while it decreases gradually faster as the gas saturation is up to 40%. The following conclusions are summed up after comprehensively analyzing these five groups of measured data:

|
Fig. 5 Poisson's ratio (σ) versus porosity (ψ) and gas saturation based on five sets of rock samples |
① The higher the porosity, the less the P-wave velocity; the higher the gas saturation, the less the P-wave velocity.
② The higher the porosity, the less the S-wave velocity; for the equal porosity, the S-wave velocity slightly increases as the increment of gas saturation.
③ The higher the porosity, the less the Q value of P-wave; for the equal porosity, the Q value of P-wave decreases as the increment of gas saturation.
④ The higher the porosity, the less the Q value of S-wave; for the equal porosity, the Q value of S-wave slightly varies as the increment of gas saturation.
⑤ The Poisson's ratio decreases as the gas saturation increases for the different porosity sandstone. The above laboratory measurement suggests that the relations between the gas saturation and P-, S-wave velocity, attenuation and Poisson's ratio represent linear negative correlation. Hence, it is suitable to apply these rock physical relations to constrain the seismic data when predicting the reservoir target zone. Meanwhile, the well log data from 19 wells of He8 reservoir at Sulige gas field indicates that Poisson's ratio decreases as the increment of gas saturation (Fig. 6). In addition, the Poisson's ratio of the gas layer is less than that of dry or gas-bearing water layer. The combination between the ultrasonic measurement and sonic well log not only provides laboratory basis, but also gives us a hint to determine the parameters of rock physics model.

|
Fig. 6 Poisson's ratio versus gas saturation based on the rock physics data using 34 points from 19 wells in Sulige gas field |
The elastic property of rock sample is primarily determined by the minerals. Therefore, the strata parameters, such as clay volume, porosity, permeability, oil saturation, and irreducible water saturation can be calculated from well log data. Further, there are two options to predict the elastic properties of reservoir rock: one is theoretical rock physics model. Specifically, we need to understand the elastic property of each mineral component, even the detailed geometry of rock frame. The other is empirical rock physical model. If we cannot accurately obtain the elastic properties of each mineral component and detailed geometry of rock frame, the alternative option is to apply the limited measured data to develop related equations. Generally, the second method can directly solve our concern, however, it costs much. Therefore, above two methods are combined together to work in the field case. Namely, we firstly establish the empirical relations between the unknown elastic parameters and physical parameters of rock samples by employing laboratory measurement. Then effective rock physics model adapting to the specific field is applied to estimate the elastic properties of target zone.
(1) Rock physics model for characterizing tight gas sandstone
The conventional rock physics model assumes that the porosity of rock is relatively high (20%~30%) (Wood, 1955), meanwhile, the rock is well connective and fully saturated. This classic model is suitable to characterize the sandstone with high porosity and high permeability. Specifically, the Wood equation is
|
(1) |
where Kg and Kw are gas bulk modulus and water bulk modulus, respectively. Sg and Sw are gas saturation and water saturation, respectively. In addition, Sg +Sw = 1.
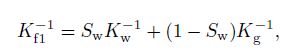
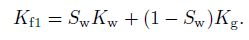
Domenico (1977) argued that Wood's equation cannot fairly characterize some laboratory data when the pore fluid is distributed inhomogeneously in the low porosity rock. Therefore, a gas-fluid mixture method is proposed to calculate its bulk modulus,
|
(2) |
Then Brie (1995) discovered that the tight gas sandstone has the same properties, so he modified Eq.(2) as
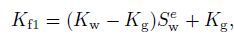
|
(3) |
where Kg and Kw are gas bulk modulus and water bulk modulus, respectively. Sw is water saturation. e is empirical coefficient.
According to Eq.(3), the difference of bulk modulus between gas and water is 2.5 GPa as shown in Fig. 7. Generally, the tight gas sandstone has low porosity and low gas saturation. Meanwhile, the bulk modulus difference between gas reservoir and surrounding layer is only 0.8 GPa (Huang, 2012; Yang, 2013). The bulk modulus difference between gas-saturated sandstone and water-saturated sandstone is 0.9 GPa for the Sulige gas field of Ordos Basin (Yang, 2013).

|
Fig. 7 Relationship between fluid saturation and bulk modulus in the Brie equation (from Brie et al., 1995) |
(2) Empirical parameter determination of rock physics model related to tight gas sandstone
For the elastic property of double phase or multiphase fluid mixture, the Brie equation is similar to the Wood's equation when e is high (Fig. 8). The bulk modulus varies dramatically as the e changes. Generally, e ranges from 1 to 3. The accurate value still needs to be measured in the laboratory. Based on above measured data, the relation between gas saturation and bulk modulus, and Poisson's ratio can be optimized. The results indicate that with e = 2 the Brie model is suitable to estimate the elastic property of Sulige gas field.

|
Fig. 8 Poisson's ratio (σ) changes with gas saturation (Sg) of He8 tight sand reservoir, the Sulige gas field |
Sulige gas reservoir at Ordos Basin is typical lithology reservoir, He8 reservoir of Shihezi formation can be classified into upper and lower section. The sandstone deposited at river channel primarily contains quartz, which is higher than 90%. The porosity ranges from 4% to 14%, and the average porosity is 8.8%; the permeability is from 0.05 × 10⁻³ to 5 × 10⁻³ μm2, the average permeability is 0.73 × 10⁻³ μm2. It is a typical low porosity and low permeability reservoir (Yang et al., 2013). Based on the rock feature of He8 reservoir and rock structure, we need to choose an effective rock physics model (Xu-White model etc.). The rock is primarily composed of matrix and pore fluid. The rock frame includes shaly frame and sandstone frame, the primary mineral of shaly frame is dry clay, while sandstone frame is quartz and carbonate. Therefore, Voigt-Reuss-Hill model is applied to calculate the elastic properties of rock frame. Then according to the rock structure feature of He8 reservoir, the differential effective medium theory is employed to calculate the cement effect on the elastic properties. Moreover, the property of single phase of fluid is estimated by using Han and Batzle (2004) model. According to the analysis of measured data, the parameter e in the Eq.(3) is set as 2, hence, the elastic property of double phase or multi-phase is calculated by using Brie equation (Brie et al., 1995). Finally, the Gassmann's equation is applied to calculate the elastic properties, and seismic response of isotropic rock with fully saturated fluids can be simulated.
3.1 Forward Modeling Prediction of Elastic ParametersThe conventional well log data is applied to predict the related elastic curve when the rock physics model is developed (Zhao et al., 2012; Yang et al., 2013). Moreover, the rock physics model can be also used to implement the fluid substitution and invasion correction. Based on above mentioned work flow of developing rock physics model and calculated bulk modulus, we compared the inverted curve with the measured curve (Fig. 9). The Gamma curve and well diameter; electrical resistance; density, compensated neutron logging instrument, and time difference of sonic wave; and clay volume and lithology profile are shown from the 1st trace to the 4th trace. While the comparison between the modeled curve and measured data for time difference of P-wave, S-wave, density and VP/V§ ratio are successively displayed from trace 5th to trace 8th. The blue solid line represents the measured data, while the red solid line indicates the forward modeling curve. It can be seen that correlation is high, there is slight difference for only a few section between the forward modeling curve and measured data. It suggests that forward modeling is reliable.

|
Fig. 9 Elastic curve of forward modeling vs. measured elastic curve from the well Sxx in the Sulige gas field |
Predicting the velocity of rock with required saturated-fluid from the velocity of rock with known saturated fluid is one of the most important functions for the rock physics analysis. Namely, when the elastic property of dry rock frame is constant, the velocity of porous rock could vary with different saturated fluid. Biot-Gassmann is frequently applied to perform the fluid substitution. Generally, the pore pressure can increase when the seismic wave passes through the porous rock. However, the continuous increment of pore pressure resists the compressibility. Therefore, the rock frame could be stiffer. Biot-Gassmann model is written as
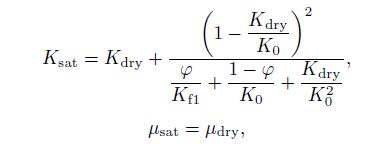
|
(4) |
where Kdry is the effective bulk modulus of rock frame; Ksat is the effective bulk modulus of fully saturated rock; K0 is the bulk modulus of composited minerals ψ is porosity; μdry is the effective shear modulus of rock frame; μsat is the effective shear modulus of fully saturated fluid.
According the actual temperature and pressure at the Sulige gas reservoir, the specific mineral volume, porosity, and saturation conditions are set to perform the forward modeling. Fig. 10 displays the fluid substitution of using Biot-Gassmann model for the well Sxx of He8 reservoir. It successively displays the Gamma curve and well diameter; electrical resistance; density, compensated neutron logging instrument, and time difference of sonic wave; and clay volume and lithology profile from the 1st trace to the 4th trace. While the comparison between the forward curve and measured data for time difference of P-wave, S-wave, density and VP/V§ ratio are successively displayed from trace 5th to trace 8th. The red solid line represents the porous rock with full gas saturation, while the blue solid line indicates 100% water saturation. It can be seen that the velocity different is 400 m·s-1 between the full water saturation case and original full gas saturation, the difference of VP/V§ ratio is about 0.1. Therefore, the P-wave velocity, density and VP/V§ ratio dramatically vary when the fluid substitution is performed, while the S-wave velocity is almost stable.

|
Fig. 10 Fluid substitution result of the well Sxx in the Sulige gas field |
AVO forward modeling is employed to analyze the attributes response of Sulige gas reservoir (Fig. 11). The reflection amplitude of He8 reservoir increases as the increment of incident angle for the gas saturation condition (Fig. 11a). However, the reflection amplitude of He8 reservoir keeps almost constant when the rock is fully water-saturated (Fig. 11b). It suggests that Sulige gas field belongs to typical class Ⅲ AVO, which provides an solid rock physics basis to seek "bright spot" reservoir.

|
Fig. 11 AVO modeling analysis of fluid replacement in Sulige gas field (a) Gas saturation of He8 reservoir; (b) Water saturation of He8 reservoir. |
Figure 12 shows the fluid substitution of using Hilterman's method for the He8 reservoir. The impedance changes from intensive amplitude to the moderate amplitude, but the variation with incident angle is insignificant; the reflection amplitude of Poisson's ratio changes from intensive to weak, while the gradient with incident angle varies from wide-angle to moderate-angle. It suggests that the impedance of small incident angle is more sensitive to the response of gas-water interface, while the Poisson's ratio of wide incident angle is more sensitive to response of gas-water interface. Therefore, it is proved that both impedance and Poisson's ratio have a vital impact on the AVO in the tight gas sandstone reservoir. Impedance and Poisson's ratio are independent from each other, hence, the comprehensive use of these two parameters can play an important role in the prediction of elastic parameters in the tight gas sandstone reservoir.

|
Fig. 12 Acoustic impedance and Poisson's ratio response analysis from fluid replacement of He8 reservoir in Sulige gas field (a) Gas saturation of He8 reservoir; (b) Water saturation of H8 reservoir. |
The crossplot of Poisson's ratio and P-wave impedance suggests that Poisson's ratio is the primary parameter of rock sensitivity (Fig. 13), which can fairly separate the shaly sandstone and sandstone (Poisson's ratio boundary is about 0.24). Poisson's ratio and impedance are sensitive to reservoir response: both the Poisson's ratio of gas saturated reservoir (less than 0.20) and impedance (less than 1200 g·cm-3×m·s-1) is low. Therefore, application of both Poisson's ratio inverted from prestack seismic data and crossplot of Poisson's ratio and impedance can fairly predict the lithology, gas saturation etc. (Yang et al., 2013; Wang et al., 2014).

|
Fig. 13 Poisson's ratio vs. P-wave impedance in Sulige gas field |
Sulige gas field is located at desert area of Ordos Basin, the surface condition of north gas field is good. Therefore, three-component 3D full seismic data (103 km2) and three-component 2D full seismic data (5360 km) are acquired. The multi-component seismic processing is tackled (Yang et al., 2013; Wang et al., 2014), then the high quality stacking profiles of P-and S-wave prestacking data are obtained. Considering the developed rock physics model adapting to the Sulige gas field, we apply the joint P-and S-wave inversion to make parameters crossplots of different parameters, as well as P-and S-wave attenuation features to explore the prediction of gas and water distribution in tight reservoir. Fig. 14 displays the crossplot of Poisson's ratio inverted from multi-component seismic prestack joint inversion, P-and S-wave attenuation profiles. Poisson's ratio can fairly represent the lithology, which can separate the sandstone (red, yellow and part green) and shale (grey blue and blue). The crossplot of Poisson's ratio and P-wave impedance can predict the abnormality of gas saturation zone, namely, it can separate the gas (red) and water (black) saturation zone. P-wave attenuation profiles are sensitive to the fluid saturation, which shows the regular distribution of gas saturation zone, while the S-wave is not sensitive. Intensive abnormality (yellow and red) indicates that the distribution of high porosity sandstone is strongly inhomogeneous. There are 13 wells in this profile (S1-S13), which are classified as gas well, gas-water well, low production well and water well. They represent typical water-gas distribution of Sulige gas field. Only two wells display that the theoretical prediction is conflict with field data. It suggests that proposed theoretical rock physics model works fairly well at the Sulige gas field.

|
Fig. 14 Sections of Poisson's ratio, P-wave impedance vs. Poisson's ratio, P-wave attenuation, and S-wave attenuation in Sulige gas field |
According to four types of fluid features (gas well, gas-water well, low production well and water well) in Fig. 14, we developed four types of seismic attribute responses as follows:
(1) The reservoir layer is good gas layer. Gas production well is commercial gas flow well: the seismic attribute response is low Poisson's ratio, the crossplot of P-wave impedance and Poisson's ratio represents high positive abnormality. Intensive P-wave is attenuated; intensive S-wave is attenuated. Fig. 14 shows that both S6 and S13 are commercial gas flow well (the gas production is 14.7 and 9.8 ten thousand cubic meter/day). While the attenuation of both P-and S-wave for well S7 is not obvious, but the gas production is 4.5 thousand cubic meter/day which conflicts with prediction of using seismic attributes.
(2) The reservoir is gas-water layer. The well produces gas and water. The seismic response is low Poisson's ratio, it is abnormal for the crossplot of P-wave impedance and Poisson's ratio. P-wave attenuation is intensive, S-wave attenuation is moderate and intensive. Fig. 14 shows that both S4 and S9 produce gas and water (gas production is 2.1 and 3.1 ten thousand cubic meter/day, respectively). However, the S-wave is not clearly attenuated which also conflicts with the prediction of using seismic attributes.
(3) Reservoir layer is low production type. All gas wells are low production well: seismic response is moderate-weak Poisson's ratio, there is no abnormality in the crossplot of P-wave impedance and Poisson's ratio, moderate and P-wave attenuation is intensive, while S-wave attenuation is moderate and weak, it indicates that lithology is not good. Fig. 14 shows that well S2, S8, S10 and S12 are low gas production wells (gas production is 0.108, 0.8, 1.4 and 1.5 ten thousand cubic meter/day).
(4) The gas reservoir layer is water-production type, gas production well also produced fluid; The seismic response is moderate-weak Poisson's ratio, the crossplot between the P-wave impedance and Poisson's ratio is negative abnormal, the P-wave attenuation is moderate and intensive, S-wave absorption is moderate and weak, it suggests that the reservoir is water-saturated. Fig. 14 shows that well S1, S3 and S5 are water-saturated (gasproduction is 1.5, 0.27, and 0.36 ten thousand cubic meter/day, while the water production is 42, 21.5, and 3 cubic meter/day).
4 CONCLUSIONSThrough measuring the tight sandstone samples of He8 reservoir of Shihezi formation and analyzing rock physics properties based on porosity classification, we elaboratively study the relations between the gas saturation and elastic properties based on the classification of porosity range. We suggest that Brie model (e = 2) is suitable to characterize the elastic properties of tight sandstone of Sulige gas field. The relation between the Poisson's ratio and gas saturation is negative linear correlation, while the Wood's equation is unable to predict the elastic properties varying with the gas saturation higher than 20%. Therefore, Brie model provides a solid theoretical basis to perform the tight reservoir prediction. Based on the proposed rock physics model, four types of seismic response induced by four types of pore fluids are developed for the Sulige gas field by applying the joint P-and S-wave inversion, tight sandstone sensitive parameter crossplot analysis, and characterization of Pand S-wave attenuation. Moreover, we perform an exploratory research on the gas and water distribution of Sulige gas field. Our theoretical prediction fairly fits with the field data.
ACKNOWLEDGMENTSThis work was supported by the National Natural Science Foundation of China (41390451). We appreciate the contribution of Cai Kehan to the figure plots.
| [] | Ba J. 2013. Progress and Review of Rock Physics (in Chinese)[M]. Beijing: Tsinghua University Press . |
| [] | Ba J, Carcione J M, Cao H, et al. 2012. Velocity dispersion and attenuation of P waves in partially-saturated rocks:Wave propagation equations in double-porosity medium. Chinese J. Geophys. (in Chinese) , 55 (1) : 219-231. DOI:10.6038/j.issn.0001-5733.2012.01.021 |
| [] | Ba J, Yan X F, Chen Z Y, et al. 2013. Rock physics model and gas saturation inversion for heterogeneous gas reservoirs. Chinese J. Geophyss. (in Chinese) , 56 (5) : 1696-1706. DOI:10.6038/cjg20130527 |
| [] | Bai J Y, Song Z X, Su L, et al. 2012. Error analysis of shear-velocity prediction by the Xu-White model. Chinese J. Geophys. (in Chinese) , 55 (2) : 589-595. DOI:10.6038/j.issn.0001-5733.2012.02.021 |
| [] | Biot M A. 1956a. Theory of propagation of elastic waves in a fluid-saturated porous solid.Ⅰ. Low-frequency range. The Journal of the Acoustical Society of America , 28 (2) : 168-178. DOI:10.1121/1.1908239 |
| [] | Biot M A. 1956b. Theory of propagation of elastic waves in a fluid-saturated porous solid. Ⅱ. Higher frequency range. The Journal of the Acoustical Society of America , 28 (2) : 179-191. DOI:10.1121/1.1908241 |
| [] | Brie A, Pampuri F, Marsala A F, et al. 1995. Shear sonic interpretation in gas-bearing sands. //SPE Annual Technical Conference and Exhibition. Dallas, Texas: SPE. |
| [] | Chen Y, Huang T F, Liu E R. 2009. Rock Physics (in Chinese)[M]. Hefei: Press of University of Science and Technology of China . |
| [] | Domenico S N. 1977. Elastic properties of unconsolidated porous sand reservoirs. Geophysics , 42 (7) : 1339-1368. DOI:10.1190/1.1440797 |
| [] | Dutta N C, Odé H. 1979. Attenuation and dispersion of compressional waves in fluid-filled porous rocks with partial gas saturation (White model, ) Part Ⅰ-Biot theory. Geophysics , 44 (11) : 1777-1788. DOI:10.1190/1.1440938 |
| [] | Eshelby J D. 1957. The determination of the elastic field of an ellipsoidal inclusion and related problems. Proceedings of the Royal Society A:Mathematical, Physical and Engineering Sciences , 241 (1226) : 376-396. DOI:10.1098/rspa.1957.0133 |
| [] | Gao J H, Yang S L, Wang D X. 2008. Quality factor extraction using instantaneous frequency at envelope peak of direct waves of VSP data. Chinese J. Geophys. (in Chinese) , 51 (3) : 853-861. |
| [] | Han D H, Batzle M L. 2004. Gassmann's equation and fluid-saturation effects on seismic velocities. Geophysics , 69 (2) : 398-405. DOI:10.1190/1.1707059 |
| [] | Hashin Z, Shtrikman S. 1963. A variational approach to the theory of the elastic behaviour of multiphase materials. Journal of the Mechanics and Physics of Solids , 11 (2) : 127-140. DOI:10.1016/0022-5096(63)90060-7 |
| [] | Hill R. 1952. The elastic behaviour of a crystalline aggregate. Proceedings of the Physical Society, Section A , 65 (5) : 349-354. DOI:10.1088/0370-1298/65/5/307 |
| [] | Hilterman F J. 2006. Seismic Amplitude Interpretation (in Chinese). Sun X P, Zhao L W, et al. , trans. Beijing: Petroleum Industry Press. |
| [] | Huang X D, Li M. 2012. Poroelastic and Hydrocarbon Detection (in Chinese)[M]. Beijing: Petroleum Industry Press . |
| [] | Hudson J A. 1980. Overall properties of a cracked solid. Mathematical Proceedings of the Cambridge Philosophical Society , 88 (2) : 371-384. DOI:10.1017/S0305004100057674 |
| [] | Hudson J A. 1981. Wave speeds and attenuation of elastic waves in material containing cracks. Geophysical Journal International , 64 (1) : 133-150. DOI:10.1111/j.1365-246X.1981.tb02662.x |
| [] | Hudson J A. 1994. Overall properties of a material with inclusions or cavities. Geophysical Journal International , 117 (2) : 555-561. DOI:10.1111/gji.1994.117.issue-2 |
| [] | Jiang L X, Shi X J. 1998. Relation between wave velocity in sandstone and fluid content in porous medium under high frequency condition. OGP (in Chinese) , 33 (3) : 355-362. |
| [] | Jiang R, Zeng Q C, Huang J Q, et al. 2015. Tight gas saturation detection by most sensitive AVO attributes with rock physics analysis. Science Technology and Engineering (in Chinese) , 15 (1) : 163-167. |
| [] | Kuster G T, Toksz M N. 1974. Velocity and attenuation of seismic waves in two-phase media:Part Ⅰ, Theoretical formulations. Geophysics , 39 (5) : 587-606. DOI:10.1190/1.1440450 |
| [] | Li W X, Shi G, Wang H, et al. 2007. The study on the relationships of elastic properties of rock physics. Progress in Geophysics (in Chinese) , 22 (5) : 1380-1385. |
| [] | Liu H J. 2009. Summarization of seismic rock physics research. Petroleum Geophysics (in Chinese) , 7 (3) : 1-8. |
| [] | Ma S F, Han D K, Gan L D, et al. 2010. A review of seismic rock physics models. Progress in Geophys. (in Chinese) , 25 (2) : 460-471. DOI:10.3969/j.issn.1004-2903.2010.02.012 |
| [] | Mavko G, Nur A. 1975. Melt squirt in the asthenosphere. Journal of Geophysical Research , 80 (11) : 1444-1448. DOI:10.1029/JB080i011p01444 |
| [] | Nie J X, Yang D H, Ba J. 2010. Velocity dispersion and attenuation of waves in low-porosity-permeability anisotropic viscoelastic media with clay. Chinese J. Geophys. (in Chinese) , 53 (2) : 385-392. DOI:10.3969/j.issn.0001-5733.2010.02.016 |
| [] | O'Connell R J, Budiansky B. 1974. Seismic velocities in dry and saturated cracked solids. Journal of Geophysical Research , 79 : 5412-5426. |
| [] | Pride S R, Berryman J G. 2003a. Linear dynamics of double-porosity dual-permeability materials. Ⅰ. Governing equations and acoustic attenuation. Physical Review E , 68 (3) : 036603. DOI:10.1103/PhysRevE.68.036603 |
| [] | Pride S R, Berryman J G. 2003b. Linear dynamics of double-porosity dual-permeability materials. Ⅱ. Fluid transport equations. Physical Review E , 68 (3) : 036604. DOI:10.1103/PhysRevE.68.036604 |
| [] | Reuss A, Berechnung der, Fliess grenzen von. 1929. Mischkristallen auf Grund der Plastizitätsbedingung für Einkristalle. Zeitschrift für. Angewandte Mathematik und Mechanik , 9 (1) : 49-58. DOI:10.1002/(ISSN)1521-4001 |
| [] | Shi G, Shen W L, Yang D Q. 2003. The relationship of wave velocities with saturation and fluid distribution in pore space. Chinese J. Geophys. (in Chinese) , 46 (1) : 138-142. |
| [] | Shi X J, Xu G M, Jin P, et al. 1995. The laboratory study of influence of water saturation on rock's velocity and attenuation. Acta Geophysica Sinica (in Chinese) , 38 (Suppl. Ⅰ) : 281-287. |
| [] | Sothcott J, McCann C, O'Hara S G. 2000. The influence of two different pore fluids on the acoustic properties of reservoir sandstones at sonic and ultrasonic frequencies. //SEG Technical Program Expanded Abstracts. SEG: 1883-1886. |
| [] | Voigt W. 1910. Lehrbuch der Kristallphysik[M]. Leipzig: Teubner . |
| [] | Walsh J B. 1965. The effect of cracks on the compressibility of rock. J. Geophys. Res. , 70 (2) : 381-389. DOI:10.1029/JZ070i002p00381 |
| [] | Wang D X, Xin K F, Li Y M, et al. 2006. An experimental study of influence of water saturation on velocity and attenuation in sandstone under stratum conditions. Chinese J. Geophys. (in Chinese) , 49 (3) : 908-914. |
| [] | Wang D X, Zhang M B, Chen J, et al. 2014. Application of multi-wave seismic in tight sandstone gas reservoir exploration. OGP (in Chinese) , 49 (5) : 946-953. |
| [] | White J E. 1975. Computed seismic speeds and attenuation in rocks with partial gas saturation. Geophysics , 40 (2) : 224-232. DOI:10.1190/1.1440520 |
| [] | Wood A B. 1955. A Textbook of Sound[M]. New York: the MacMillan Co . |
| [] | Wu X Y, Chen Z A, Wei J X. 2000. A technique for measuring ultrasonic velocity and attenuation spectra. Chinese Journal of Rock Mechanics and Engineering (in Chinese) , 19 (S1) : 895-898. |
| [] | Xu S Y, White R E. 1995. A new velocity model for clay-sand mixtures. Geophysical Prospecting , 43 (1) : 91-118. DOI:10.1111/gpr.1995.43.issue-1 |
| [] | Xu S Y, White R E. 1996. A physical model for shear-wave velocity prediction. Geophysical Prospecting , 44 (4) : 687-717. DOI:10.1111/gpr.1996.44.issue-4 |
| [] | Yang D H, Chen X H. 2001. BISQ model for fluid-filled, porous medium. OGP (in Chinese) , 36 (2) : 146-159. |
| [] | Yang H, Wang X S, Wang D X, et al. 2013. Sulige Gas Field Multi-Wave Seismic Exploration in a Key Technology (in Chinese)[M]. Beijing: Petroleum Industry Press . |
| [] | Yang Z F, Cao H. 2009. Review of progresses in seismic rock physics. Progress in Geophys. (in Chinese) , 24 (3) : 893-899. DOI:10.3969/j.issn.1004-2903.2009.03.011 |
| [] | Zhao L X, Chen K G, Wang W W, et al. 2012. New Technology of Acoustic Logging and Application Practice (in Chinese)[M]. Beijing: Petroleum Industry Press . |
| [] | Zou C N, Tao S Z, Hou L H, et al. 2011. Unconventional Oil and Gas Geology (in Chinese)[M]. Beijing: Geological Publishing House . |