2 Lanzhou Institute of Seismology, China Earthquake Administration, Lanzhou 730000, China
The geological structure of the Qinghai-Tibet Plateau is complex, reflecting the dynamic and kinematic processes that led to its formation. Numerous studies have focused on the plateau's evolution, including those using finite element analysis (Dai et al., 2011; Deng et al., 1990; Fu et al., 2000; Lu et al., 2004; Tapponnier and Molnar, 1976). These studies have shown that the main driving force behind the uplift of the Qinghai-Tibet Plateau is the continued northward movement of the Indian plate. Fu et al. (2000) concluded that extrusion processes have been characterised by inhomogeneous evolution mainly affected by the mechanical properties of the rock, boundary conditions, and denudation (Fu et al., 2000; Zhen et al., 2006). Chen and Ma (1995) showed that collision of the Indian and Eurasia plates drives movement of the Sichuan and Yunnan blocks to the southeast (Chen and Ma, 1995). Yang et al. (2006) simulated 3-D crust and mantle deformation in the Qinghai-Tibet Plateau region and found that it was characterized by the latitudinal difference controlled by the distance to the main collision zone and the longitudinal escape of crustal material. Zhang and Xu et al. (1995) used the viscoelastic power-law creep constitutive relationship to explore possible mechanisms of stress distribution in the Plateau. Wang et al. (2006) discussed the deformation movement of the active block using a 2-D finite element model constrained by Global Positioning System (GPS) data.
Cao et al. (2003) used the finite element method to investigate Qinghai-Tibet Plateau earthquake mechanisms, and showed that earthquake echoes occurred on the South-North Seismic Belt, possibly as a result of the regional stress field equilibrium and of the block's boundary force (external load). Chen et al. (2008a) simulated the impact of 1997 Mani MS7.5 earthquakes on the stability of the regional block system and found that the Coulomb failure stress on the block boundary zone increased at both ends of the fault. Similarly, in 2001, the Coulomb failure stress caused by a M8.1 earthquake increased by 2 MPa on the east-Kunlun fault (the middle section of the east Kunlun fault), while there was a 0.7 MPa increase on the faulted section of the Karakunlun fault zone following a MS6.9 earthquake. This loading of stress caused instability on the seismogenic faults (near the rupture strength), possibly triggering subsequent earthquakes. Chen et al. (2008b) suggested that the fault itself was in a rapid unloading process following the strong M7.5 event, while the Coulomb failure stress induced on the active fault zones may have played a major role in loading. The results showed that interaction between two strong earthquakes reflects the loading of stress and that the occurrence of one strong earthquake may accelerate the occurrence of the next strong earthquake, causing a chain of seismic events that continues until the regional strain energy reaches a low level.
These previous large-scale studies used finite element models in which each block was considered a uniform entity with one set of mechanical parameters; however, in reality blocks are inhomogeneous. In this study, the more sophisticated CRUST 1.0 model was used to run simulations. CRUST 1.0 can describe the 3-D structure of the whole model area to a resolution of 1° ×1°, with the crust divided into upper, middle, and lower layers. The model was applied to three regional earthquakes that occurred on different parts of the Plateau but with similar magnitudes (the Kunlun Mountain MS8.1 earthquake on 14 November 2001, the Wenchuan MS8.0 earthquake on 12 May 2008, and the Nepal MS8.1 earthquake on 25 April 2015), and finite element numerical simulations were used to compare their physical field characteristics.
2 DEVELOPMENT OF THE VISCOELASTIC MODEL 2.1 Model Area and EstablishmentThe model area included six blocks of the Qinghai-Tibet Plateau: the southern Tarim block, the southeastern Alxa block, the western Ordos block, the western South China block, the southern Yunnan-Burma, and the western Yunnan-Burma block. In total, these blocks incorporated 12 sub-blocks and 15 boundary zones (Zhang et al., 2003; Zhang et al., 2005). Among them, 8 were first-order boundaries, and 7 were secondary boundaries. The model area extended 2800 km east-west, and 1800 km north-south. From the CRUST 1.0 model we obtained the P-and S-wave velocities, medium density, and geometric parameters of the upper, middle, and lower crust in a 1° × 1° grid and used these parameters to calculate the Young's modulus and Poisson's ratio. For the upper crust, a fully elastic model was used, while a viscoelastic model was used for the middle and lower crust with viscosity of 1019 and 1020 Pa·s, respectively, and the viscosity of each layer was uniform. The upper, middle, and lower crustal models comprised 1521 entities.
2.2 Model MeshingThe ANSYS software system, which can provide hundreds of element types, was used to analyse external forces and the corresponding deformation. Given that the corresponding deformation was small, the solid187 element was preferred. The solid187 element is a high-order 3-D solid structure element with six intermediate nodes. It has second-order displacement interpolation precision, which can better represent irregular models and supports both large deformation and large strain. To describe the shear relaxation kernel function, G(t), and the volume relaxation kernel function, K(t), we used the Prony series form. For meshing, unstructured grids were divided into 488707 cells and 740841 nodes. The resulting tetrahedral elements had a mean length of 20 km.
2.3 Model Fault Parameter SettingsThe description of the fault zone took two forms: (1) the number of curves and lines (i.e., a fracture is connected with multiple lines of the line), and (2) a series of quadrilateral areas composed of different width zones (i.e., a description of the actual width of the fracture zone). The first form of rupture was given by Zhang (2005) as the width of the block boundary zone. To weaken the material parameters of all elements located in the boundary zones of these fault zones or blocks (Chen et al., 2011), fault parameters were set to: (1) Young's modulus=original Young's modulus/3, and a Poisson's ratio=original Poisson's ratio+0.02 for the upper crust elastic layer; and (2) Young's modulus=original Young's modulus/3, Poisson's ratio=the original Poisson ratio+0.02, and viscosity coefficient=the original viscosity coefficient/2 for the viscoelastic middle and lower crustal layers.
2.4 Model Boundary ConditionsGPS data for the model area were selected and necessary data interpolation was made for sparse areas (e.g., only a few data points were available for south of the Himalaya range; therefore, we added a number of control points). The GPS data were interpolated in a 2-D plane and the annual displacement of data points was obtained. The displacement boundary condition of the side boundary was restrained, and the vertical displacement condition was equivalent to the side boundary. The surface of the model was free, and the bottom surface of the crust was not displaced in the direction perpendicular to the Earth's surface. The horizontal displacement at tectonic syntaxis was constrained, where the horizontal displacement component was zero. The maximum northward annual displacement of the model's southern boundary may approach to 50 mm, and there were some differences in the size and direction of the displacement constraints in different areas on the side boundary of the model.
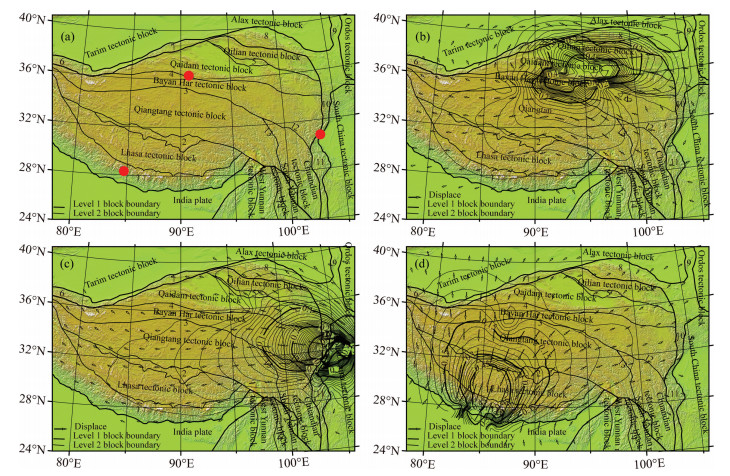
2.5 Seismic Fault Dislocation LoadingAccording to field investigation and coseismic data, the Kunlun Mountain MS8.1 earthquake (epicentre 90.90°E, 36.40°N) occurred along a left-lateral strike-slip fault with a steep dip angle (80°; Fig. 1a). The mean horizontal slip displacement was 6 m and the fracture length was 350 km (Chen et al., 2001). The Wenchuan MS8.0 earthquake (epicentre 103.40°E, 30.95°N) occurred along a dextral strike-slip fault (Xu et al., 2008) with a steep dip angle (60°). The fracture length was 260 km. Along the Sanjiang-Yingxiu section, the horizontal displacement was 0~3 m and the vertical displacement was 0~3.5 m. Along the Yingxiu-Pingyi section, the mean horizontal displacement was 3~3.5 m and the mean vertical displacement was 3.5~3.7 m. Along the Pingyi-Qingchuan section, horizontal displacement was 0~3.5 m and vertical displacement was 0~3.7 m. The Nepal MS8.1 earthquake (epicentre 84.70° E, 28.20°N) occurred along a reverse fault with an inclination of 11°, a total length of 120 km, and a maximum displacement of 3.5 m (Zhang et al., 2015). Since these earthquakes occurred within the boundary zone of the blocks, the width of the boundary zone was not less than 60 km. Seismic dislocation fault loading width was 60 km (30 km on each side of the fault) and the depth was 25 km (assuming a focal depth of 15 km). For slip dislocation, two walls were half-loaded in opposite directions. For the thrust or normal fault dislocation, only the upper wall was loaded. The seismic source depth was uniformly loaded to the top of the upper crust, and other directions were linearly attenuated with a minimum loading dislocation of 0.1 m.

|
Fig. 1 Three earthquakes location and co-seismic horizontal displacement patterns caused by three earthquakes in the upper crust (displacement unit: m) (a) The epicenter distribution; (b), (c) and (d) co-seismic displacement of 2001 Kunlun Mountain MS8.1, 2008 Wenchuan MS8.0 and 2015 Nepal MS8.1; 1. Himalayan zone; 2. Karakorum-Jiali belt; 3. Mani-Yushu belt; 4. East Kunlun Mountains; 5. West Qinling-Delhi belt; 6. West Kunlun belt; 7. Altyn belt; 8. Haiyuan-Qilian belt; 9. Helan belt; 10. Minjiang-Longmen Shan belt; 11. Anning River-Little River belt; 12. Xianshuihe belt; 13. Sanjiang belt; 14. Lancang River belt; 15. Red River belt. |
Since we used a viscoelastic model, a time step was used in the calculation. The reference time was set to 1900 and 10000 years was taken as the start year before the reference time. The characteristics of each earthquake were calculated in two steps: (1) before the earthquake; and (2) after earthquake dislocation loading.
3.1 Displacement Distribution CharacteristicsThe Kunlun Mountain MS8.1 earthquake occurred on 14 November 2001 along the middle section of the eastern Kunlun belt, on the boundary between the Bayan Har and Qaidam blocks. Based on our model, the mean horizontal displacement of the epicentre was 6 m, while the mean displacement of the upper crustal fracture surface was 5.9 m. Horizontal displacement larger than 0.4 m was distributed to the north and south of the earthquake rupture zone with a certain degree of oblique symmetry and inhomogeneity in the block. Displacement of over 1 cm extended across the central and northern areas of the Tibetan Plateau, with the south-eastern margin of the Tarim block acting as a strong attenuation zone (Fig. 1b). In the north, the direction of displacement extended west, while in the south it extended east, which is consistent with coseismic GPS observations (Wan et al., 2004); however, the modelled directions of displacement in some distal regions were different from previous observations.
The Wenchuan MS8.0 earthquake occurred on 12 May 2008 in the Bayan Har and South China blocks, along the border of the Minjiang-Longmen Shan zone. Our model showed that the mean displacement of the epicentre was 3.3 m, and that the horizontal displacement was more than 0.3 m, which are both consistent with past estimates, with the distribution area near symmetrical on both sides of the fault. Displacement of over 1 cm was also distributed on both sides of the fault zone (Fig. 1c). Distribution across the western area was significant and the northern boundary of Bayan Har block represented a significant attenuation zone. In contrast, the distribution of similar displacement in eastern regions was more restricted. In the southeast, the displacement direction was found to be northward, while in the east it was found to be north-north west, which is consistent with GPS coseismic displacement observations (Xu et al., 2010). Similar to the Kunlun Mountain MS8.1 earthquake, the block boundary represented a strong attenuation zone, and the asymmetric distribution of large-scale displacement confirmed inhomogeneity within the block.
The Nepal MS8.1 earthquake occurred on 25 April 2015 in the middle of the Himalayan belt. Our model showed a maximum dislocation of 3.5 m, consistent with the observed displacement of 3.6 m. Displacement larger than 0.3 m was mainly distributed within the central Lhasa block of the north-north eastern area of earthquake rupture. The square distribution decayed when passing each boundary zone. To the south, the direction of displacement was north-north east, while to the north it was southward (Fig. 1d). The earthquake mainly resulted in the southward movement of the Qinghai-Tibet Plateau.
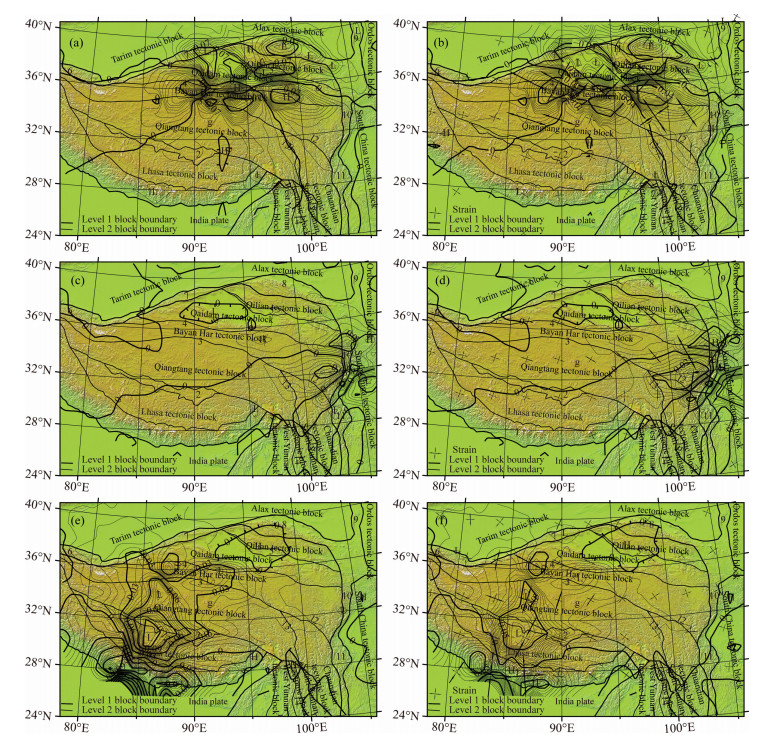
3.2 Strain Field Distribution CharacteristicsThe model showed two loading and two unloading areas caused by Kunlun Mountain MS8.1 earthquake. Unloading was located to the north and south of the rupture zone with negative values of equivalent strain (a decrease of 0.01 × 10⁻⁵ ~ 0.12 × 10⁻⁵) and maximum shear strain (a decrease of 0.01 × 10⁻⁵ ~ 0.07 × 10⁻⁵). Loading occurred at both ends of the rupture zone and showed positive values of equivalent strain (an increase of 0.01 × 10⁻⁵ ~ 0.12 × 10⁻⁵) and maximum shear strain (an increase of 0.01 × 10⁻⁵ ~ 0.07 × 10⁻⁵; Figs. 2a, 2b). In the five years post-dating the earthquake, 70% of Tibetan Plateau earthquakes over M5 and 90% of earthquakes over M6 occurred in loading areas or at junctions between loading and unloading areas.

|
Fig. 2 Distribution of coseismic equivalent strain and maximum shear strain caused by three earthquakes in the upper crust (×10-5) (a) and (b) coseismic equivalent strain and maximum shear strain of the 2001 Kunlun Mountain MS8.1, respectively; (c) and (d) co-seismic equivalent strain and the maximum shear strain of the 2008 Wenchuan MS8.0, respectively; (e) and (f) co-seismic equivalent strain and the maximum shear strain of the 2015, Nepal MS8.1, respectively. |
The model showed a loading zone and two unloading zones caused by the Wenchuan MS8.0 earthquake. The unloading area was located in the Sichuan basin (i.e., the eastern part of the Bayan Har Block and the northern part of the Sichuan-Yunnan block). The equivalent strain was reduced by 0.01 × 10⁻⁵ ~ 0.07 × 10⁻⁵, while the maximum shear strain decreased by 0.01 × 10⁻⁵ ~ 0.045 × 10⁻⁵. Loading areas were distributed at the two ends of earthquake rupture belt (i.e., the central and north-northwest regions of Sichuan-Yunnan, and the north central area of Minjiang-Longmen Shan [No.10] and the northern Anning River-Xiaojiang belt [No.11], respectively). The equivalent strain increased by 0.01 × 10⁻⁵ ~ 0.07 × 10⁻⁵, and the maximum shear strain increased by 0.01 × 10⁻⁵ ~ 0.045 × 10⁻⁵ (Figs. 2c, 2d). Subsequent earthquakes and their aftershocks, including the Yushu MS7.1 earthquake in 2010, the Lushan MS7.0 earthquake in 2013, and the Zhangxian MS6.7 earthquake in 2013, all occurred in loading areas.
The model showed both loading and unloading zones caused by the Nepal MS8.1 earthquake. Unloading was distributed within a large scale area to the north. The magnitude of the equivalent strain reduced by 0.01× 10⁻⁵ ~ 0.12× 10⁻⁵, and the maximum shear strain reduced by 0.01× 10⁻⁵ ~ 0.12× 10⁻⁵. Loading zones were distributed within the Himalaya belt. The equivalent strain increased by 0.01 × 10⁻⁵ ~ 0.09 × 10⁻⁵, and the maximum shear strain increased by 0.01 × 10⁻⁵ ~ 0.045 × 10⁻⁵ (Fig. 2e, 2f). Strong aftershocks (i.e., those of > M7) all occurred in loading areas.
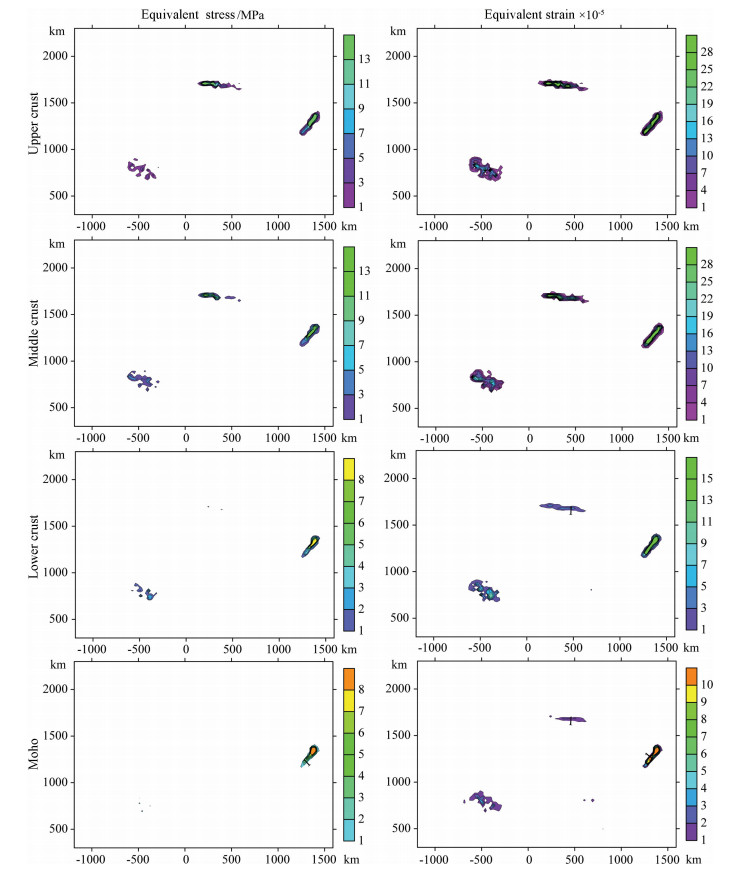
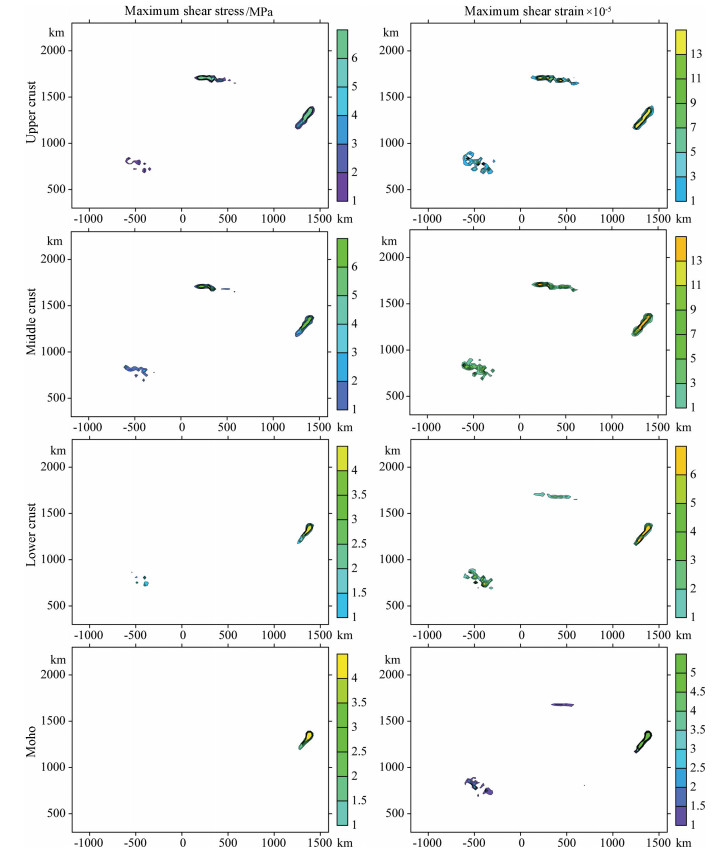
3.3 Stress and Strain Field DistributionsSimulating the distribution of stress and strain fields generated by earthquakes can help us to understand controls on the scale of dislocation (i.e., the relative displacement); or in other words, can help us to predict the level of stress and strain that will be released during an earthquake of a given size. The equivalent stress and strain, and the maximum shear stress and strain for the three earthquakes are shown in Fig. 3 and Fig. 4, the sizes of their source bodies are considered different. In particular, the stress and strain fields generated by the Wenchuan MS8.0 earthquake were distributed throughout the crust, but the stresses caused by the Kunlun Mountain and Nepal earthquakes were mainly distributed in the middle and upper crust, with the strain field weakened in the lower crust. This difference may reflect the nature of the seismic fault and the structure of the medium. The model showed that stress release from large earthquakes can be more than 10 MPa, while the maximum shear stress generated can be more than 6 MPa. The equivalent strain produced can reach 3.0×10⁻⁴, and the maximum shear strain can be greater than 1×10⁻⁴ (Fig. 3; Fig. 4).

|
Fig. 3 Distribution of equivalent stress and equivalent strain at different depths for the rupture belts of three large earthquakes: the 2001 Kunlun Mountain MS8.1, the 2008 Wenchuan MS8.0, and the 2015 Nepal MS8.1 |

|
Fig. 4 Distribution of maximum shear stress and maximum shear strain at different depths for the rupture belts of three large earthquakes: the 2001 Kunlun Mountain MS8.1 earthquake, the 2008 Wenchuan MS8.0 earthquake, and the 2015 Nepal MS8.1 earthquake |
In this study we used finite element modelling to simulate and analyse three large earthquakes that occurred in the Qinghai-Tibet Plateau region. Based on the results, we were able to draw a number of conclusions. Firstly, the Kunlun Mountain earthquake occurred along a pure strike-slip fault and the displacement and stress-strain fields were distributed in four quadrants. In contrast, the displacement and stress-strain fields associated with the Nepal earthquake showed a two-quadrant distribution, consistent with the fault model. The Wenchuan earthquake occurred along a reverse strike-slip fault, and its displacement and stress-strain fields were also distributed in four quadrants; however, the distribution characteristics were more complex than for the Kunlun Mountain and Nepal earthquakes. Secondly, large earthquakes change the surrounding stress and strain environments and form significant loading and unloading areas (positive and negative values). In the years following a large earthquake, most new seismic events and/or aftershocks occurred with stress and strain loading areas. Thirdly, large earthquakes can produce stress drops of more than 10 MPa and changes in strain of 2.5×10⁻⁴ or more. Clear differences in the spatial distributions of displacement and stress-strain fields reflect different seismic faults and deep crustal structures.
It is important to note that the accuracy and precision of finite element models depend on the accuracy and precision of input data (i.e., the internal structure of the Earth, boundary conditions, and seismic dislocations). High-density and high-precision data on the Earth's interior are needed to create accurate crustal structure and time-displacement models of crustal movement. Simulations such as those presented by this study, along with accurate fault dislocation data obtained using modern observation methods, improve our understanding of stress-strain loading and unloading following regional seismic events. Moreover, they provide new insights to assist with the forecasting of earthquakes in the Qinghai-Tibet Plateau seismogenic region.
ACKNOWLEDGMENTSThe authors thank Gan Wei-Jun (Institute of Geology, China Earthquake Administration), who provided valuable GPS data, and Yang Xing-Yue (Lanzhou Institute of Seismology, China Earthquake Administration) for his assistance with the finite element software. The authors also thank anonymous reviewers for providing feedback that has greatly enhanced this manuscript. This project was supported by the National Natural Science Foundation of China (41574044).
| [] | Cao X F, Yin J Y, Yang L M. 2003. Study of simulation for the evolution of stress field on north-south seismic belt in China. Northwestern Seismological Journal , 25 (3) : 221-225. |
| [] | Chen K P, Ma J. 1995. Numerical analysis of tectonic deformation by continental collision between India and Eurasia. Seismology and Geology , 17 (3) : 277-284. |
| [] | Chen L W, Zhang P Z, Lu Y Z, et al. 2008. Numerical simulation of loading/unloading effect on Coulomb failure stress among strong earthquakes in Sichuan-Yunnan area. Chinese J. Geophys. , 51 (5) : 1411-1421. |
| [] | Chen L W, Zhan Z M, Ye J Y, et al. 2011. Numerically modeling the influence of rheological properties on tectonic deformation of Tibet plateau. Journal of Geodesy and Geodynamics , 31 (3) : 8-14. |
| [] | Chen W B, Xu X W, Zhang Z J, et al. 2001. Preparatory field investigation on the surface deformation zone of the Qinghai-Xinjiang MS8.1 earthquake on Nov. 14, 2001. Northwestern Seismological Journal , 23 (4) : 313-317. |
| [] | Chen Z A, Lin B H, Bai W M. 2008. 3-D numerical simulation on influence of 1997 Mani earthquake occurrence to stability of tectonic blocks system in Qingzang and Chuandian zone using DDA+FEM method. Chinese J. Geophys. , 51 (5) : 1422-1430. |
| [] | Dai L M, Li S Z, Tao C H, et al. 2011. Three-dimensional numberical modeling of activity of the Longmenshan fault zone driven by the India Plate. Progress in Geophys. , 26 (1) : 41-51. DOI:10.3969/j.issn.1004-2903.2011.01.004 |
| [] | Deng Z C, Cui J W, Feng X F, et al. 1990. The analysis of tectonic dynamics and deformation mechanics of QinghaiXizang plateau by elastic finite element method. Bulletin of the Chinese Academy of Geological Sciences , 21 : 65-67. |
| [] | Fu R S, Xu Y M, Huang J H, et al. 2000. Numerical simulation of the compression uplift of the Qinghai-Xizang plateau. Chinese J. Geophys. , 43 (3) : 346-355. |
| [] | Lu S K, Cai Y E. 2004. Review of numerical simulation on the dynamics of Qinghai-Xizang plateau. Acta Seismologica Sinica , 26 (5) : 547-559. |
| [] | Tapponnier P, Molnar P. 1976. Slip-line field theory and large-scale continental tectonics. Nature , 264 (5584) : 319-324. DOI:10.1038/264319a0 |
| [] | Wan Y G, Wang M, Shen Z K, et al. 2004. Co-seismic slip distribution of the 2001 west of Kunlun mountain pass earthquake inverted by GPS and leveling data. Seismology and Geology , 26 (3) : 393-404. |
| [] | Wang H, Zhang G M, Shi Y L, et al. 2006. Numerical simulation of movement and deformation of Qinghai-Tibet plateau. Journal of Geodesy and Geodynamics , 26 (2) : 15-23. |
| [] | Xu S G, Xiong Y L, Liao H, et al. 2010. Static and kinematic analysis of coseismic deformation of Wenchuan MS8.0 earthquake. Journal of Geodesy and Geodynamics , 30 (3) : 27-30. |
| [] | Xu X W, Wen X Z, Ye J Q, et al. 2008. The MS8.0 Wenchuan earthquake surface ruptures and its seismogenic structure. Seismology and Geology , 30 (3) : 597-629. |
| [] | Yang L Q, Du J, Chen Y. 2006. Numerical modelling of the crust/mantle deformation in the Tibetan plateau. Earth Science Frontiers , 13 (5) : 360-373. |
| [] | Zhang B, Cheng H H, Shi Y L. 2015. Calculation of the co-seismic effect of MS8.1 earthquake, April 25, 2015, Nepal. Chinese J. Geophys. , 58 (5) : 1794-1803. DOI:10.6038/cjg20150529 |
| [] | Zhang D N, Xu Z H. 1995. An alternative interpret ation of earthquake activity caused by normal fault of upper crust in southern Qinghai-Xizang (Tibetan) plateau. Acta Seismologica Sinica , 17 (2) : 188-195. |
| [] | Zhang D N, Yuan S Y, Shen Z K. 2007. Numerical simulation of the recent crust movement and the fault activities in Tibetan Plateau. Chinese J. Geophys. , 50 (1) : 153-162. |
| [] | Zhang G M, Ma H S, Wang H, et al. 2005. Boundaries between active-tectonic blocks and strong earthquakes in the China mainland. Chinese J. Geophys. , 48 (3) : 602-610. DOI:10.1002/cjg2.693 |
| [] | Zhang P Z, Deng Q D, Zhang G M, et al. 2003. Active tectonic blocks and strong earthquakes in the continent of China. Science in China Series D:Earth Sciences , 46 (Supppl. 2) : 13-24. |
| [] | Zheng H W, Li Y D, Gao R, et al. 2006. The advance of numerical simulation in geodynamics. Progress in Geophys. , 21 (2) : 360-369. |
 2017, Vol. 60


