 2017, Vol. 60


2 Institute of Earthquake Science, China Earthquake Administration, Beijing 100036, China
In the study of seismo-electromagnetics, a lot of research results indicate that there are abnormal precursor signals of geoelectric field before earthquakes (Zhao et al., 1981; Uyeda et al., 2000; Varotsos and Alexopoulos, 1984a, b; Huang, 2011a; Ma, 2008; Ma et al., 2009, 2013). The method based on the seismo-electromagnetic signals is a good candidate method for short-term earthquake prediction. The VAN method, named after the initials of the founding Greek scientists, Varotsos, Alexopoulos and Nomikosinin the early 1980s, is the typical representative (Uyeda et al., 2009; Varotsos and Alexopoulos, 1984a, b; Varotsos et al., 2011a, b). Uyeda et al. have made the inspection with high evaluation that the "VAN" group nearly predicted all the earthquakes with magnitude M ≥ 5.5 successfully that occurred in Greece, and they even considered that the method had been the unique one of the short-term earthquake prediction in the world that continuously produce actual results during the period of thirty years, which is the most determined method in the world whether in empirical or theoretical aspects (Uyeda et al., 2009; Uyeda, 2011; Hayakawa and Hobara, 2010). However, it still have considerable challenges due to the complexity either in the seismogenic process or in the structure of the earth medium which cause the difficulties in understanding the following issues, such as the source of seismic electric signal (so called SES), the mechanism of the long distance transmission as well as the selectivity phenomenon of the signals among the observational points or stations and so forth. The questions about the SES propagation characteristics in underground medium, namely the signal transmission passages, have been studied in laboratory conditions or numerical simulation conditions in the passed 20 years (Park et al., 1996; Huang et al., 2010; Sarlis et al., 1999; Huang, et al., 1999; Ma et al., 2003; Ma, 2007). At present, however, the Inter-association working group of Electromagnetic Signals Associated with Earthquake and Volcanoes (EMSEV) is planning to take a new way to continue these researches through an international cooperation in Bishkek, in which, one of the aims is to take advantage of the emission of artificial current to independently inspect the existence of the SES and its transmission passages. The same approaches have been done in China now. The paper by Ma et al. (2014), has shown good results in the following aspect: several geoelectric field stations distributed in the large area of east China, received very strong signals synchronously caused by the emissions from some DC heavy current power source to the ground, with the current up to several kilo Amperes, and the features in different stations differ from each other, depending on the sourcestation distance and the orientation of the measuring dipole relative to the source-station direction. It could be also seen that the local complexity of electrical structure of underground medium in the studied area may give certain effect on the response of received signals so called "selectivity effect". Obviously, it is necessary to take the pattern of multiple large current source and regional geoelectric field observation network to carry out the observation of large area in the field in order to further study the propagation and selectivity characteristics of the geoelectric field. This paper will deal with the features of signals in the east-south geoelectric field stations network specially in the area of Shanghai and its vicinity, associated with the strong power currents injected from four sources (i.e. "earth electrodes") respectively connected to the substations of UHVDC (Ultra-high voltage direct-current power transmission system) in State Grid Cooperation of China.
In the practice of short-term and impending earthquake prediction, one of the most difficult issues is how to determine the location of the signal source. However, it becomes much simple in the case of artificial sources mentioned above, with a deterministic or known source location, time and amplitude as well as frequency characteristic of the source currents, so that the signals recorded at each observation point would be unique or deterministic, for one to study the transmission features of the electrical signals in underground conditions and received in observation points distributed in the large area around the source. The authors hope this study could help one to furtherly study and solve those problems what we encountered in short-term earthquake prediction, e.g. future earthquake epicenter location and magnitude, based on the SES which have been a very important task for the scientists working in this field.
In recent years a digital observation network of the geoelectric field of more than 115 stations has been built up in China. In order to eliminate the noise from electrode efficiently, two observation dipoles with different spacing along the same orientation, and two perpendicular or even three orientations in each geoelectric station, such as in the west-east, north-south, and north-east (north-west) direction, are adopted as shown in the paper (Ma, 2014). Nowadays the geoelectric digital network has already been the biggest one in the world in terms of wide coverage and dense distribution; and the four current sources in Shanghai area injected up to 4780 amperes as the signal sources. This paper will deal with the features of the geoelectric field variation covering Shanghai Municipality, Jiangsu and Anhui provinces when the strong currents injected from different sources, in order to better understand the propagation characteristics and selectivity phenomenon of the current under complicated geological conditions.
2 DISTRIBUTION OF SOURCES WITH HEAVY CURRENT AND NETWORK OF GEOELECTIRC FIELD OBSERVATION 2.1 Distribution of Current SourcesThere are four sources connected to the substations of UHVDC of State Grid, three of them, Nanqiao, Huaxin and Fengxian, are in Shanghai area, and the other one, Tongli, is in Jiangsu Province, as shown in Fig. 1 by stars.

|
Fig. 1 Distribution of the geoelectric field observatories around the area of the powerful electrical current sources |
The study of geoelectric field, at present, concerns only the projection of geoelectric field on the earth's surface, expressed by the components of a vector in plane coordinate system, which are measured by a dipole (consisting of a pair of electrode) in a specific direction (generally north-south and east-west) as the receiver of the signals of the geoelectric field in that direction. The value of each field component is expressed by the potential difference on the dipole divided by its length. Two kinds of techniques are widely adopted in the observation stations of geoelectirc field network in China: (1) the unpolarized solid electrode used for each dipole, with special technique to bury the electrode into ground so as to ensure small potential differences between the electrodes and soil. (2) The multi-dipole observation system set in a station so as to ensure the objective observation of geoelectric field.
The geoelectric stations involved in this paper are Chongming, Changjiang and Qingpu, Pudong in Shanghai Municipality, Nanjing, Hai'an and Gaoyou in Jiangsu province, as well as Jiashan in Anhui province which are a part of the Huadong geoelectric network as shown in Fig. 1 and demonstrated good responses to the artificial heavy current sources. And the configurations for those stations are shown in Fig. 2.

|
Fig. 2 Sketch map of the electrode distribution at some geoelectric field observatories in Shanghai area |
The ZD9 Electric Field Meter has been used in each station with frequency range from 0.0 Hz to 0.1 Hz, and sampling interval of one minute.
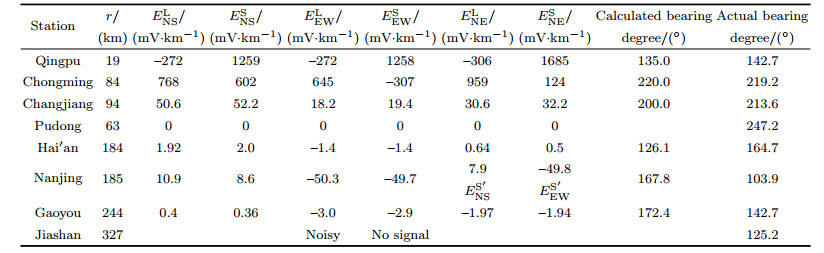
3 CHARACSTERISTICS OF THE GEOELECTRIC FIELD VARIATION ORIGINATED FROM FOUR HEAVY CURRENTS 3.1 Signal Feature of the Geoelectric Field Originated from the Earth Electrode of Tongli SubstationWhen the current over thousand amperes is injected into the underground through the earth electrode in Tongli substation, the additional signals could be recorded at the geoelectric stations in the region around the source, showing different characteristics at these stations, depending on its proximity and its position to the source. Fig. 3 shows the waveform of geoelectric field intensity recorded at the stations of Qingpu, Chongming, Changjiang, Hai'an, Nanjing, Gaoyou, and Jiashan respectively when a square current wave of 4516 A was injected into ground from the source during the time from 3:00 am to 5:00 am on July 25th, 2013. And the corresponding values of the additional signals (field intensity) for each dipole in the stations mentioned above are listed in Table 1, in which the specific parameters recorded at each station are given, and ENSL and ENSS represent the intensities of components recorded on long dipole and short dipole in NS direction respectively, and similarly EEWL, EEWS, represent the ones in EW direction and ENEL, ENES for the ones in NE direction. In Fig. 3 it could be seen that the shapes of the waveform of the additional signals recorded at Qingpu and Chongming are better than those recorded at other stations which might be affected by noises to some extent.

|
Fig. 3 Signal shapes of the geoelectric field recorded at the stations of Qingpu, Chongming, Changjiang farm, Hai'an, Nanjing, Gaoyou and Jiashan at 3:30–5:00, July 25, 2013 |
|
|
Table 1 Signal values recorded at some stations of the geoelectric field in the Huadong area when 4516 amperes of current inflow into the underground at the earth electrode of Tongli substation on July 25, 2013 (azimuth from station to the source) |
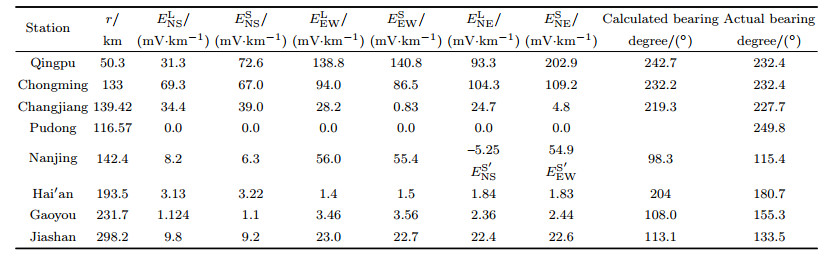
From Table 1 we can see when 4516 A current is injected into ground at the earth electrode of Tongli substation the characteristics of the additional geoelectric field observed at each station are described as follows:
(1) Amplitude characteristics
The first feature is that the values of the additional geoelectric field intensity are linked with the distance between the station and the source, so called "station-source distance", for example, the values at Qingpu station are the largest, and the second at Chongming station in Table 1, which are due to the fact that among the stations, Qingpu is the nearest one to the source, 50.3 km, and Chongming, 133 km is the second one near the source, while at Pudong station, 116.57 km away from the source, no signals of the additional geoelectric field were recorded.
The second feature is that the values of the additional geoelectric field intensity are linked with dipole azimuth orientated to the station-source direction. For example, Nanjing station is located 142 km in the west direction from the source, in which the amplitude of the additional geoelectric field on the EW dipole is much larger than that on NS dipole (and even larger than that of Changjiang station at 139 km from the source) because the EW dipole azimuth of Nanjing station is almost parallel to the station-source direction, while the NS dipole azimuth of the station is perpendicular to the station-source direction. Similar examples could be also found by comparison between the recordings of Jiashan station, 298 km from the source and that of Hai'an and Gaoyou station, 194 km and 232 km from the source respectively: the amplitude of Jiashan station is larger than the later two, even though its station-source distance is larger than the latter two.
(2) Uniformity
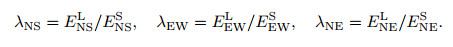
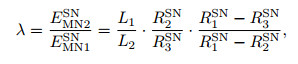
λi(i=NS, EW, NE) the ratio of the additional electric fields of the long dipole to short dipole, is used to describe the difference of the electric field value of the long and short dipoles in the same direction at the same station to denote the uniformity behavior of the geoelectric field observation. For the NS, EW, NE directions, here the uniformities are defined as
|
(1) |
Based on the definition, λ = 1 corresponds to the best data observed in one dipole, so we judge the evenness by the deviation from the condition λ = 1, for a given dipole, the smaller the deviation from λ = 1, the better the uniformity of the geoelectric field at the dipole. The uniformity could be used to evaluate the influences on the observation due to the nonuniformity in local geoelectrical structure under the observation area.
For example, at Qingpu station, it is uniform in EW direction with λEW = 0.99, while the uniformities are worse in the direction of NS and NE with λNS = 0.43 and λNE = 0.46, respectively. At the stations of Chongming, Hai'an, Gaoyou and Jiashan, the uniformities are good in all the directions with λi ≈ 1 (i=NS, EW, NE). At Changjiang station the uniformity is better in NS direction with λNS ≈ 0.9, than that in the directions of EW and NW due to the low signal to noise ratio on short dipoles mainly caused by the polarization noise of the electrode D (Fig. 2, 3). At Nanjing station the values of the additional geoelectric field in EW direction are the biggest and its uniformity is better, but worse in the direction of NS.
(3) Orientation degree characteristics
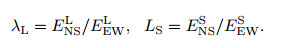
We would like to introduce another parameter, the ratio of the additional geoelectric field on the long and short dipoles in SN and EW direction, denoted by symbols λL or λS, which could be used to describe the difference of the additional electric fields in different directions:
|
(2) |
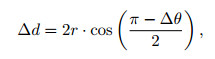
Formula (2) is used to calculate the azimuth from station to the source, called as "calculated bearing degree", as shown in the ninth column. Then we can calculate the positioning deviation distance by comparison with the real azimuth from the station to the source as follows:
|
(3) |
where △d is positioning deviation distance, △θ is the degree difference of actual bearing and calculated bearing, r is the station-source distance. From Table 1 we can see that the actual bearing degree is basically consistent with the calculated bearing degree only at the Chongming station with △θ = 0.2° and △d = 0.464 km. For Qingpu station △θ = 10.3° and △d = 9.03 km.
It can be seen from Fig. 1 that the stations of Chongming and Qingpu are basically on the same straight line with the location of Tongli earth electrode, so it is difficult to utilize the bearing line intersection method based on the two stations to determine the location of the earth electrode. For other stations the degree difference of the actual bearing and calculated bearing is relatively large, and the positioning deviation distance △d > 20 km. For the location of Tongli earth electrode only the orientation degree of Chongming station could be used to determine the source azimuth, but it is hard to accurately determine the source azimuth by utilizing the orientation degrees of other stations in Table 1. That is to say, it could have more error by using the method of the intersection of many sets of bearing line to determine the location of Tongli earth electrode, which is mainly influenced by the inhomogeneous electric structure and anisotropy of the underground medium in the observation area (Ma et al., 2014).
(4) Polarization characteristics
Here polarization direction refers to the growth pattern of the abnormal signals of geoelectric field, e.g. positive increase or negative increase. Fig. 3 shows that the polarization directions of the additional geoelectric field recorded at each station on long and short dipoles in the same direction are consistent.
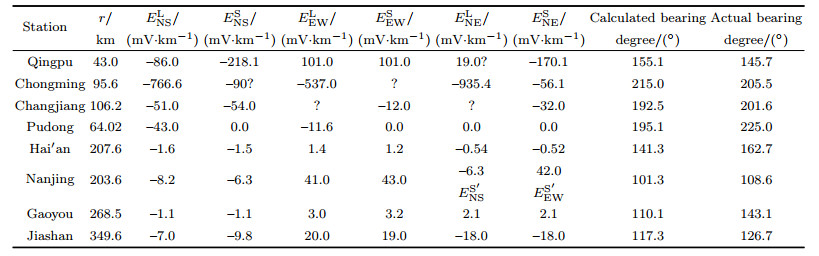
3.2 Characteristics of the Geoelectric Field Originated from the Earth Electrode of Huaxin SubstationDuring the period from 9:14 to 10:48 on July 7th, 2010 a strong current of 4780A was injected into ground through Huaxin earth electrode. Fig. 4 shows the waveform of the additional geoelectric field recorded at the stations of Qingpu, Chongming, Changjiang, Hai'an, Nanjing, Gaoyou, and Jiashan. In Table 2 the specific parameters recorded at the stations are given. The additional geoelectric field illustrates the following characteristics.

|
Fig. 4 Signal shapes of the geoelectric field recorded at the stations of Qingpu, Chongming, Changjiang farm, Hai0an, Nanjing, Gaoyou at 9:14–10:48, July 7, 2013 |
|
|
Table 2 Signal values recorded at some stations of the geoelectric field in the Huadong area when 4780 amperes of current inflow into the underground at Huaxin earth electrode at July 7, 2013 (azimuth from station to the source) |
(1) Amplitude characteristics
The values recorded on the short dipoles at Qingpu station with r = 19 km are the largest, the second largest is at Chongming station with r = 84 km, and the third largest is that of NS component at Changjiang station with r = 94 km. The distance between the stations of Changjiang and Chongming is 14 km, but the amplitudes of the additional geoelectric field recorded at the former station are much smaller than that at the latter station, and are just comparable with that of EW component recorded at Nanjing station with r = 185 km. At Pudong station with r = 63 km no signals of the additional geoelectric field are recorded. The signal amplitudes recorded at the stations of Hai'an and Gaoyou are smaller, and no signals are recorded at Jiashan station with r = 327 km.
(2) Uniformity
At Qingpu station the uniformities are worse and the ratios of the additional electric fields of the long dipole to short dipole are λNS = 0.216, λEW = 0.216, λNE = 0.182 respectively, in which the signal amplitudes on short dipoles are larger than 1250 mV·km?1 and much more than that on the long dipoles, which means that in the direction from Qingpu to Huaxin there are outstanding inhomogeneous electric structure and anisotropy of the underground medium, that is to say, in the scope of the 150 m short dipole observing area and 200 m long dipole area the underground electric structure is different very much. For Chongming station, λNS = 1.28, λEW = 2.10, λNE = 7.73, which show that the uniformities are better in NS direction but worse in the directions of EW and NE because the amplitudes of EEWS and ENES are relatively small due to the inhomogeneous electric structure and anisotropy of the underground medium at the location of B electrode (Fig. 2a). For the stations of Changjiang, Hai'an and Gaoyou the uniformities are better in all directions. For Nanjing station they are better in the directions of EW and NS.
(3) Orientation degree characteristics
For the location of Huaxin earth electrode Table 2 shows that the degree difference of actual bearing and calculated bearing for Chongming station is △θ = 0.8°, and by the formula (3) it can be calculated △d = 1.173 km. For Qingpu station △θ = 7.7° and △d = 2.55 km. There are relatively big degree differences of the actual bearing and calculated bearing for other stations. If we use the intersection method of bearing lines of the stations of Chongming and Qingpu to determine the location of Huaxin earth electrode its error is in the range of 2.55 km much better than the results from other stations.
(4) Polarization characteristics
It can be seen from Fig. 4 that the polarization directions of the additional geoelectric field recorded at Qingpu station on the long dipoles are opposite to that on the short dipoles in the same direction, and they are opposite only in EW direction at Chongming station. The polarization directions at other stations on the long dipoles are coincident with that on the short dipoles in the same direction.
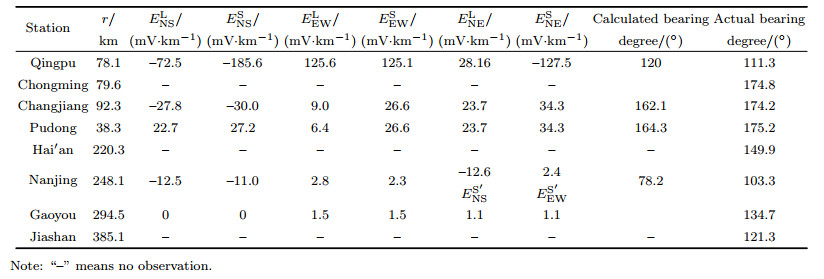
3.3 Characteristics of the Geoelectric Field Originated from Fengxian Earth ElectrodeOn May 5, 2010 a heavy current of 4000 A was injected into underground through Fengxian earth electrode. The signals of the additional geoelectric field are recorded at the stations of Qingpu, Chongming, Changjiang and Pudong in Shanghai area and Nanjing, Hai'an and Gaoyou in Jiangsu province and Jiashan in Anhui province. To save the space in this paper, the observation waveforms are omitted here. The specific parameters recorded at the stations are given in Table 3. The additional geoelectric field displays the following characteristics:
|
|
Table 3 Signal values recorded at some stations of the geoelectric field in the Huadong area when 4000 amperes of current inflow into the underground at Fengxian earth electrode on May 5, 2010 (azimuth from station to the source) |
(1) Amplitude characteristics
The amplitudes of the additional geoelectric field on long dipoles recorded at Chongming station with r = 95.6 km are the largest, which are five times more than that at Qingpu station with r = 43 km. The signals are recorded on the long dipoles of NS and EW directions at Pudong station with r = 64 km, and not recorded on other dipoles, which means that the potential at the location of B electrode in Fig. 2d are changed significantly by the heavy current.
(2) Uniformity characteristics
At Qingpu station the uniformities are worse in the NS and NE direction, but better in the EW direction. At Chongming station, the uniformities are bad in all directions, and the amplitude values of the additional electric field on the long dipoles are very large, eight times than that on the short dipoles in the same direction which means that in the direction from Chongming station to Fengxian earth electrode the underground electric structure in the long dipole area is much different from that in the short dipole area. For Changjiang station the uniformity is better in NS direction, but could not be judged in the directions of EW and NE because of the failure of recording on the long dipoles. At Hai'an station the uniformities are better in the three directions and the ratios of the signals on long dipoles to short dipoles are about 1.1. It is good better in the EW direction at Nanjing station, and also at the stations of Gaoyou and Jiashan the uniformities are good in all directions.
(3) Orientation degree characteristics
From Table 3 it can be seen that there are relatively big degree differences between the actual bearing and calculated bearing for each station to Fengxian earth electrode, in which the minimum difference is 7.3 degrees. So if we use the observation data to determine the location of the Fengxian earth electrode there is a big error. Taking an example of Nanjing station with the minimum error, the calculated azimuth is 101.3°, but the actual azimuth is 108.6°, the difference is 7.3° and by the formula (3) it can be calculated △d = 26 km. It can be seen that the azimuth position error is too large by using these signals to orientate, and the reasons for the results are due to the anisotropic characteristics of the underground medium in the signal source area and its surroundings.
(4) Polarization characteristics
The polarization directions of the additional geoelectric field recorded at Qingpu station on the long dipoles are opposite to that on the short dipoles in the NE direction, but consistent in other directions. The polarization directions on the long dipoles are coincident with that on the short dipoles in the same direction at the stations of Chongming, Changjiang, Nanjing, Gaoyou, Hai'an and Jiashan.
3.4 Characteristics of the Geoelectric Field Originated from Nanqiao Earth ElectrodeOn Jun.1, 2008 a heavy current of 1200 A was injected into underground through Naoqiao earth electrode. The signals of the additional geoelectric field are recorded at the stations of Qingpu, Changjiang and Pudong in Shanghai area and Nanjing and Gaoyou in Jiangsu province. They are not recorded at the stations of Chongming, Hai'an and Jiashan due to equipment failure at that time. What is different from the situation mentioned above is that the signals are recorded on all dipoles at Pudong station. Due to the limitation of space the observation curves are omitted here. The specific parameters recorded at the stations are given in Table 4.
|
|
Table 4 Signal values recorded at some stations of the geoelectric field in the Huadong area when 1200 amperes of current inflow into the underground at Nanqiao earth electrode at 12:30-19:00 Jan.1, 2008 (azimuth from station to the source) |
The additional geoelectric field illustrates the following characteristics:
(1) Amplitude characteristics
The amplitudes of the additional geoelectric field recorded at Qingpu station with r = 78 km are the largest. They are smaller at Changjiang station with r = 92.3 km than that at Qingpu station. For a heavy current of Nanqiao earth electrode, the signals of the additional geoelectric field are recorded clearly at Pudong station and their amplitudes are compatible with that at Changjiang station. Their amplitudes at Nanjing station with r = 248 km and Gaoyou station with 294.5 km are relatively small. For the source the signal amplitude recorded at nearby station is larger than that at distant station.
(2) Uniformity characteristics
The uniformities of the signals recorded at Qingpu station are better in EW direction than that in the directions of NS and NE. They are also better in NS direction than that in other two directions at Changjiang station. Their uniformities are better at Pudong station in the directions of NS and NW, than that in EW direction. The uniformities of Nanjing station are good in the directions of EW and NS. At Gaoyou station the uniformities are also good in the directions of EW and NE, but without signal recorded on the dipoles in NS direction.
(3) Polarization characteristics
Polarization directions of the additional geoelectric field on long dipoles recorded at Qingpu station are opposite to that on short dipoles in the directions of NS and NE.
3.5 Diversity of the Additional Geoelectric Field Variation for Multi-SourcesTo sum up the analysis above, we can see the diversity of the additional geoelectric field variation for the heavy currents from different sources as follows:
In terms of amplitude characteristic, for the heavy current signals originated from the earth electrode of Tongli, Huaxin and Nanqian, the largest amplitude of the additional geoelectric field was recorded at Qingpu station which is the nearest to the sources. But for the signals originated from Fengxian earth electrode, the largest signal amplitude of the additional geoelectric field was recorded at Chongming station, which is even larger than that recorded at Qingpu station although it is the nearest to the source. From the analysis mentioned above it can be seen that there is a phenomenon for the variation characteristics of the additional geoelectric field, that the signal values recorded at the station far from the source are larger than that recorded at the station near the source and even no signals of the additional geoelectric field could be observed at a near station from the source. This shows the situation that the signals could be recorded at remote stations but not recorded at some close stations and this phenomenon also exists in other areas (Ma et al., 2013; 2014). This phenomenon is closely related to the direction from the signal source to observatory.
From the observation in terms of distance, the farthest distance of the station is 350 km, at which one could observe the signals of the additional geoelectric field originated from the great current sources of the four earth electrodes in Shanghai area, and no signals could be observed beyond this distance. In eastern Huabei area in China, the farthest observation distance is 450 km for the signals of the additional geoelectric field derived from a heavy current of 2100 A of the earth electrode located in Shandong province (Ma et al., 2014). In the south part of Sichuan province in China, the farthest observation distance is 540 km for the signal from a heavy current of 4500 A at an earth electrode (Ma et al., 2013). In our recent study we found that the farthest observation distance is 1000 km for the signals generated by a heavy current of 2000 A at Liaonan earth electrode (in a paper unpublished). Through the analysis and comparison we found that the longest distance of the telluric current propagation varies in different areas, and it is closely related to the propagation direction. So this situation is closely related to the geological structure conditions in different areas.
There is a "sensitivity" effect. At Pudong station the signals of the additional geoelectric field derived from a heavy current of Naqiao earth electrode could be clearly observed, but no signals the earth electrodes of Tongli, Fengxian and Huaxin could be recorded which are in the southwest direction of the station. So the Pudong station is just sensitive to the signals from its southeast direction, but not to that from other directions.
For Nanjing station, because the four earth electrodes mentioned above are located in its eastern side the EW components of the additional geoelectric field are larger than that of NS components at the station, which were all originated from the heavy currents of the earth electrodes of Tongli, Fengxian and Huaxin. However, the largest values of the signals from Nanqiao earth electrode are recorded by NS instead of EW component.
From the aspects of uniformity, the ratios of the additional geoelelctric field of the long dipoles to short dipoles are given in Table 5, which shows the characteristics for each station as follows.
|
|
Table 5 values of the additional electric field recorded at each station originated from the four great current sources |
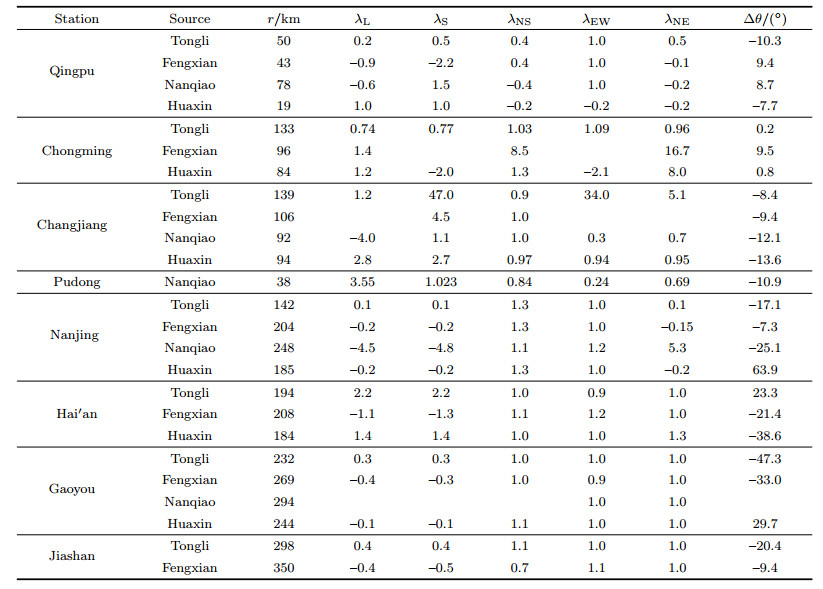
For Qingpu station, the absolute values of λNS = 0.4 and λEW = 1 respectively, for the signals from Tongli, Fengxian, and Nanqiao. This means that the uniformity of the additional geoelectric field is not good but steady in NS direction, and very good in EW direction. The absolute value of λNE is different. For the signals from Huaxin earth electrode which is the nearest to the station the ratios λNS = λEW = λNE =-0.2. It means that the uniformities are bad for near-source signals, which is often seen in the routing observation of geoelectric field.
For Chongming station only for the signals from Tongli earth electrode the ratios λNS = λEW = λNE ≈ 1.0, which means that the uniformity of the additional geoelectric field is pretty good.
For Changjiang station the uniformity of the additional geoelectric field is also good in NS direction with λNS = 0.9 ~ 1.0 for all sources, but not steady in the directions of EW and NE. However, the uniformity for all the directions are very good in the case of heavy current from Huaxin earth electrode, with λNS = λEW = λNE ≈ 1.0.
For Pudong station only the additional geoelectric field from Nanqiao earth electrode could be observed, and their uniformities are all bad in the three directions, which suggest the existence of outstanding inhomogeneous or anisotropy features in electric structure underneath the observed area. For the stations of Hai'an and Gaoyou, these uniformities are very good with λNS = λEW = λNE ≈ 1.0. For Nanjing station, these uniformities are better in NS and EW directions. For Jiashan station these uniformities of the additional geoelectric field Tongli and Fengxian are also good.
In Table 5 it can be seen that the degree differences of the actual bearing and calculated bearing for the earth electrodes of Tongli and Huaxin are minimum only for Chongming station with △θ = 0.2° and 0.8° respectively, with △d = 0.464 km and 1.173 km, respectively by utilizing the formula (1). For Qingpu station with minimum spacing these degree differences are larger than that for Chongming station. So by using the bearing line intersection method of the two stations to position the source location, only Huaxin earth electrode location is determined with relatively good result, and its error is in the range of 2.55 km. If we use the calculaed bearing degrees of other stations to position the source location of the four earth electrodes the errors are too big, because their differences of calculated azimuth and actual bearing are too big, the reason mainly lies in the heterogeneity of electrical structure beneath the stations (Ma et al., 1995, 2003, 2014; Hang et al., 2010).
For the additional geoelectric field recorded at the stations of Qingpu and Chongming, there is a phenomenon that the polarization directions of the signals on long dipoles are opposite to that on short dipoles. For the Tongli earth electrode, the polarization directions of the signals on long dipoles are consistent with that on short dipoles at the stations of Qingpu and Chongming. For the Huaxin earth electrode, the polarization directions of the signals recorded at Qingpu station on long dipoles are opposite to that on short dipoles in the three directions, and there is the phenomenon only in the EW direction at Chongming station. For the signals from Fengxian and Nanqiao, the polarization directions of the signals recorded at Qingpu station on long dipoles are opposite to that on short dipoles in NE direction. At the stations of Qingpu and Chongming, it is known that the polarization directions of the geoelectric field on the long dipoles and short dipoles basically are the same in the same direction through a large number of comparative analysis of the signals of geoelectric storm and earth electrodes, but just by chance a few times they are opposite for the earth electrode signals. Usually when signal source is outside the configuration system of geoelectric field observation, that is, when it is laid outside the electrode distribution area, the polarization directions of the geoelectric field on the long dipoles and short dipoles are the same in the same direction. But when the source is inside the area covered by of the electrodes the polarization directions could be opposite, as shown in Fig. 5. Assume the long dipole is composed of electrode E' and W' and short dipole consists of electrode E and W. Suppose a signal source is outside the short dipole and inside the long dipole, then the electric field intensities on the long and short dipoles are where VE', VW', VE and VW represent the potentials of the points of E', W', E and W, respectively. Q is a constant related to the intensity of signal source and medium resistivity, L is the length of electric dipole, R is the distance between the noise source and each point. When ROW' < ROE' then there are the conditions as follow

|
Fig. 5 Schematic diagram of a noise source located in the zone of electrode distribution |
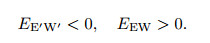
|
(6) |
The formula (6) shows that the polarization direction of the electric field on the long dipole would be opposite to that on the short dipole when noise source is located inside the area of electrode distribution. Varotsos took this feature as one of the criteria to distinguish the noise source in the inner and outer of the electrode layout (Varotsos et al., 1984a, 1984b, 1991). In fact, at many stations the electrical structure of underground medium presents electrical heterogeneity or anisotropy, and whether the above criteria are completely accurate has not been verified by actual observations. From Fig. 4 and Table 2 it can be seen that the distance between the Huaxin earth electrode and Qingpu station is 19 km and the length of the long dipoles is 200 m in Fig. 2. So the station location can be regarded as a point relative to Huaxin earth electrode. In the signals of the additional geoelectric field originated from Huaxin earth electrode, the polarization directions of the signals on long dipoles and short dipoles are opposite in the directions of EW and NS as well as NE at Qingpu station. At Chongming station which is 84 km from the source the polarization directions of the addition geoelectric field on long dipole and short dipole are opposite in EW direction, but they are consistent in NS and NE directions. At the stations of Changjiang, Nanjing, Hai'an, Gaoyou and Jiashan, they are consistent in the directions of EW, NS and NE. How to explain the situation mentioned above is still puzzling to us. We think it is related closely to the electrical heterogeneity and anisotropy of the underground medium at station as well as the flow direction of telluric current.
4 FACTORS AFFECTING THE OBSERVATION OF GEOELECTRIC FIELDIn order to understand the spatial distribution characteristics of the additional geoelectric field originated from the heavy currents, two factors need to be considered, that is, the complexities of the device system and the electrical structure of the medium in the studied area.
4.1 The Influence of the Configuration SystemThe effect of the current injected from the earth electrode of the HVDC transmission system is basically caused by the current imbalance between the positive power transmission lines and the negative one in the system. When current flows into or out of the earth electrode, it serves as a current source, to generate an artificial additional electric field at the geoelectric field stations in the adjacent ground of the source. Thus a special configuration system is formed between different measuring electrodes of any stations and the current source, as shown in the model of Fig. 6, in which the current source is regarded as a point current source, in the case of the geometric dimension of the current source much smaller than the station-source distance. For example, in this paper, the station-source distances of Qingpu station to the four current sources, which is closest one among the stations, are 19 km, 43 km, 50.3 km, 78.1 km, respectively, while the geometric dimension of the earth electrode is only smaller than 1 km. In Fig. 6, R2SN = R2EW refers to the distance between the point current source and mid-point of the measuring line of the stations. θ refers to the angle between the normal direction of NS measuring line and the connecting line. The configuration parameters of the system are determined by the geometric position (distance, direction) between the specific measuring electrodes of the specific stations and the current source. Meanwhile the additional potential difference measured at the specific measuring electrode of the specific station is determined by the following equations. Therefore, the additional electric field on the long and short dipoles in the SN measuring line could be given by the following formulas:

|
Fig. 6 The scheme of the configuration system constituted by the dipoles of station and the source |

|
(7) |

|
(8) |
where λ, the ratio of the additional electric fields of the long dipole to short dipole, is used to describe the difference of the electric field value of the long and short dipoles in the same direction at the same station:
|
(9) |
and the quantity 

|
(10) |

|
(11) |
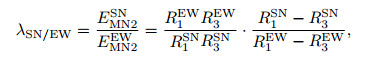
λSN/EW is defined as the ratio of the additional geoelectric field on the long dipoles in SN and EW direction, so as to describe the difference of the additional electric fields in different directions:
|
(12) |
In a similar way, whether λSN/EW is close to 1 could be used to determine the difference of the additional geoelectric field in the two directions at a station.
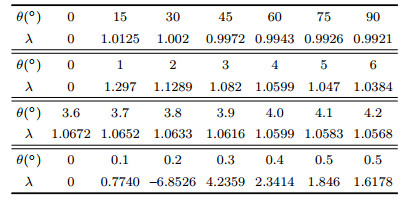
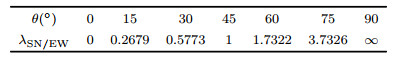
Table 6 and Table 7 gives the simulation result of model with the distance of station-source of 25000 m in different angles showing in Fig 6 to express the significance of the quantity of defined in the formula (12).
|
|
Table 6 The ratio of the geoelectric field signals recorded on the long dipole and short dipole in NS direction at the station that is 25000 m from the great current source |
|
|
Table 7 Ratio of the geoelectric field signals recorded on the long dipole in NS and EW direction at the station that is 25000 m from the great current source |
According to the simulation showing in the Table 6 and Table 7, one could see the following features.
(1) Due to the differences in the angle θ at different dipoles, it is normal to have different ratio of the electric field of the long dipole to short dipole even in the same direction at a station. Take the example of the long and short dipoles on the SN measuring line (L2 = 2L1 = 400 m) in the model. The deviation of λ = 1 from 1 is limited to 5%, and there would exist a threshold angle θc ≈ 5°: the deviation of λ from 1 is less than 5% if θ > θc, while the deviation of λ from 1 would be more than 5% if θ < θc, and λ would be even less than 0 if 0 < θ < 0.229°. It is noted here that there is a special point of θ = 0.229° when θ → 0.229°, R1SN → R2SN, and λ → ∞, that is to say, the point of 0.229° is a singularity in that model in Table 6. Similar results are obtained from the simulation for the other station with different station-source distances. The larger the distance is, the smaller the threshold angle is. That is to say, the threshold angle is too small for those stations that are very far from the source, due to that the angle between the normal direction and the station-source direction for those stations is beyond their threshold angles, so that the additional electric field values are basically consistent on the long and short dipoles of the measuring line in the same direction at these stations, and the ratios usually complied with λ = 1, also shown in Table 5.
(2) There are some differences of the electric field in different directions at a station, even big differences. According to Table 7, all the geometric parameters are marked with SN or EW so as to be easily distinguished, with the assumption of the apparent resistivities measured in the two directions are the same (The following section will elaborate on the situation of different apparent resistivity measured at the two directions). We may infer from Table 7 that, with the exception of θ = 45°, the additional electric field values recorded at the same station are usually different in two directions when current source is at a different position from that of the measuring device. For example when θ = 0°, according to Eq.(12), the ratio of the additional electric field values measured in two directions (SN to EW) at the same station is expressed as λSN/EW = 0. Meanwhile, when θ = 90° the ratio λ1 → ∞. It is easy to infer from the geometric relation in Fig. 6 that the above-mentioned conclusion is reliable. θ = 0° indicates that the additional electric field value is 0 in SN direction, and maximum in EW direction. θ = 90° means that the additional electric field value is 0 in EW direction and maximum in SN direction. This conclusion is applicable for all the stations regardless of their distance from the current source.
4.2 The Influence of Inhomogeneous Medium Structure in the Large AreaSection 4.1 focuses on the complex spatial distribution of additional geoelectric field at different stations with different configurations (including the following cases: stations in different proximity to the current source, different dipoles in the same direction at the same station, and in different direction at the same station). However, the complex electric structure of the medium of the research area should be taken into account so as to make a comprehensive analysis of the complex spatial distribution of the additional electric field generated by the current source. The inhomogeneity of either the large area or the internal measuring area of the station is covered by this study, the latter of which will be elaborated in Section 4.3.
The influence of the medium inhomogeneity in a large area can be inferred from formulae (7), (8) and (10), (11). The following parameters are included in the formulae: physical parameter (the apparent resistivity ρs) and geometric parameters (R1, R2, or R1, R3, etc. representing the distance between the measuring electrodes and current source). With an inhomogeneous (horizontally and vertically) medium structure of the research area, the difference in apparent resistivity is one of the major reasons why the additional electric field at one station is different from that at another station which are located at different positions in the large area. Furthermore, it also helps to explain the differences of the additional electric field in different directions at the same station. Under this condition, the apparent resistivity parameters in formula (10) and (11) are marked as ρsSN and ρsEW, to show the structural heterogeneity in different directions. This discussion is able to explain the phenomenon mentioned in Section 3. From Fig. 3 and Fig. 4 as well as the results of the study on the spatial variation of the geoelectric field signals recorded at the stations in the eastern Huabei area in China when a heavy current was injected in Shandong province (Ma et al., 2014), it can be seen that waveform distortions of the additional geoelectric field signals are related closely to the station-source distances. At the stations of small station-source distance the signal waveforms of the additional geoelectric field are complete, but with the increase of the distance the distortions of the signal waveform are getting serious, that is to say, the farther away the more serious the waveform distortion. This phenomenon is mainly related to the inhomogeneity of the medium structure in large area. Consequently, the intensity of the additional electric field recorded at the station nearby the current source is smaller than that of the remote station. Due to fault belts, the electric structure in the large region features obvious inhomogeneity, horizontally and vertically. With insufficient geophysics data of the electric structure in large areas, it is impossible to explain the distribution of the additional electric field unveiled in Section 3 in a quantitative way. However, the qualitative analysis is totally rational.
4.3 The Influence of the Inhomogeneity of the Shallow Subsurface Media under the Survey Area of the StationThe inhomogeneity of the underground electric structure of the area close to or inside the measuring area of station would be one of the significant factors that influence the spatial distribution characteristics of the additional electric field in the study area when a heavy current flows into or out of the ground. In the observatory two and more dipoles in the same direction should be distributed so as to ensure that the geoelectric field observed is not caused by the polarization effect of electrodes, that is to say, the values measured in the same direction should be consistent (both number and sign). In other word, λ = 1, which is defined above. However, according to the actual observation, the results obtained by many stations are not compliant with this theory. What is the reason for it? According to the analysis, if the field source is too close and even inside the measuring area, no doubt the above-mentioned problem will emerge (Ma, 2008). However, another probable significant reason is the existence of inhomogeneity of the underground electric structure under the measuring area and its vicinity. It provides an excellent opportunity to discuss relevant problems in this paper when heavy current flows into or out of the ground.
In order to explain the situation of the larger deviation of λ from 1 at Qingpu station, we carried out the shallow exploration of high density electrical prospecting in the area of the dipole distribution at the station to prove our conjecture. Fig. 7 shows the shallow layer high density electrical prospecting results, in which surveying lines were distributed along with the directions of the electrode dipoles, and the above and below are the two dimensional resistivity profiles in NS and EW directions (Fig. 2c DC and AB directions), respectively. The surveying lines are 320 m long, in which 64 electrodes are used with 5 m dot pitch, and the inversion depth is 37.1 m. In the NS direction the measurement line shows different degrees of high resistance phenomenon at a depth of 8~20 m, and when the inversion depth is greater than 20 m the apparent resistivity of the medium has a tendency to decrease. In the EW direction, the shallow resistivity value is between 10 and 25?m in the depth about 7 m, and in the depth of 25~30 m range there is a high resistance layer with the resistivity values of 30~50?m. In the NS direction the measuring point of 240 meters from south terminal is in the area near the northernmost region of the NS long dipole, that is the surrounding area of C point in Fig. 2c. From the upper part of Fig. 7 it can be seen that the inhomogeneity of electrical structure of the medium is very significant beneath the section from 240 m to 300 m in NS direction, and in the layer of depth less than 5 m there is a low resistivity zone, and that is to say, in Fig. 2c the resistivity of the soil layer at C point and its surrounding area in the shallow layer of depth less than 5 m is much lower than that of D point and F point. This can explain why the ENSL and ENEL amplitude values of the additional geoelectric field recorded at Qingpu station originated from multi heavy current sources are smaller than that of other compontents showed in Table 1-Table 4. In EW direction the resistivity of the soil layer at the depth less than 5 m changes little laterally in the area of the electrode dipole distribution as shown in the lower part of Fig. 7, therefore λEW ≈ 1.0 for the signals originated from earth electrodes of Tongli, Fengxian and Nanqiao at Qingpu station as shown in Table 5. For the signals originated from Huaxin earth electrode the ratio λEW ≈?0.2 at Qingpu station in Table 5 because the source is the nearest to the station, 19 km, so the transverse inhomogeneity of electrical structure of the medium plays an important role below the depth of 5 m.

|
Fig. 7 Two dimensional resistivity profile at Qingpu station. Upper picture is for NS profile and the below is for EW profile |
Many numerical simulation results have also shown that the geoelectric field on the ground surface will drop a lot when some low resistivity media are present in the part above high resistivity (Huang and Lin, 2010). Non-uniformity of underground electrical structure has an impact on the observation of earth resistivity and geoelectric field and it has been fully reflected in our previous numerical simulation studies (Ma and Qian, 1995; 2003; Ma, 2002). The research results in this section fully prove that the effect of inhomogeneity of electrical structure under the station could influence the analysis result of geoelectric field observation data greatly.
5 CONCLUSIONFrom the study in this paper we can see that the additional geoeletric field signals recorded at the stations in the Huadong area in China present the different characteristics in different azimuth and distance when the heavy current of 1200 to 4780 amperes flows into the ground at four different locations. They are
(1) Usually the amplitude of the additional geoelectric field decreases with the increase of the distance to the sources. The propagation distance of telluric current can be vary great in different areas and related closely to directions. There is a phenomenon that the signal amplitude of the additional electric field recorded at distant station from source is larger than that at near station, even not be recorded at an adjacent station. For example, at Pudong station only the signals originated from Nanqiao earth electrode could be recorded but those from the earth electrodes of Tongli, Fengxian and Huaxin could not be recorded. This proves that there is so-called "selectivity effect" for observing geolelctric field.
(2) The distortion of the current waveform is closely related to the distance between station and source. The signal waveform of the additional geoelectric field recorded at a near station is complete. The greater the distance is, the more serious the signal distortion is.
(3) Utilizing recordings on different dipoles of a station the additional geoelectric field could be a means to determine the azimuth of the earth electrodes, for example, it is perfect to use the results at Chongming station to determine the azimuth of the earth electrodes of Tongli and Huaxin, although not good for determining the location of Fengxian earth electrode. This shows that based on the signals recorded at a station to determine the azimuth of sources its effect is different in different direction. By using the additional geoelectric field recorded at other stations to determine the azimuth of the four sources the error is bigger.
(4) For the additional geoelectric field originated from the four earth electrodes mentioned in the paper, at each station the amplitude ratio of the long dipoles to short dipoles in the same direction presents a complex situation and it requires specific analysis for a specific station.
(5) The four earth electrodes can be considered as remote sources compared with the dimensions of the long dipoles. For the additional geoelectric field recorded at the stations of Qingpu and Chongming there is a phenomenon in which the polarizing directions of the signals on the long dipoles are opposite to that on the short dipoles in the same directions. This is not consistent to the principle of multi-dipole geoelectric field observation and the mechanism for the phenomenon need to be further studied.
(6) The above results are closely related to the inhomogeneity and anisotropy of the underground electrical structure in large area and local area at stations as well as to the flowing direction of telluric current.
This paper analyzes the above characteristics deeply based on the data interpretation and comparative analysis to the exploration of high density electrical prospecting in the measuring area of Qingpu station, and the device system composed of point current source and station survey line layout, as well as the effect of inhomogeneity of the medium in large area. It has also provided positive arguments for the observation of natural geoelectric field. Particularly for the multi sources in different locations it has offered a useful tool to analyze the characteristics of the additional geoelectric field and the influence of the medium inhomogeneity in the measuring area of the station and its vicinity on geoelectric field observation.
Analyzing the variation characteristics of the additional geoelectric field originated from multi heavy current sources in different location provides us a good opportunity for further understanding of the nature of the geoelectric field change compared to the analysis with respect to a single source. In brief, it give us, to some extent, a more objective result than that by the studies based on indoor experiments to understand the relation between the intensity of telluric current signal generated in the hypocentral region during the earthquake and its transmission distance. It also provides a good reference to position the epicenter with seismic electric signals.
ACKNOWLEDGMENTSThis work was supported by the National Natural Science Foundation of China (41090292). We would like to acknowledge financial support from Shanghai Science and Technology Commission Research Project (12231202700) and China Earthquake Administration Xinhuo Program (XH12016).
| [] | Cao C Q. 1961. Electrodynamics [M]. Beijing: People's Education Press: 67 -81. |
| [] | Hayakawa M, Hobara Y. 2010. Current status of seismo-electromagnetics for short-term earthquake prediction. Geomatics, Natural Hazards and Risk , 1 (2) : 115-155. DOI:10.1080/19475705.2010.486933 |
| [] | Huang Q H, Ikeya M. 1998. Seismic electromagnetic signals (SEMS) explained by a simulation experiment using electromagnetic waves. Physics of the Earth and Planetary Interiors , 109 (3-4) : 107-114. DOI:10.1016/S0031-9201(98)00135-6 |
| [] | Huang Q H, Ikeya M. 1999. Experimental study on the propagation of Seismic Electro Magnetic Signal (SEMS) using a mini-geographic model of the Taiwan strait. Episodes , 22 (4) : 289-294. |
| [] | Huang Q H, Lin Y F. 2010. Numerical simulation of selectivity of seismic electric signal and its possible influences. Chinese. J. Geophys. , 53 (3) : 535-543. DOI:10.3969/j.issn.0001-5733.2010.03.007 |
| [] | Huang Q H, Lin Y F. 2010. Selectivity of seismic electric signal (SES) of the 2000 Izu earthquake swarm:A 3D FEM numerical simulation model. Proc. Japan Acad. Series B , 86 (3) : 257-264. DOI:10.2183/pjab.86.257 |
| [] | Huang Q H. 2011a. Rethinking earthquake-related DC-ULF electromagnetic phenomena:Towards a physics-based approach. Natural Hazards and Earth System Sciences , 11 (11) : 2941-2949. DOI:10.5194/nhess-11-2941-2011 |
| [] | Huang Q H. 2011b. Retrospective investigation of geophysical data possibly associated with the MS8.0 Wenchuan earthquake in Sichuan, China. Journal of Asian Earth Sciences , 41 (4-5) : 421-427. DOI:10.1016/j.jseaes.2010.05.014 |
| [] | Ma Q Z, Qian J D. 1995. Boundary element method for forward solution of two dimensional frequency electromagnetic sounding. Chinese. J. Geophys. , 38 (2) : 252-261. |
| [] | Ma Q Z. 2002. The boundary element method for 3-D DC resistivity modeling in layered earth. Geophysics , 67 (2) : 610-617. DOI:10.1190/1.1468622 |
| [] | Ma Q Z, Qian J D. 2003. The influence of inhomogeneous geoelectrical structure on the signals of geoelectric field. Earthquake , 23 (1) : 1-7. |
| [] | Ma Q Z. 2007. Study on the characteristics of the geoelectric field from underground source. Earthquake , 27 (S) : 149-154. |
| [] | Ma Q Z. 2008. Multi-dipole observation system and study Oil the abnormal variation of the geoelectric field observed at Capital Network before the 2006 Wen'an, Hebei of China, MS5.1 earthquake. Acta Seismologica Sinica , 30 (6) : 615-625. |
| [] | Ma Q Z, Zhao W G, Zhang W P. 2009. Abnormal variations of geoelectric field recorded at Wenxian station preceding earthquakes and their application to the prediction of the 2001 MS8.1 Kunlun earthquake. Acta Seismologica Sinica , 31 (6) : 661-670. |
| [] | Ma Q Z, Fang G Q, Li W, et al. 2013. Electromagnetic anomalies before the 2013 Lushan MS7.0 earthquake. Acta Seismologica Sinica , 35 (5) : 717-730. |
| [] | Ma Q Z, Li W, Zhang J H, et al. 2014. Study on the spatial variation characteristics of the geoelectric field signals recorded at the stations in the east Huabei area when a great current is injected. Chinese J. Geophys. , 57 (2) : 518-530. DOI:10.6038/cjg20140217 |
| [] | Park S K, Strauss D J, Aceves R L. 1996. Some observations about the statistical significance and physical mechanisms of the VAN method of earthquake prediction, Greece.//Lighthill S J. A Critical Review of VAN:Earthquake Prediction from seismic electrical signals. Singapore:World Scientific Publishing Co Pte Ltd, 267-285. |
| [] | Qian J D, Chen Y F, Jin A Z. 1985. The Application of Geoelectrical Resistivity Method in Earthquake Prediction [M]. Beijing: Seismological Press: 51 -52. |
| [] | Sarlis N, Lazaridou M, Kapiris P, et al. 1999. Numerical model of the selectivity effect and the △V/L criterion. Geophys. Res. Lett. , 26 (21) : 2345-3248. |
| [] | Uyeda S, Nagao T, Orihara Y, et al. 2000. Geoelectric potential changes:Possible precursors to earthquakes in Japan. Proc Natl Acad Sci U S A , 97 (9) : 4561-4566. DOI:10.1073/pnas.97.9.4561 |
| [] | Uyeda S, Nagaoa T, Kamogawa M. 2009. Short-term earthquake prediction:Current status of seismo-electromagnetics. Tectonophysics , 470 (3-4) : 205-213. DOI:10.1016/j.tecto.2008.07.019 |
| [] | Uyeda S. 2011. What course to follow for earthquake prediction in Japan. Wen J, Trans. Recent Developments in World Seismology (11) : 7-15. |
| [] | Varotsos P, Alexopoulos K. 1984a. Physical properties of the variations of the electric field of the earth preceding earthquakes, I. Tectophysics , 110 (1-2) : 73-98. DOI:10.1016/0040-1951(84)90059-3 |
| [] | Varotsos P, Alexopoulos K. 1984b. Physical properties of the variations of the electric field of the earth preceding earthquakes. Ⅱ. Determination of epicenter and magnitude. Tectonophysics , 110 (1-2) : 99-125. |
| [] | Varotsos P, Lazaridou M. 1991. Latest aspects of earthquake prediction in Greece based on seismic electric signals. Tectonophysics , 188 : 321-347. DOI:10.1016/0040-1951(91)90462-2 |
| [] | Varotsos P, Sarlis N, Skordas E, et al. 2011b. Natural time analysis of critical phenomena. Proc Nat Acad Sci U S A , 108 (28) : 11361-11364. DOI:10.1073/pnas.1108138108 |
| [] | Varotsos P A, Sarlis N V, Skordas E S. 2011a. Natural Time Analysis:The New View of Time:Precursory Seismic Electric Signals, Earthquakes and Other Complex Series[M]. Berlin Heidelberg: Springer: 1 -476. |
| [] | Zhao Y L, Qian F Y. 1981. Period of the telluric electricity field impending earthquakes. Earthquake , 2 (3) : 13-16. |