 2017, Vol. 60


2 SOA Key Laboratory for Polar Science, Polar Research Institute of China, Shanghai 200136, China
The aurora is one of the important phenomena in the solar-terrestrial environment. It is regarded as an indicator in the solar wind-magnetosphere coupling process in polar ionosphere. Auroral emissions are excited by collisions between precipitating electrons and neutral particles in atmosphere. The photon is generated by collisional deexcitation after bound electrons transit from ground state to excited state (Jones, 1974). There are three major spectral lines in the visible band (427.8, 557.7 and 630.0 nm), which play an important role in auroral emissions (Chamberlain, 1995). The generation of green aurora (G, 557.7nm) is associated with energy level transitions from 1S to 1D in atomic oxygen O and the life-time in the second excited state 1S is 0.8 s. Red aurora (R, 630.0 nm) is generated by energy level transitions from 1D to ground state in atomic oxygen with a life-time of 110 s. Blue-violet aurora (V, 427.8 nm) is excited by the first-negative band system of nitrogen molecules N2 (N+). Owing to the different generations of 427.8, 557.7 and 630.0 nm auroras, the height of the maximum luminosity is not the same. The height of red aurora is highest (~200 km), since the excited O (1D) would be subject to collisional deactivation at lower altitude due to the long life-time of O (1D) (Meng et al., 1991). The density of atomic oxygen decreases quickly and that of nitrogen molecules increases at lower altitude. As a result, the height of maximum luminosity (~150 km) in green aurora (557.7 nm) is higher than that (~120 km) in blue-violet aurora (427.8 nm).
Many scholars have made useful researches about correlation between auroral emission intensities at dif-ferent wavelengths by analyzing the spectra of precipitating particles. An earlier study by Eather and Mende showed the relevant significance between latitudinal distributions of auroral intensities (427.8, 557.7 and 630.0 nm) and particle fluxes (Eather, 1969; Eather and Mende, 1972). Later, Gattinger and Jones (1972) found that the I630.0/I427.8 and I557.7/I427.8 ratios decrease when the I427.8 emission intensity increases. Jones et al. (1987) found that the average energies inferred from the radar electron density profiles and the I630.0/I427.8 ratio are in good agreement, but there is little variation of the I557.7/I427.8 ratio. Recently, Dashkevich et al. (2006) obtained the dependences of the I630.0/I427.8 and I557.7/I427.8 ratio on the I427.8 emission intensity using more than 3800 measurements. It is found that the I630.0/I427.8 ratio decreases from 2 to 0.4 when the I427.8 emission intensity increases from 0.1 to 3 kR. In the I427.8 emission range 0.1~1.8 kR, the I557.7/I427.8 ratio tends to increase and takes the values 4.2~6.4. These results represent a relationship between auroral electron fluxes and spectroscopic emission features in aurora (Rees and Luckey, 1974). Rees and Roble (1986) and Christensen et al. (1987) had given approximate equations for auroral emission intensity as a function of electron spectrum and the I630.0/I427.8 ratio as a function of the characteristic energy.
YRS is located at the cusp latitude, which is suitable to observe dayside aurora. Hu et al. (2009) examined the synoptic distribution of dayside aurora and divided into 4 categories using the observations from three-wavelength (427.8, 557.7 and 630.0 nm) all-sky imagers (ASIs) at YRS. Dayside auroras and dynamic processes in magnetospheric boundary layer are closely related. Therefore, the source region should be determined firstly in the study of dayside aurora. Newell et al. identified the source region of auroras at low altitude using precipitating electron spectra observed from DMSP satellites (Newell and Meng, 1988; Newell et al., 1991a; Newell et al., 1991b). There are three major source regions of dayside aurora at low altitude: (1) LLBL, located between 74°and 77°MLAT which is higher near magnetic noon and lower at dawn and dusk, total energy flux of precipitating electrons is larger than 6 ×10¹⁰ eV·(cm2·s·sr)-1, the energy fluxes of 2 keV and 5 keV electrons are less than 107 eV·(cm2·s·sr)-1, average electron energy is between 220 and 600 eV, number flux of electrons is about 109 (cm2·s·sr)-1 (Newell and Meng, 1988); (2) Mantle, located in poleward of cusp or dayside auroral oval (~77°MLAT), a general tendency for the density and average ion energy is to decline with increasing latitude, the average energies of electron and ion are low (about a few times of 100 eV) (Newell et al., 1991a); (3) BPS, electron average energy has a magnitude of keV, the energy fluxes of 2 keV and 5 keV electrons are larger than 107 eV·(cm2·s·sr)-1 (Newell et al., 1991b).
Because DMSP is a polar-orbiting satellite, there are only a few simultaneous observations by DMSP satellites and YRS at noon and in the postnoon sector. It is hard to obtain the precipitating particle spectra for any dayside aurora. Thus, it is necessary to build a parameter model between emission intensities in dayside aurora and precipitating electron spectra. Xing et al. (2013) had built a model of auroral emissions and particle precipitation near magnetic noon at YRS using ASIs (427.8 and 630.0 nm) and DMSP particle spectra data. Auroral arc is one of typical forms of discrete aurora distinguished by Hu et al. (2009) in the prenoon and postnoon sectors (Yang et al., 2000; Sandholt et al., 2002). A stable auroral arc is elongated in longitude ( > 100 km) and narrowed in latitude (~18 km). The intensity of the green line (557.7 nm) is roughly proportional to that of the emission at 427.8 nm and is a good indicator of electron of energy flux (Paschmann et al., 2002). Dayside auroral arcs at 557.7 and 630.0 nm are bright, but the I427.8 emission intensity is so weak that we use I557.7 instead. Consequently, we would use the I557.7 and I630.0 emission intensities to analyze the spectra of precipitating electron in this study.
In this paper, the dependence of I557.7/I630.0 ratio on the I557.7 emission intensity was studied using dayside auroral arc images (0600-1800 MLT) from multiple-wavelength ASIs at YRS. And then, we built a model of auroral arc emissions and particle precipitation by analyzing the corresponding source region by means of contrasting simultaneous observation from DMSP. Using this model, we determined the spectra and source region of dayside auroral arc without DMSP data and discussed the MLT distribution of source regions.
2 DATAThe auroral data used in this study were obtained from ASIs with 557.7 and 630.0 nm filters from December 2003 to February 2007 at Chinese Yellow River Station (YRS), Ny-Ålesund, Svalbard. YRS is located at 78.92°N, 11.93°E, and corrected geomagnetic latitude 76.24°, where MLT≈UT+3 h (Qiu et al., 2013). The optical system at YRS contains three identical all-sky cameras (ASC), which were developed to measure the photoemissions at 427.8, 557.7 and 630.0 nm (Hu et al., 2005). The CCD (Charge-Coupled Device) camera uses a 512×512 square pixel array, and the center of the field of view is geographic zenith. ASIs are taken with a 7 s exposure time at 10 s cadence. ASIs are taken according to zenith and azimuth angle using a fish-eye lens, so that any pixel in an ASI has the same solid angle. Therefore, auroral emission intensities were corrected with zenith angle based on the model of Yang et al. (1997). We selected these auroral arcs which were bright both at 557.7 and 630.0 nm ASIs in this study. In total, there were 22882 auroral arcs observed in 44 days.
For each arc ASI, the emission intensity variation curve can be obtained as a function of zenith angle by extracting along magnetic meridian (Fig. 1). Fig. 1a shows an arc ASI taken at 1359 UT (1659 MLT) on December 24, 2003. The white line is along magnetic meridian and the field of view of ASC is in the range of the circle with diameter of this white line. From Fig. 1b, we can see a peak marked by a vertical dashed line, which represents an auroral arc. The value (4.7 kR) of the peak is defined to be the emission intensity of this arc in Fig. 1b. The emission intensity of any other arc was measured by the same method either in 557.7 or 630.0 nm ASI.

|
Fig. 1 Emission intensity of dayside auroral arc |
The Defense Meteorological Satellite Program (DMSP) is a collective name of a series of polar-orbiting meteorological satellites launched by US Department of Defense. The satellites were launched every two years and named as F (n) one by one. We used the particle spectra data detected from F13-F16. Total number fluxes (J ) and energy fluxes (J E) between 32 eV and 30 keV were measured by SSJ/4 sensors on the DMSP satellites (Hardy et al., 2008). The orbit of DMSP satellite is at a nominal altitude of 830 km with a period of 101 min (Aruliah et al., 2005). We found 17 cases of DMSP passing through 40 auroral arcs between 1320 MLT and 1755 MLT from all of ASIs.
3 RESULT 3.1 Dependence of I557.7/I630.0 Ratio on the I557.7 Emission IntensityThe emission intensity distribution of 22882 dayside auroral arcs and the dependence of I557.7/I630.0 on I557.7 were studied firstly, which could give us an impression of dayside auroral arc. Fig. 2 shows the average emission intensities I557.7 (a) and I630.0 (b) of dayside auroral arcs as a function of MLT. The value is marked by "★" at any MLT and error bar is plotted by vertical solid line at the corresponding time. The I557.7 emission intensity is in the range of 0.1 to 17.3 kR and takes an average value of 2 kR. From Fig. 2a, it is found that the I557.7 emission intensity has two maximum values. The stronger one (2.9 kR) is near 1500 MLT in hot spot region in the postnoon sector and the weak one (2.2 kR) appears at 0900 MLT in warm spot region in the prenoon sector. From Fig. 2b, the range of I630.0 emission is from 0.2 to 3.9 kR, much smaller than that of I557.7. The average emission intensity I630.0 is weaker than I557.7 having a value of 0.9 kR. Comparing with the distribution of I557.7, the intensity peak of red auroral arcs (630.0 nm) is located near magnetic noon and the average emission intensity I630.0 is weaker in the prenoon and postnoon sectors. Dayside auroral arcs can be seen clearly both in 557.7 and 630.0 nm ASIs, and the arcs at 557.7 nm are much brighter.

|
Fig. 2 Emission intensities of dayside auroral arcs as a function of MLT |
Figure 3 shows a scatter plot of the I557.7/I630.0 ratio as a function of I557.7 emission intensity at different MLT in the prenoon sector. We took logarithm for a comparative analysis. In Fig. 3, the best fit linear regression lines are plotted with solid black lines (equation and correlation coefficient R are labeled on the upper-left corner) and ±σ deviations from linear regression line are plotted with dashed lines. We can see a linear correlation between I557.7/I630.0 and I557.7 in the double logarithmic coordinate system having the correlation coefficient of ~0.9 and the standard deviation of ~0.1. The I557.7/I630.0 ratio increases from 0.2 to 9 with the increasing of I557.7 from 0.1 to 10 kR. The minimum value of I557.7/I630.0 is 0.17 in the prenoon sector, the maximum and average value is 23.9 and 2.6, respectively. From Fig. 3, auroral arc of I557.7/I630.0 larger than 1 appeared more frequently near magnetic noon, which is consistent with the result from Fig. 1 that maximum intensity of red auroral arcs (630.0 nm) is located near magnetic noon. It is also found that the I557.7/I630.0 ratio is smaller for the same I557.7 emission intensity as it is close to magnetic noon. Fig. 4 shows a scatter plot of the I557.7/I630.0 ratio as a function of I557.7 emission intensity at different MLT in the postnoon sector. I557.7/I630.0 and I557.7 are taken logarithm and the best fit linear regression lines are plotted with solid black lines just like Fig. 3. The result is similar with that in Fig. 3. There is a linear correlation between I557.7/I630.0 and I557.7 with the correlation coefficient of ~0.9 and the standard deviation of ~0.1. I557.7/I630.0 increases from 0.2 to 9 with the increasing of I557.7 from 0.1 to 10 kR. The minimum value of I557.7/I630.0 is 0.24 in the postnoon sector, the maximum and average value is 17.1 and 2.0, respectively. The I557.7/I630.0 ratio is also smaller for the same I557.7 emission intensity as it is close to magnetic noon. Consequently, the I557.7/I630.0 ratio is relatively small near magnetic noon and relatively large at dawn and dusk.

|
Fig. 3 I557.7/I630.0 ratio versus I557.7 emission intensity in the double logarithmic coordinate system in the prenoon sector |

|
Fig. 4 I557.7/I630.0 ratio versus I557.7 emission intensity in the double logarithmic coordinate system in the postnoon sector |
The model built by Xing et al. (2013) shows that the I427.8 intensity is dependent on the total energy flux of precipitating electrons and the I630.0/I427.8 ratio is related to the average energy near magnetic noon. Because the intensity of auroral arc at 427.8 nm is weak and the I557.7 intensity is roughly proportional to I427.8, our model used I557.7 emission intensity instead of I427.8 emission. The generation of aurora is quenched by collisional deexcitation. Aurora emission intensity is large through multiple collisions when the average energy of precipitating electrons is large (Paschmann et al., 2002). Collision would occur frequently as the number flux of precipitating electrons is large that can result in increase of emission intensities. So, total energy flux (the product of number flux and average energy) of precipitating electrons is larger as auroral arc emission intensity increases. In combination with the fact that the typical energies of the primary auroral electrons range between 100 and 150 km, the green line at 557.7 nm dominates the visual appearance of auroral arcs. For very soft electron spectra (~0.5 keV), the red emission (630.0 nm) above 200 km becomes prominent (Rees, 1963). Overall, average electron energy can be represented by the I557.7/I630.0 ratio. The average energy of precipitating electrons is larger as I557.7 emission intensity is larger, otherwise I630.0 emission intensity is larger.
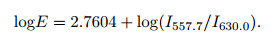
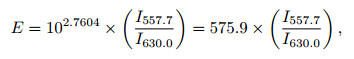
Figure 5 shows a scatter plot of average electron energy observed from DMSP versus I557.7/I630.0 ratio in the double logarithmic coordinate system. The best fit linear regression line is plotted with a solid line. The slope of linear regression line is 0.99 (≈1). From Fig. 5, we found a notable positive correlation (R = 0.82) between average electron energy and the I557.7/I630.0 ratio, because higher energy electrons can be precipitated to lower altitude exciting the green line (557.7 nm). The result shows that the fit of the energy-intensity ratio (I557.7/I630.0) relationship is good and the average electron energy can be obtained from the I557.7/I630.0 ratio. The relation can be given as

|
Fig. 5 Relation between average energy of precipitating electron and I557.7/I630.0 ratio |
|
(1) |
The average energy of precipitating electron E is given by
|
(2) |
where, the unit of average energy E is eV.
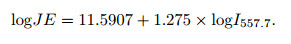
From Fig. 2, it is found that the range of green line (557.7 nm) is much wider than that of red line (630.0 nm). The I557.7 emission intensity is more suitable to represent the total energy of precipitating electron. Fig. 6 shows a scatter plot of total electron energy flux J E versus the I557.7 emission intensity in the double logarithmic coordinate system. The best fit linear regression line is plotted with a solid line. From Fig. 6, we found a notable positive correlation (R = 0.82) between the log of total electron energy flux log (J E) and the log of emission intensity log (I557.7). The relation can be given as

|
Fig. 6 Relation between the total energy flux of precipitating electron and I557.7 emission intensity |
|
(3) |
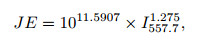
The total energy of precipitating electron J E is given by
|
(4) |
where the unit of total electron energy flux J E is eV·(cm2·s·sr)-1.
4 DISCUSSION 4.1 Source Region of Dayside Auroral ArcsWe had analyzed the cases of DMSP passing through auroral arcs above YRS in order to determine source regions in the magnetosphere. They have their own characteristics in different source regions. Fig. 7 shows a case of DMSP passing above YRS between 1420-1422 UT on December 29, 2003. ASIs (557.7 and 630.0 nm) and the orbit above YRS are plotted on the left. DMSP satellite F13 came into and out of view above YRS at 1420 UT (1720 MLT) and 1422 UT (1722 MLT), respectively. The orbit of DMSP above YRS is plotted in solid red passing through three auroral arcs marked by "*". The I557.7 (green) and I630.0 (red) emission intensity of auroral arcs, total energy flux, average energy and the spectrograms of electron and ion are plotted from top to bottom on the right. Three vertical dashed lines are labeled at the time of DMSP passing through three auroral arcs. Due to the error during coordinate mapping, there would be a little difference (a few to tens of seconds) between the calculation time and the actual value. From Fig. 7, we can see three peaks in I557.7 emission intensity variation curve corresponding to three arcs. We can also see an inverted "V" in electron spectrogram for each arc. It is found that the total electron energy fluxes of the first two auroral arcs are in the range of 1011 ~1012 eV·(cm2·s·sr)-1, the energy fluxes of 2 keV and 5 keV electrons are larger than 107 eV·(cm2·s·sr)-1, and the average electron energy is 1~2 keV. Through these characteristics, we determined the source region of the first two arcs to be BPS (Newell et al., 1991b). The third auroral arc is located at 78° MLAT in the poleward of ASI. The density and average ion energy decrease with increasing latitude and the average electron energy is low (695 eV). We determined the source region of the third arc to be Mantle (Newell et al., 1991a). In different definitions, the third arc is classified as drapery-like dayside corona by Hu et al. (2009).

|
Fig. 7 A case of DMSP passing above YRS between 1420-1422 UT on December 29, 2003 ASIs (left) of 557.7 and 630.0 nm. The auroral arc intensity (kR), total energy flux (eV·(cm2·s·sr)-1), average energy (eV) and the spectrograms of electron and ion are plotted from top to bottom on the right. |
The source region of dayside auroral arcs can be not only BPS and Mantle but also LLBL. Fig. 8 shows a case of DMSP passing above YRS between 1149-1150 UT on December 25, 2003. From Fig. 8, DMSP satellite F15 passed through one arc located at 75.6°MLAT in the equatorward of ASI. We can also see an inverted "V" in electron spectrogram for this arc. The energy fluxes of 2 keV and 5 keV electrons are less than 107 eV·(cm2·s·sr)-1, and the average electron energy is low ( < 600 eV). The source region of this arc is determined to be LLBL based on the characteristics above.

|
Fig. 8 All-sky images (left) of 557.7 and 630.0 nm and the spectrogram (right) between 1149-1150 UT on December 25, 2003 |
We found 17 cases of DMSP passing through 40 auroral arcs above YRS. Using the same method, we found the precipitating electrons of 33 dayside auroral arcs come from BPS: the I557.7 emission intensity is in the range of 0.4~5.4 kR; I557.7/I630.0 ratio is larger than 1; average electron energy is between 537 eV and 2.4 keV with an average value of 1.1 keV; total energy flux of precipitating electron is larger than 1011 eV·(cm2·s·sr)-1. It is found that the source region of 6 dayside auroral arcs is Mantle: the I557.7 emission intensity is in the range of 276~457 Rayleigh; I557.7/I630.0 ratio is between 0.4 and 1.2; average electron energy is 214~695 eV with an average value of 467 eV; total energy flux of precipitating electron is less than 1.2×10¹¹ eV·(cm2·s·sr)-1. We had found only one auroral arc among these 40 arcs produced by precipitating electron from LLBL: the I557.7 emission intensity is 457 Rayleigh; I557.7/I630.0 ratio is 0.6; average electron is 417 eV; total energy flux is 1.2×10¹¹ eV·(cm2·s·sr)-1.
4.2 Electron Spectra Inversion of Dayside Auroral ArcsUsing Eqs.(2) and (4), we can determine the average energy E and total energy flux J E of precipitating electrons from the I557.7/I630.0 ratio and I557.7 emission intensity. The relation between total energy flux J E and average energy E is given as

|
(5) |
where J is total number flux of precipitating electrons ((cm2·s·sr)-1). Fig. 9 shows average energy E, total energy flux J E and total number flux J as a function of MLT. The E variation curve is plotted with solid line in the top panel, and two dashed lines are 600 and 220 eV, respectively. Most of auroral arcs have the average larger than 600 eV. The J E variation curve is plotted in the middle panel with the value between 1011 and 1012 eV·(cm2·s·sr)-1. The J variation curve is plotted with solid line in the bottom panel, and the dashed line is corresponding to 109 (cm2·s·sr)-1. Based on the previous analysis of the cases in different source regions, the criterion for determining the source region of dayside auroral arcs can be summarized as follows: the auroral arcs with average energy more than 600 eV were classified as BPS marked by red point; the auroral arcs with average energy less than 600 eV and location (zenith angle) of arcs less than 0 ( < 76.2 MLAT) were classified as LLBL marked by green point; the auroral arcs with average energy less than 600 eV and location (zenith angle) of arcs larger than 0 (≥76.2 MLAT) were classified as Mantle marked by blue point. From Fig. 9, the main source region is BPS in the prenoon and postnoon. The number of Mantle auroral arcs is few, located in the higher latitude at dawn and dusk, which may be associated with the polar cap auroral arcs referred by Lassen and Danielsen (1978). The source region is LLBL adjacent to magnetic noon (11-13 MLT): average electron energy is between 220 and 600 eV, total electron energy flux is larger than 1011 eV·(cm2·s·sr)-1, total number flux is about 109 (cm2·s·sr)-1, located in the lower latitude.

|
Fig. 9 Average energy (top), total energy flux (middle) and total number flux (bottom) as a function of MLT |
From the bottom panel in Fig. 9, we can see the total number flux of precipitating electrons increases as it is close to magnetic noon and the maximum appears at about 1400 MLT. It is consistent with the result that the I557.7/I630.0 ratio is smaller near magnetic noon for the same I557.7 emission intensity in Figs. 2 and 3, because total number flux is inversely proportional to average electron energy (~I557.7/I630.0 ratio) from Eq.(5). Total number flux of precipitating electrons is related to the particle density in source region. Source region is mainly LLBL near magnetic noon with the particle density of 1~40/cm3 (Sckopke et al., 1981; Li et al., 2011). More precipitating electrons come from BPS in the prenoon and postnoon sectors with the particle density of 0.1~1/cm3 which is much less than that in LLBL (Eastman et al., 1984). Therefore, total number flux of precipitating electrons is larger near magnetic noon. The maximum value appears at 1400 MLT, because anti-parallel reconnection can occur easily in the mapping source region in the magnetosphere and thus particles can enter into magnetosphere precipitating to ionosphere from solar wind, resulting in an increase of electron number flux (Hu et al., 2014). From Fig. 9, source region at near 1400 MLT can be BPS or LLBL. Some dynamic processes have not been known thoroughly in this region.
5 CONCLUSIONWe have statistically analyzed the auroral arc emissions and precipitating electron spectra and discussed the source region of auroral arcs with different spectrum characteristics, surveying over 20000 multiple-wavelength and 630.0 nm) dayside auroral arc ASIs at YRS during a 4-year period, together with the particle precipitation data measured by DMSP satellites. The conclusions of this study can be summarized as follows:
(1) The 557.7 nm emission intensity has two maximum values in the hot spot and warm spot regions, with average values of 2.2 and 2.9 kR, respectively. But there is a maximum near magnetic noon for 630.0 nm emission intensity, having an average value of 1.5 kR.
(2) The I557.7/I630.0 ratio of auroral arcs increases with the I557.7 emission intensity. The I557.7/I630.0 ratio tends to increase and takes the values 0.1~10 when the I557.7 emission intensity increases from 0.1 to 10 kR.
(3) The average energy of precipitating electrons is proportional to I557.7/I630.0 ratio. There is an expo-nential relationship between total energy flux of precipitating electrons and I557.7 emission intensity.
(4) The typical region of dayside auroral arcs is BPS in the prenoon and postnoon sectors. It is also found that the precipitating electrons come from the region of Mantle, where the arcs are located poleward of dayside auroral oval. Source region of the precipitating electrons is identified as LLBL adjacent to magnetic noon, where the arcs are located in the lower latitude.
Precipitating electron spectra can be obtained using Eqs.(2) and (4), which can help us obtain the source region of dayside auroral arcs without DMSP data. The morphological and dynamic characteristics of dayside auroral arcs in different source regions require further study and discussion.
ACKNOWLEDGMENTSThis work was supported by the National Natural Science Foundation of China (41431072, 41274164 and 41504115), the Polar Environment Comprehensive Investigation and Assessment Programs (CHINARE2016-02-03, 2016-04-01), the Strategic Priority Research Program on Space Science, Chinese Academy of Sciences (XDA04060201). Thanks are also given for the Pudong Development of Scientific and Technology Program (Pkj2013-z01), the Open Foundation of the State Oceanic Administration Key Laboratory for Polar Science (KP201303) and the Top-Notch Young Talents Program of China. We thank UAP division in Polar Re-search Institute of China to supply the auroral image data. The DMSP data is from web site: http://sd-www.jhuapl.edu/Aurora/.
| [] | Ashrafi M, Kosch M J, Honary F. 2005. Comparison of the characteristic energy of precipitating electrons derived from ground-based and DMSP satellite data. Annales Geophysicae , 23 (1) : 135-145. DOI:10.5194/angeo-23-135-2005 |
| [] | Chamberlain J W. 1995. Physics of the Aurora and Airglow[M]. Washington D. C.: American Geophysical Union . |
| [] | Christensen A B, Lyons L R, Hecht J H, et al. 1987. Magnetic field-aligned electric field acceleration and the characteristics of the optical aurora. Journal of Geophysical Research , 92 (A6) : 6163-6167. DOI:10.1029/JA092iA06p06163 |
| [] | Dashkevich Z V, Zverev V L, Ivanov V E. 2006. Ratios of the I630.0/I427.8 and I557.7/I427.8 emission intensities in auroras. Geomagnetism and Aeronomy , 46 (3) : 366-370. DOI:10.1134/S001679320603011X |
| [] | Eastman T E, Frank L A, Peterson W K, et al. 1984. The plasma sheet boundary layer. Journal of Geophysical Research , 89 (A3) : 1553-1572. DOI:10.1029/JA089iA03p01553 |
| [] | Eather R H. 1969. Latitudinal distribution of auroral and airglow emissions:The 'Soft' Auroral Zone. Journal of Geophysical Research , 74 (1) : 153-158. DOI:10.1029/JA074i001p00153 |
| [] | Eather R H, Mende S B. 1972. Systematics in auroral energy spectra. Journal of Geophysical Research , 77 (4) : 660-673. DOI:10.1029/JA077i004p00660 |
| [] | Gattinger R L, Jones A V. 1972. The intensity ratios of auroral emission features. Annales De Géophysique , 28 (1) : 91-97. |
| [] | Hardy D A, Holeman E G, Burke W J, et al. 2008. Probability distributions of electron precipitation at high magnetic latitudes. Journal of Geophysical Research Space Physics , 113 (A6) : A06305. DOI:10.1029/2007JA012746 |
| [] | Hu Z J, Yang H G, Ai Y, et al. 2005. Multiple wavelengths observation of dayside auroras in visible range-A Preliminary Result of the First Wintering Aurora Observation in Chinese Arctic Station at Ny-Ålesund. Chinese Journal of Polar Research , 17 (2) : 107-114. |
| [] | Hu Z J, Yang H, Huang D, et al. 2009. Synoptic distribution of dayside aurora:Multiple-wavelength all-sky observation at Yellow River Station in Ny-Ålesund, Svalbard. Journal of Atmospheric and Solar-Terrestrial Physics , 71 (8-9) : 794-804. DOI:10.1016/j.jastp.2009.02.010 |
| [] | Hu Z J, Ebihara Y, Yang H G, et al. 2014. Hemispheric asymmetry of the structure of dayside auroral oval. Geophysical Research Letters , 41 (24) : 8696-8703. DOI:10.1002/2014GL062345 |
| [] | Jones A V. 1974. Aurora[M]. Dordrecht: D. Reidel Publishing Company . |
| [] | Jones A V, Gattinger R L, Shih P, et al. 1987. Optical and radar characterization of a short-lived auroral event at high latitude. Journal of Geophysical Research , 92 (A5) : 4575-4589. DOI:10.1029/JA092iA05p04575 |
| [] | Lassen K, Danielsen C. 1978. Quiet time pattern of auroral arcs for different directions of the interplanetary magnetic field in the Y-Z plane. Journal of Geophysical Research , 83 (A11) : 5277-5284. DOI:10.1029/JA083iA11p05277 |
| [] | Li L Y, Cao J B, Zhou G C, et al. 2011. Multiple responses of magnetotail to the enhancement and fluctuation of solar wind dynamic pressure and the southward turning of interplanetary magnetic field. Journal of Geophysical Research , 116 : A12223. DOI:10.1029/2011JA016816 |
| [] | Liou K, Newell P T, Meng C I. 1997. Synoptic auroral distribution:A survey using Polar ultraviolet imagery. Journal of Geophysical Research , 102 (A12) : 27197-27205. DOI:10.1029/97JA02638 |
| [] | Liou K, Newell P T, Meng C I, et al. 1999. Source region of 1500 MLT auroral bright spots:Simultaneous Polar UV-images and DMSP particle data. Journal of Geophysical Research , 104 (A11) : 24587-24602. DOI:10.1029/1999JA900290 |
| [] | Meng C I, Rycroft M J, Frank L A. 1991. Auroral Physics[M]. New York: Cambridge University Press . |
| [] | Newell P T, Meng C I. 1988. The cusp and the cleft/boundary layer:Low-altitude identification and statistical local time variation. Journal of Geophysical Research , 93 (A12) : 14549-14556. DOI:10.1029/JA093iA12p14549 |
| [] | Newell P T, Burke W J, Meng C I, et al. 1991a. Identification and observations of the plasma mantle at low altitude. Journal of Geophysical Research , 96 (A1) : 35-45. DOI:10.1029/90JA01760 |
| [] | Newell P T, Burke W J, Sánchez E R, et al. 1991b. The low-latitude boundary layer and the boundary plasma sheet at low altitude:Prenoon precipitation regions and convection reversal boundaries. Journal of Geophysical Research , 96 (A12) : 21013-21023. DOI:10.1029/91JA01818 |
| [] | Newell P T, Lylons K M, Meng C I. 1996. A large survey of electron acceleration events. Journal of Geophysical Research , 101 (A2) : 2599-2614. DOI:10.1029/95JA03147 |
| [] | Paschmann G, Haaland S, Treumann R A. 2002. Auroral plasma physics. Space and Science Reviews , 103 (1-4) : 21-40. |
| [] | Qiu Q, Yang H G, Lu Q M, et al. 2013. Widths of dayside auroral arcs observed at the Chinese Yellow River Station. Journal of Atmospheric and Solar-Terrestrial Physics , 102 : 222-227. DOI:10.1016/j.jastp.2013.06.002 |
| [] | Rees M H. 1963. Auroral ionization and excitation by incident energetic electrons. Planetary and Space Science , 11 (10) : 1209-1218. DOI:10.1016/0032-0633(63)90252-6 |
| [] | Rees M H, Luckey D. 1974. Auroral electron energy derived from ratio of spectroscopic emissions 1. Model computations. Journal of Geophysical Research , 79 : 5181-5186. DOI:10.1029/JA079i034p05181 |
| [] | Rees M H, Roble R G. 1986. Excitation of O (1D) atoms in aurorae and emission of the[OI] 6300-Åline. Canadian Journal of Physics , 64 (12) : 1608-1613. DOI:10.1139/p86-284 |
| [] | Sandholt P E, Carlson H C, Egeland A. 2002. Dayside and Polar Cap Aurora[M]. Dordrecht: Kluwer Academic Publishers . |
| [] | Sckopke N, Paschmann G, Haerendel G, et al. 1981. Structure of the low-latitude boundary layer. Journal of Geophysical Research , 86 (A4) : 2099-2110. DOI:10.1029/JA086iA04p02099 |
| [] | Xing Z Y, Yang H G, Wu Z S, et al. 2013. A parameter model of auroral emissions and particle precipitation near magnetic noon. Chinese J. Geophys. , 56 (7) : 2163-2170. DOI:10.6038/cjg20130703 |
| [] | Yang H G, Liu R Y, Huang D H, et al. 1997. An all-sky auroral video image analyzing system. Chinese J. Geophys.(Acta Geophysica Sinica) , 40 (5) : 606-615. |
| [] | Yang H, Sato N, Makita K, et al. 2000. Synoptic observations of auroras along the postnoon oval:a survey with all-sky TV observations at Zhongshan, Antarctica. Journal of Atmospheric and Solar-Terrestrial Physics , 62 (9) : 787-797. DOI:10.1016/S1364-6826(00)00054-7 |