 2016, Vol. 59


2 School of Geoscience and Technology, Southwest Petroleum University, Chengdu 610500, China;
3 Institute of Exploration and Development, Shengli Oil Field, SINOPEC, Dongying 257015, China;
4 Changqing Division of PetroChina Logging Company, Xi'an 718500, China
Solution caves which are the main reservoir space type in carbonate reservoir have complex causes, strong aeolotropism and are highly difficult to predict (Loucks, 1999; Zhong et al., 2012), and they are always associated with fractures because of paleokarst action, both of them control the distribution of oil to some extent (Niu et al., 2011; Shi et al., 2014). It is very meaningful to research the quantitative labeling and parameters pickup of caves' connected domain for carbonate reservoir evaluation. The image of full hole micro-resistivity imaging logging (FMI) with high resolution and vast information is an important data to reflect wellbore profile information which is used to study solution cave and fracture in carbonate reservoir, and it has wide applications in geology and petrophysics (Yan et al., 2011; Assous et al., 2013). Some scholars used FMI image to study fracture identification (Chen et al., 2004; Chitate, 2005; Chai et al., 2012), fracture information pickup (Yan et al., 2009), solution cave identification (Zhong et al., 2009, 2004), caves automatic detection (Tian et al., 1999), sedimentary facies and lithology of reef-bank reservoir identification (Chai et al., 2009) and areal porosity calculation (Xiao et al., 2010), and there are also some researchers make image processing for rock CT images, rock slice and SEM image to analyze mineral characteristics (Ye et al., 2011) and pore structure (Ge et al., 2015; Peng et al., 2011). But the studies of the method about how to label connected domain and pick up information continuously for solution cave are fewer, especially for the caves with strong aeolotropism on wellbore profile. Connected domain label is one of the algorithms about image processing, and the main label method could be divided into three classes: twice scans algorithm based on pixel labeled (Jiang et al., 2009), twice scans algorithm based on line labeled (Tu and Lu, 2010), and the label algorithm based on modules (Ma et al., 2008). On the basis of early marker algorithms, some scholars adopted many means to enhance the labeling speed (Niu et al., 2015; Wang et al., 2014; Ma et al., 2013), and applied these methods on the fields such as medical, transportation and mapping. However, these methods are rarely applied on FMI image processing.
The authors take the FMI images of hole-type carbonate reservoirs which belong to Ordovician stratum in Tarim Basin as research objects, and on the base of gray-scale and filtering processing, select an appropriate threshold to segment image to get the binary image which could reflect the holes characteristics, and the holes are black plaque on the image. What calls for special attention is that binary segmentation needs to compare the core, thus could improve the veracity. Because the image of solution caves section has a large amount of connected domains which have various shapes, and the connected domain labeling algorithm based on equivalence pair is fast and non-repeating (Zuo et al., 2011), so we use this method to label the caves connected domains. After labeling, lots of information of every connected domain can be extracted, such as radius, areal porosity and roundness, etc. The areal porosity calculated curves can be used to layering the section, and then the structure parameter distribution of every layer can be seen clearly which provides a technical support for quantitative and fast reservoir evaluation of hole-type carbonate, and is also a helpful exploration for FMI image application about quantitative extraction of cave structure information.
2 MORPHOLOGICAL CHARACTERISTICS OF SOLUTION CAVEKarstic reservoirs are distributed in carbonate formation widely, and the main types are fractured, fracturedcavern and cavern (Fig. 1) (Zhang et al., 2007). Fractured reservoir has very low matrix porosity, the intersection line of inclined fracture surface and wellhole presented as a single cycle of the sine curve on the flat development, so according the allelism of Hough transform the parameters of fracture can be collected. But for the fractured-cavern and carven reservoir, because of the strong anisotropism on the development of solution cave, and sometimes, there are some fractures accompanying, we lack available methods to extract parameters quantitatively.

|
Fig. 1 Types of carbonate karst reservoirs (Zhang et al., 2007) |
The type of solution caves, according to their form and occurrence, can be divided into spot-patch cave, banding hole, and flaky or net fracture-cave, etc. (Zhong et al., 2009). Spot-patch cave is equiaxed but the scale is small, and the diameter range of single cave is 2 mm~20 cm. The small scale (2 cm~2 cm) caves present as small spots on the core and FMI image, and the big scale ones (several cm~20 cm) are shown as patches (Fig. 2). Banding hole is some large solution caves with diameter greater than wellhole's or thickness greater than 10 cm, and the cave on the FMI image is distributed on every pole plate image continuously. This type of cave is named for the shape like banding on the core or FMI image. Top and bottom interface of banding hole are irregular, and they always incise the bedding of surrounding rock. As for flaky or net fracture-cave, the shape of single cave is flaky, and present as a line, just like a fracture, on the core or expanded FMI image. Its shape is irregular, width varies and partly expands, and the probable origin is the fracture or bedding reconstructed by dissolution. This type can also be subdivided into horizontal fracture-cave, incline fracture-cave, and vertical fracture-cave. Because of the strong anisotropism of cave and fracture-cave the situation of connected domains is complicated, and the connected domain identification method is an effective means to process cave connected domains.

|
Fig. 2 Karst carves of spot-patch shape |
The image needs gray processing and threshold segmentation to get binary image during the object identification and tracking process. There are many connected domains in the image, and in order to research every single domain, connected domains should be labeled.
The connected domain is a set composed of some pixels which have the following features. First, gray level of all the pixels should be less than or equal to the level of connected domain. Second, in the same domain, pixels are connected to each other. In other words, there exists an access constituted by the elements of this set among any pair of pixels (Zuo et al., 2011). In the binary image, connected '1' pixels or '0' pixels make up the connected domain (Wang et al., 2014). For the binary FMI image, attention should be paid to the '0' pixel domains because they represent the solution caves.
The key point of connected domain is the connectivity among pixels. In the 2D image, if the target pixel has the same value with some other pixel around it, then the pair of pixels are connected. The first thing when studying connectivity is choosing the rule of four-neighbor connection or eight-neighbor connection. The four-connected rule concerns the pixels at four positions on the upside, downside, left, and right of the target pixel. And eight-connected rule needs to deal with all the pixels in the 3×3 matrix that also include the upper left, upper right, bottom-left, and bottomright beside the four positions in four-connected rule (Fig. 3). Actually, four-neighbor connection is contained in eight-neighbor connection, but on account of the number and position of the concerned pixels, it may affect the labeling accuracy.

|
Fig. 3 Four-and eight-neighbor connectivities |
Evaluating the degree of solution caves development continuously and quantitatively on the well profile needs to detect every connected domain separately. Connected domain identification algorithm could process binary FMI image and label caves in sequence. This method has been applied on caves connectivity 2D representation in carbonate reservoir (Izgec et al., 2008) and network simulation of pore distribution (Rodriguez et al., 2011). So far, the study and improvement on this method mainly focus on two aspects, one is how to reduce time complexity and space complexity for equivalent area combination; and the other is how to get rid of the combination process and finish connected domain labeling at one time (Wang et al., 2005).
There is one or more connected domains in the binary image, and binary FMI image always has multiple connected domains. So the pixels which conform to a sort of rules (eight-connected) need be marked by same number and only the binary image be labeled accurately, the image parameter extraction will be better.
There are many image label method, and the common methods are pixel labeling algorithm, linear labeling algorithm and region growing algorithm. Maze routing algorithm and seed algorithm are mature arithmetic for connected domain detection, and they both adopt pixel labeling algorithm. Taking consideration about merit and demerit of the above algorithms, the author referenced pixel labeling algorithm and scanned the binary FMI image just once to label every pixel, meanwhile the equivalence pairs been eliminated. Ultimately, all of the connected domains are labeled and the problem of multiple labeling of the same domain is also solved.
3.3 Algorithm PrincipleThe objective of the connected domains label algorithm is getting the partition and the number of connected domains, and then, recognizing targets on the image. The input of the algorithm is an image (Er) array, named Count[ ] [ ], which is the result of FMI image after gray processing, filtering processing, binary coding and inverting. In this array, the pixel value is 0 or 1 which represent black (background color) and white (target color) on the image, and the white area stands for caves. The output is a new array, Ncount[ ] [ ], which is the labeled Count[ ] [ ], and a new image restored by the Ncount[ ] [ ]. In the new array, different value represents different connected domain. Fig. 4 is the algorithm flow chart.

|
Fig. 4 Flow chart of algorithm for connected domain marks in FMI binary image |
According to eight-connected rule, the binary image array is scanned from left to right, top to bottom. During the scan, each target pixel just needs to judge the relationship with surrounding pixels which have confirmed connectivity, and then its connectivity can also be confirmed. Different position needs to consider different neighborhood points, and Fig. 5 is all of the possible positions and Fig. 6 is the concerned neighborhood points of different position.

|
Fig. 5 Identifications of binary image array at different locations |

|
Fig. 6 Concerned neighborhood points in connected domain detection of different points |
Caves' shape and scan sequence usual lead to a situation that two areas deemed disconnected at the beginning, but with the scan process going ahead, are found to belong to the same domain, and this phenomenon is called equivalence pair. In the Fig. 6, (b), (c) and (d) three types may generate equivalence pair. The equivalence pair has to be eliminated by program, if not, it will have a strong impact on label effect and the veracity of information extraction.
In the Fig. 7, when the Fig. 7a is labeled, equivalence pair may be generated in the dashed box. As shown in the Fig. 7b, the white area is the same connected domain, but due to the influence of scan sequence, this area is marked by '8' and '14'. This result not only affects the accuracy of caves number statistics but also the veracity of information extraction. So when the equivalence pair appears during the image labeling process, it has to be delt with to evade mistakes.

|
Fig. 7 The effect comparison of before and after equivalent processing |
Take Fig. 6c as an example to explain how to dispose equivalence pair. Putting flag value of four labeled pixels into a new array B[ ] and assuming there are two non-zero and unequal values in the B[ ], then the two values are an equivalence pair. First, setting Ncount[x][y] (flag value of position '4') equal to the first non-zero value; second, finding all the flag value, in the Ncount[ ][ ], equal to the second non-zero value and recording their coordinate; at last assign the flag value of Ncount[x][y] to them. Then, the equivalence pair has been eliminated. As for the situation that the number of non-zero value in B[ ] is greater than two, we can also refer to this method. Fig. 7c shows the result after eliminating the equivalence pair, and the area's flag value is unified to '7'. After this process, the maximum flag value is the number of the caves in the image.
4 CAVES LABELING AND INFORMATION EXTRACTINGBefore extracting the information of caves and fractures, the color FMI image needs a series pretreatment to filter interference information and highlight the cave and fracture. Obviously, this is a complicated process which needs many steps to complete.
4.1 Steps(1) Image preprocessing
Firstly, making gray process to original image (Fig. 8a), and obtaining the grayscale image. Then, in order to eliminate image noise, using median filter method to realize non-linear smoothing (Fig. 8c). At last, making threshold segmentation to the image after median filter process (the threshold value should be corrected by core porosity data) and getting binary image (Fig. 8d) which lay a foundation for caves labeling and information extracting.

|
Fig. 8 Preprocessing of imaging logging image and holes labeling and information picking up |
(2) Labeling and extracting
Based on the Fig. 8d, labeling all of connected domains and extracting length, width, inscribed circle radius and circumradius of each domain (Fig. 8e). Actually the labeled image still is binary image, and the difference is that connected domains have been labeled by continuous numbers. Then, every single domain's parameters could be obtained, and the magnified image is Fig. 8f, in which the label is clear. At last, calculating surface porosity curves in depth domain (Fig. 8g and Fig. 8h whose interval is 20 pixels), which contributes to study the level of solution caves development and layer image in the processing.
4.2 Parameters(1) The length, width, inscribed circle radius and circumradius of connected domains
Ⅰ. The length of connected domain is the number of pixels between left-most pixel and right-most pixel (including endpoints). Ⅱ. Its width is the number of pixels between top pixel and bottom pixel (including endpoints), and then these four endpoints can be used to draw bounding rectangle of the domain. Ⅲ. Inscribed circle radius has two values, one equals to half of short edge (RinS) and the other is half of long edge (Rinl). Ⅳ. Circumradius is half of the bounding rectangle diagonal. According to these definitions, writing a program to output all parameters and count their distribution (Fig. 9) which can reflect caves development level (If the wellbore diameter is known, compare width of image and wellbore perimeter, the relationship between pixel and real size can be calculated).

|
Fig. 9 Different parameter information distributions of connected domain |
(2) Roundness of connected domain
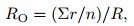
Roundness is an important structural feature parameter to describe the angular rounded degree of rock fragments. It is irrelevant to the shape of fragment, but the sharp degree of angular. Its geometrical significance is the corner curvature of fragment biggest projective plane shadow (Zhu, 2008), and Wadell proposed roundness computational formula in 1932:
|
(1) |
where r is inscribed circle radius of corner, n is the number of corner, R is the maximum inscribed circle radius of fragment.
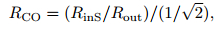
In the labeled FMI image, describing the similarity of connected domain shape and circle need to learn from rock fragment roundness definition and formula. But actually, connected domain roundness is different from fragment, besides the parameters in the formula are not convenient to write program. So, this article defined the similarity of bounding rectangle and square as “connected domain roundness”, and it can be calculated by this formula:
|
(2) |
where RinS is the short inscribed circle radius, Rout is the circumradius. The denominator means that in the square, the specific value of inscribed circle radius and circumradius is 1/√2, and this value could be the standard. Making a comparison of the specific and standard value, the “roundness” will be more intuitive.
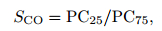
(3) Sorting coefficient of connected domain
The sorting coefficient is a parameter about the degree of sediment sorting which shows the uniformity of fragments and the deviation of sediment surrounding the centralized tendency (Zhu, 2008). The formula is SO=P25/P75, and the P25 and P75 represent the particle diameters which correspond to cumulative percentage 25% and 75% on the cumulative curve. The author attempts to use this formula to represent sorting coefficient and modify the formula:
|
(3) |
where, PC25/PC75 is the radius specific value of cumulative percentage 25% and 75% corresponding value on the cumulative curve of inscribed circle radius or circumradius. After calculating, sorting coefficient of inscribed circle radius (RinS) and circumradius are 2.25 and 2.6. Sometimes, in the processing there are no PC25 and PC75, the variance also can be used to represent sorting. Combining sorting coefficient concept of sediment, SCO could be the basis to divide sorting level: SCO=1~2.5, well sorted; SCO=2.5~4.0, moderate sorted; SCO > 4.0, poorly sorted.
(4) Cave density
It means the number of caves on the unit length and the formula is:

|
(4) |
where N is the number of caves, L is the image length. On account on the differences of the uniformity of solution caves development, if only use this parameter to evaluate caves the result will not be accurate enough. So by using the density and sorting coefficient both, the evaluation of caves development can be more comprehensive.
5 EXAMPLE ANALYSIS AND APPLICATIONOn the basis of the detailed steps introduced above, we use an example to explain connected domains identification method application on FMI image labeling and caves information extracting.
The first step is the image pre-processing. Make gray-scale process, median filter and threshold segmentation of a long original FMI image (Fig. 10a), and get the gray level image (Fig. 10b), Median filter image (Fig. 10c) and binary image (Fig. 10d).

|
Fig. 10 Example of connected domain image labeling |
The next, using the algorithm to label all connected domains in the binary image (Fig. 10d), and the labeled image can be obtained (Fig. 10e). After that, calculate surface porosity curves (Fig. 10f) and histogram (Fig. 10g) at an interval of 20 pixels in depth domain of labeled image or binary image (Fig. 10d). This work laid a foundation for image layering and finding caves development level in depth domain.
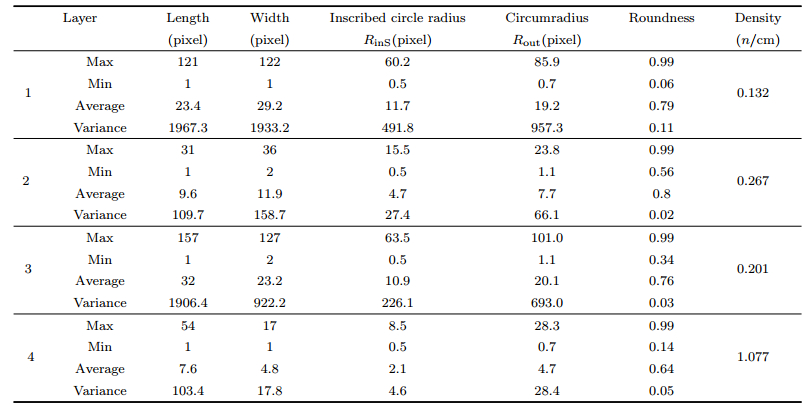
At last, accomplish the image layering (Fig. 11a) and connected domain information extraction. Image layering is mainly based on the surface porosity data (Fig. 10f). And then, extract length, width, inscribed circle radius, circumradius and roundness. In the end, the distribution of inscribed circle radius (Fig. 11b), circumradius (Fig. 11c) and roundness (Fig. 11d) of every layer can be counted. Quantitative parameters information in the Fig. 11 and Table 1 can reflect solution caves development degree and anisotropism, which are beneficial for geological characteristics evaluation of wellbore.

|
Fig. 11 Example of picking up parameter information after connected domain labeling |
|
|
Table 1 Picking up connected domain parameters information in different layers |
Full hole micro-resistivity imaging logging (FMI) data after processing could be showed as a high resolution color image. And making gray-scale process, median filter and threshold segmentation of the FMI image, then a binary image will be obtained which can reflect the characteristic of solution caves on the wall of a well, and in which the holes are black plaques. This characteristic can only reflect caves development and morphological characteristics of different layer qualitatively.
Utilizing the labeling algorithm for image connected domain based on equivalence pair processing could label the domains accurately and extract parameters information quantitatively including radius, surface porosity and roundness.
Layering surface porosity curve and extracting caves' structure parameters such as sorting coefficient and cave density which reflect caves development degree and anisotropism in depth domain. This work is a useful exploration for FMI image application, and in the future research, image 3D information processing and commercialize software will be more helpful for geological characteristics accurate evaluation of wellbore.
ACKNOWLEDGMENTSThis work was supported by Open Fund (PLN201612) of State Key Laboratory of Oil and Gas Reservoir Geology and Exploitation (Southwest Petroleum University) and the National Natural Science Foundation of China (41202110). The authors also thank Zhang Y F in School of Geoscience and Technology, Southwest Petroleum University for providing the image logging data.
| [] | Assous S, Whetton J A, Elkington P A. 2013. Microresistivity image inpainting and visualization.//SPE Annual Technical Conference and Exhibition. New Orleans, Louisiana, USA:SPE. |
| [] | Chai H, Li N, Xiao C W, et al. 2009. Automatic discrimination of sedimentary facies and lithologies in reef-bank reservoirs using borehole image logs. Applied Geophysics , 6 (1) : 17-29. DOI:10.1007/s11770-009-0011-4 |
| [] | Chai H, Li N, Xiao S J, et al. 2012. High-resolution rock structure image processing method and its applications in carbonate reservoir evaluation. Acta Petrolei Sinica (in Chinese) , 33 (Suppl. 2) : 154-159. |
| [] | Chen G H, Wu W S, Wang Z W, et al. 1999. Fracture identification by microresistivity scanner log. Well Logging Technology (in Chinese) , 23 (4) : 279-281. |
| [] | Chitale V. 2005. Borehole imaging in reservoir characterization:implementation of a standard interpretation workflow for the clastic-and carbonate reservoirs.//SPWLA 46th Annual Logging Symposium. New Orleans, Louisiana. |
| [] | Ge X M, Fan Y R, Li J T, et al. 2015. Pore structure characterization and classification using multifractal theoryAn application in Santanghu basin of western China. Journal of Petroleum Science & Engineering , 127 : 297-304. |
| [] | Izgec O, Keys R S, Zhu D, et al. 2008. An integrated theoretical and experimental study on the effects of multiscale heterogeneities in matrix acidizing of carbonates.//SPE Annual Technical Conference and Exhibition. Denver, Colorado, USA:SPE. |
| [] | Jiang T, Qiu M, Chen J, et al. 2009. LILA:a connected components labeling algorithm in grid-based clustering.//Proceedings of the 1st International Workshop on Database Technology & Applications. Wuhan, Hubei:IEEE:213-216. |
| [] | Loucks R G. 1999. Paleocave carbonate reservoirs:origins, burial-depth modifications, spatial complexity, and reservoir implications. AAPG Bulletin , 83 (11) : 1795-1834. |
| [] | Ma J L, Zhao Z M, Meng Y, et al. 2008. Connected component labelling for massive remote sensing classification image. Computer Engineering (in Chinese) , 34 (1) : 262-264. |
| [] | Ma Y H, Zhan L J, Xie C J, et al. 2013. Parallelization of connected component labeling algorithm. Geography and Geo-Information Science (in Chinese) , 29 (4) : 67-71. |
| [] | Niu L Q, Peng M, Sun Z L, et al. 2015. Fast connected components labeling by propagating labels of run sets. Journal of Computer-Aided Design & Computer Graphic (in Chinese) , 27 (1) : 128-135. |
| [] | Niu Y J, Kang Z H, Long X, et al. 2011. Origin and evolution of Ordovician karst cave reservoir in Tahe oilfield. Geoscience (in Chinese) , 25 (4) : 650-659. |
| [] | Peng R D, Yang Y C, Ju Y, et al. 2011. Computation of fractal dimension of rock pores based on gray CT images. Chinese Science Bulletin , 56 (31) : 3346-3357. DOI:10.1007/s11434-011-4683-9 |
| [] | RodrÍguez J E, Cruz I, Vergés E, et al. 2011. A connected-component-labeling-based approach to virtual porosimetry. Graphical Models , 73 (5) : 296-310. DOI:10.1016/j.gmod.2011.06.001 |
| [] | Shi S Y, Hu S Y, Liu W, et al. 2014. Ordovician paleokarst cave system and its controlling factor in Xekar, Tarim Basin. Natural Gas Geoscience (in Chinese) , 25 (2) : 167-177. |
| [] | Tian J W, Gao Q, Du Y J, et al. 1999. An automatic detection method of cave based on borehole imaging logging image. Journal of Jianghan Petroleum Institute (in Chinese) , 21 (2) : 20-22. |
| [] | Tu X, Lu Y. 2010. Run-based approach to labeling connected components in document images.//Proceedings of the 2nd International Workshop on Education Technology and Computer Science. Wuhan, China:IEEE, 206-209. |
| [] | Wang J, Zhang Y N, Luo J C, et al. 2005. Improved connected component labeling on high-resolution remote sensing image. Computer Engineering and Applications (in Chinese) , 41 (10) : 37-39, 112. |
| [] | Wang K, Huang S, Zhao Y, et al. 2014. Improved algorithm of connected component labeling for image targets extraction. Computer Engineering and Design (in Chinese) , 35 (7) : 2438-2441, 2498. |
| [] | Xiao C W, Liu X L, Zhang C S, et al. 2010. Characterizing fractured-vuggy carbonate reservoirs quantitatively based on the integration of well and seismic.//SPWLA 51th Annual Logging Symposium. Perth, Australia. |
| [] | Yan J P, Cai J G, Shou X Y, et al. 2009. Intelligent picking method of the fracture information from imaging logging. Natural Gas Industry (in Chinese) , 29 (3) : 51-53. |
| [] | Yan J P, Cai J G, Zhao M H, et al. 2011. Application of electrical image logging in the study of sedimentary characteristics of sandy conglomerates. Petroleum Exploration and Development (in Chinese) , 38 (4) : 444-451. |
| [] | Ye R Q, Niu R Q, Zhang L P. 2011. Mineral features extraction and analysis based on multiresolution segmentation of petrographic images. Journal of Jilin University (Earth Science Edition) (in Chinese) , 41 (4) : 1253-1261. |
| [] | Zhang S Y, Qin X Y, Wang S X. 2007. Research on horizon division and transverse contrast of carbonate karst reservoir.//SEG Technical Program Expanded Abstracts 2007. SEG:358-362. |
| [] | Zhong G F, Liu R L, Liu J H, et al. 2004. Identifying the paleocaves in Ordovician in Tabei Uplift by electro-imaging logs. Natural Gas Industry (in Chinese) , 24 (6) : 57-60. |
| [] | Zhong G F, Hui G J, Yang H J, et al. 2009. Electrical image logs applied to predict the distribution of Ordovician paleocaves in east Lungu area, Tarim Basin. Natural Gas Industry (in Chinese) , 29 (10) : 24-27. |
| [] | Zhong J H, Mao C, Li Y, et al. 2012. Discovery of the ancient Ordovician oil-bearing karst cave in Liuhuanggou, North Tarim Basin, and its significance. Science China:Earth Science , 55 (9) : 1406-1426. DOI:10.1007/s11430-012-4467-3 |
| [] | Zhu X M. 2008. Sedimentary Petrology. 4th ed (in Chinese)[M]. Beijing: Petroleum Industry Press: 56 -71. |
| [] | Zuo M, Zeng G P, Tu X Y, et al. 2011. A connected domain labeling algorithm based on equivalence pair in binary image. Computer Simulation (in Chinese) , 28 (1) : 14-16, 50. |