Recent interests have arisen in longitudinal differences in thermospheric mass density, which are associated with heating in the aurora oval (Hedin and Carignan, 1985; Forbes et al., 1999; Xu et al., 2013) or the effects of upward-propagating atmospheric tides (Oberheide et al., 2011). Xu et al. (2013) investigated longitudinal variations in the daily mean mass density and found that the mass density is hemispherically asymmetric and that peaks of positive density are located near the magnetic poles, with the conclusion that Joule heating and particle heating (Hedin and Carignan, 1985; Forbes et al., 1999) are most likely to be the main physical processes that give rise to the longitudinal structure. Oberheide et al. (2011) analyzed the tidal spectrum of neutral density at low and middle latitudes observed by the Challenging Minisatellite Payload (CHAMP) satellite and the results simulated by the Climatological Tidal Model of the Thermosphere (CTMT) and found that the CTMT reproduced the seasonal and latitudinal variations in the thermospheric non-migrating tidal components (DE1, DE2, DE3, and SW4) and that those components mainly originated from lower layers, except for the DW2 and D0 components, which were most likely generated in situ by nonlinear processes.
Significantly, the ion drag force, which plays important roles in the coupling between neutrals and ions, has been ignored by previous studies. The relative phenomena in the ionosphere and thermosphere are driven by ion drag, for example, the F2 region equatorial anomaly in the electron density (Thomas, 1968) and the equatorial thermospheric density anomaly (Liu et al., 2006). Neutral density depletions are also associated with equatorial plasma bubbles (Park et al., 2010).
Longitudinal differences in the electron density have been discovered by recent researches (Zhang et al., 2011, 2012; Luan and Dou, 2013; Zhao et al., 2013; Xu et al., 2014; Wang et al., 2015). A global map of all these reported longitudinal differences is presented in CHAMP electron density data, which exhibit obvious wave-2 (two peaks and two troughs) and wave-1 (one peak and one trough) structures in the northern and southern hemispheres (Wang et al., 2015). The zonal wind, in combination with the geomagnetic field geometry, plays the largest role in causing ionospheric zonal asymmetry (Zhang et al., 2011, 2012; Luan and Dou, 2013; Zhao et al., 2013; Xu et al., 2014; Wang et al., 2015). Wang et al. (2015) also investigated the role that meridional wind, solar heating, migrating tides, and high-latitude activities played in the longitudinal variations in F region electron density based on CHAMP observations and simulations using the Global Ionosphere-Thermosphere Model (GITM).
This work mainly studies longitudinal variations in thermospheric mass density at mid-latitudes and reveals a possible mechanism of their origin by using both CHAMP observations and GITM. The GITM performs well in reproducing the observed longitudinal differences in both electron density and zonal wind (Wang et al., 2015), which demonstrates its ability to capture key processes in the mid-latitude ionosphere. Using the same model for simulations, this study will investigate the thermosphere in terms of zonal asymmetry.
2 SATELLITE AND MODELchamp has a circular, near-polar orbit at an inclination of 83.7°. its initial altitude was~450 km (Reigber et al., 2002), but during 2007-2009 its altitude had decreased to an average of~337 km. its orbit covers all local times within 130 days by combining the ascending and descending nodes. the thermospheric mass density was deduced from measurements by the space three-axis accelerometer for research missions (star) accelerometer on board champ. details of the method used for derivation can be found in Doornbos et al. (2010).
The GITM is a three-dimensional model developed at University of Michigan, which simulates the ionosphere and thermosphere (Ridley et al., 2006). The model solves continuity, momentum, and energy equations for the thermosphere and ionosphere with realistic source terms. The GITM is initiated by using the Mass Spectrometer Incoherent Scatter (Hedin, 1991) and the International Reference Ionosphere (Bilitza, 2001) models for neutral and ion densities and temperatures. The magnetic topology is described by the international geomagnetic reference field (Maus et al., 2005).
The solar minimum years (2007 to 2009, with an average F10.7 index of about 73) and mid-latitudes (±40°~60° magnetic latitude) were subjected to investigation. Four seasons were defined, each with a length of 131 days centered on the solstices and equinoxes, in order to cover the full local time cycle for CHAMP. The data were sorted into bins for geographical longitude (GLon) and magnetic local time (MLT), with resolutions of 15° in longitude and 1 h in MLT. The longitudinal mean value was subtracted from each MLT sector to represent the longitudinal variation.
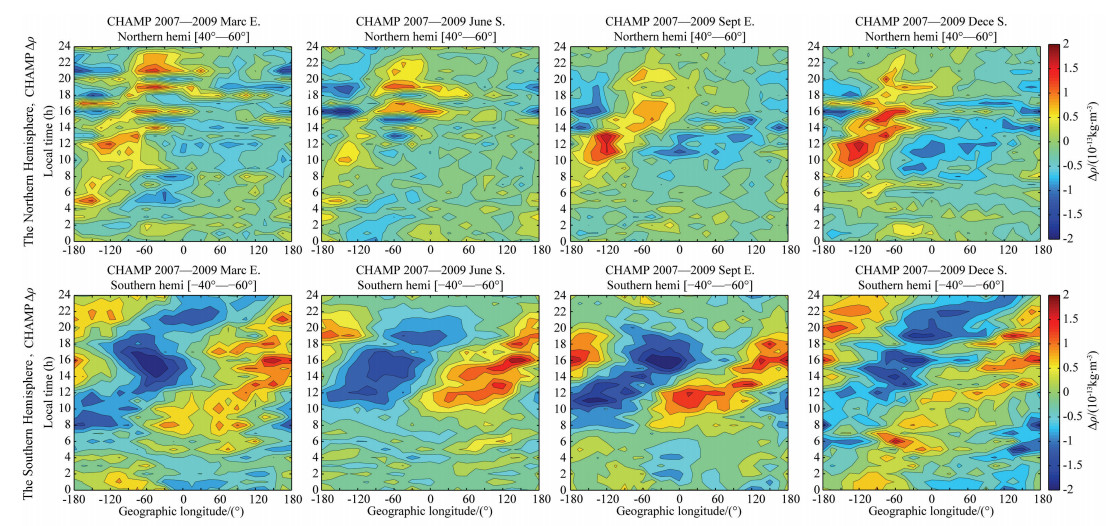
3 RESULTSFigure 1 shows the local time and geographical longitudinal variations in the difference in thermospheric density ∆ρ, which indicates that the longitudinal mean has been subtracted. Obvious longitudinal differences can be noticed, which display wave-1 structure in the longitudinal direction (i.e., one peak and one trough). The wave phase changes with the local time, with the phase 180° reversed in the dawn and dusk sectors. The waves are almost out of phase in the northern and southern hemispheres. The deviations in thermospheric density remain negative over the European and Asian sectors (0°E-180°E). In contrast, the longitudinal differences over North America are substantial (180°W-0°W): ρ increases from west to east in the afternoon, while decreases before noon. In the southern hemisphere, ρ exhibits variations on a larger scale by longitude: ρ is higher in the evening over the southern Pacific Ocean area (180°W-60°W), but lower around noon compared with values over the South Atlantic and Indian Ocean areas. From top to bottom different seasons are shown, which indicate that the longitudinal and local temporal asymmetries in thermospheric density appear consistently in all seasons. The strongest longitudinal differences mainly occur in the MLT sector of 8-22 MLT at the September equinox and June solstice, but cover almost all MLT values at the December solstice and March equinox.

|
Fig. 1 Geographical longitudinal and magnetic local time variation of the differentce in the neutral density (△ρ) at magnetic mid-latitudes, as observed by CHAMP in both hemispheres. From left to right are at March Equinox, June Solstice, September Equinox, and December Solstice |
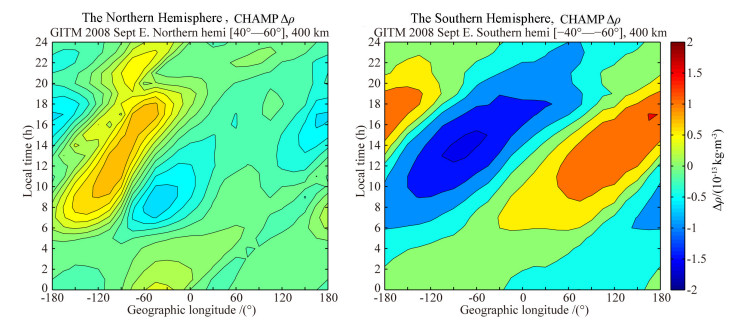
The neutral density simulated by GITM at the September Equinox is shown in Fig. 2. The model was run for 48 hours to reach a quasi-steady state and then continued from the startup simulation for another 24 hours, which were used for analysis. The parameters input into the GITM are as follows: interplanetary magnetic field (IMF) components: Bx=0.20 nT, By=0.13 nT, Bz=-0.26 nT, solar wind velocity Vx=452 km·s-1, F10.7=73 ω·m-2·Hz-1, hemispheric power=26.5 GW. The tides from the lower boundary of the GITM (mesosphere or lower atmosphere) were turned off. Thus, we mainly focused on the physical mechanism of ionosphere-thermosphere coupling.

|
Fig. 2 Same format as Fig. 1, but for the neutral mass density simulated by GITM at September Equinox. Tides have been turned off at the lower boundary of the model |
By comparison between Fig. 1 and Fig. 2, it can be seen that GITM has reproduced CHAMP observations quite well on a large scale. There exists an obvious wave-1 structure, with ρ almost out of phase in the two hemispheres. The peaks and troughs moved eastward with the MLT. In the northern hemisphere, the peak is mainly located over North America (180°W-0°W), with no peak in the Europe-Asia region (0°E-180°E), whereas the peak expanded over almost all MLT sectors in the southern hemisphere. The simulations were generally consistent with observations of large-scale structures. Therefore, the GITM model could be used for theoretical studies to analyze the longitudinal structure of neutral mass density.
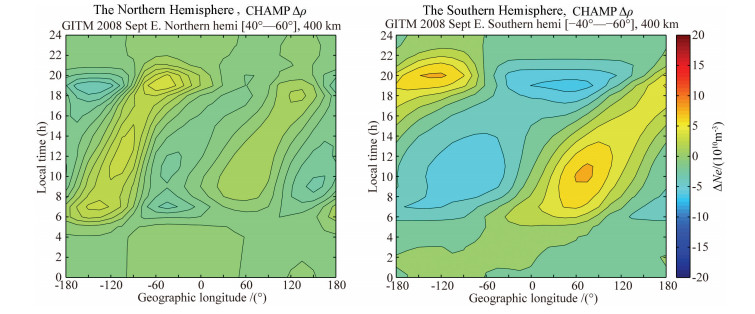
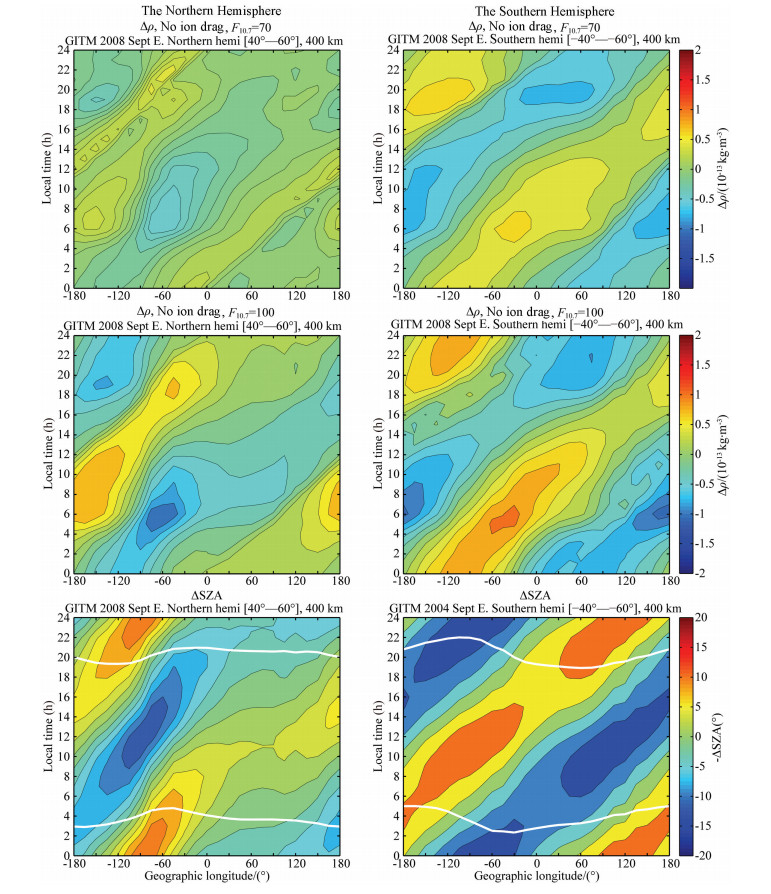
4 DISCUSSIONDuring solar minimum years, the longitudinal differences in neutral density can be compared to the electron density, which is shown in Fig. 3 (compare with Fig. 2). The longitudinal variations are consistent on a large scale in the southern hemisphere. The most significant difference between the electron density and the neutral density exists in the northern hemisphere. There are wave-2 structures in the electron density along the longitudinal profile, but only wave-1 structures in the air mass density. Peaks in electron density occur over both North America (180°W-0°W) and the Europe-Asia region (0°E-180°E). The west-east differences in the electron density are relatively slighter in the Europe-Asia sectors, where the differences in the geomagnetic declination angle are smaller in comparison with those in the North American or Southern Ocean areas (Wang et al., 2015). In addition, the longitudinal difference in the vertical plasma velocity due to zonal wind is slight in the Europe-Asia region, which explains the slight difference in the electron density. The longitudinal wave-1 structure of ∆ρ only exists in the North America sector, with no peak over Europe-Asia at any local time. The ion drag is not strong enough to affect the mass density. The effect of ion drag can be seen more clearly from a GITM simulation. When ion drag is neglected, the simulated thermospheric density is shown in the top panel of Fig. 4. The longitudinal and local temporal differences are reduced in amplitude by almost 50% (40%) in terms of the maximum value of the peak-trough difference. From both observations and simulations, it can be said that ion drag plays an important role in the longitudinal modulation of air mass density.

|
Fig. 3 As Fig. 1, but for electron density Ne observed by CHAMP. Densities are given in 1010 m-3 |

|
Fig. 4 Top panels: air mass density simulated by the GITM with the effect of ion drag turned off. Middle panels: same as top panels, except that F10.7=100 ω·m-2·Hz-1. Bottom panels: for the solar zenith angle (SZA) at the September equinox. The over-plotted white lines indicate the position of the solar terminator (SZA=100°) |
The question arises of what mechanism can explain the remaining longitudinal structure of ρ when the effect of ion drag is negligible. One answer could be solar illumination, which can change the neutral temperature and hence lead to a contracted or expanded thermosphere. Accordingly, the thermospheric density at an altitude of 400 km can increase or decrease. Previous studies have shown that the primary cause of the low temperatures and air mass densities during the prolonged solar minimum period of 2007-2009 remains unusually low levels of solar extreme ultraviolet (EUV) irradiance (Solomon et al., 2010, 2013). A reduction in solar EUV irradiance by 10% can decrease the thermospheric density by 30% at an altitude of 400 km (Solomon et al., 2013).
Owing to the displacement of the geographical and geomagnetic poles, the magnetic mid-latitudes (40°~60°) extend over different geographical latitudes for different longitudinal sectors. For longitudinal sectors near the magnetic poles (90°W for the north pole and 120°E for the south pole), the geographical latitudes are relatively low. In contrast, the longitudinal sectors away from the magnetic poles have higher geographical latitudes. The difference in geographical latitudes of the magnetic mid-latitudes (40°~60°) in the northern (southern) hemisphere is 17° (27°). There exists a longitudinal difference in solar heating, as the solar zenith angle (SZA) varies with the geographical latitude. The effects of the SZA on neutral density are shown in Fig. 4 (bottom panels). A positive value means a larger SZA with less sunlight than the longitudinal mean. We define SZA < 100° as indicating sunlight, whereas SZA≥100° indicates darkness at an altitude of 400 km (Wang et al., 2005). The over-plotted white lines indicate the solar terminator (i.e., SZA=100°), which separates sunlit from dark conditions. It can be seen that the daytime solar illumination is stronger around 90°W GLon in the northern hemisphere, but stronger around 120°E in the southern hemisphere. The situation is reversed at nighttime. The peak-to-trough variation in the SZA can reach 20° in the northern hemisphere and 30° in the southern hemisphere. These result in a wave-1 structure of the SZA in the longitudinal and local temporal frame in both hemispheres, which resembles that of the simulated value of ρ, as shown in the upper panels of Fig. 4. It can be said that solar photoionization plays an important role in forming the background pattern of ρ.
Our assumption is proved by the following results. The longitudinal variation in the air mass density, as well as the variation with MLT, are shown in Fig. 4 (middle panels) when we only increased the F10.7 index from 73 ω·m-2·Hz-1 to 100 ω·m-2·Hz-1 with the other parameters kept constant, and the effects of ion drag were ignored. By comparison with Fig. 4 (top panels) (F10.7=70 ω·m-2·Hz-1), the longitudinal variation in air density has increased significantly. The value of the difference between peaks and troughs has been increased by a factor of about 1.5 (2.1) in the southern (northern) hemisphere. Longitudinal differences in solar heating play an important role in the variation in air density.
Our work mainly focuses on longitudinal variations in air density in quiet conditions at mid-latitudes. Heating in the aurora oval may have a more significant influence in periods of magnetic storms. Longitudinal differences in air density are induced by in situ processes in the thermosphere when the atmospheric tides are turned off at the lower boundary of the GITM. There exists an obvious wave-1 structure in both hemispheres, which implies that the non-migrating tidal component (D0) plays the main role. In this work, solar heating and ion drag both make contributions to the D0 component, and atmospheric tidal effects will be discussed separately in our future work.
5 SUMMARYThe longitudinal modulation of the mid-latitudinal thermospheric density (ρ) during the solar minimum period from 2007 to 2009 has been investigated. Both CHAMP observations and simulations using the GITM were utilized in the analysis. Some interesting conclusions are as follows:
(1) There exists an obvious wave-1 structure of thermospheric neutral density, with the waves almost out of phase in the northern and southern hemispheres. The peaks and troughs move eastward with the MLT.
(2) The most significant difference between the electron density (wave-2) and the neutral density (wave-1) exists in the northern hemisphere, as the differences in geomagnetic declination angle are smaller in the EuropeAsia sector, where the difference in electron density is slight. The ion drag is not strong enough to affect the mass density.
(3) The longitudinal difference in neutral density is reduced by about 40%~50% when ion drag is turned off. From the above, it can be seen that ion drag plays an important role in the longitudinal difference in air density.
(4) The longitudinal difference in the SZA can reach 20°~30° in both hemispheres. Thus, the longitudinal difference in air density can also be induced by solar irradiation heating.
ACKNOWLEDGMENTSThe operational support of the CHAMP mission by the German Aerospace Center (DLR) is gratefully acknowledged. The solar wind and IMF data are from NASA/GSFC’s Space Physics Data Facility’s OMNIWeb service. The work is supported by the National Nature Science Foundation of China (41674153, 41521063, 41431073).
| [] | Bilitza D. 2001. International reference ionosphere 2000. Radio Sci. , 36 (2) : 261-275. DOI:10.1029/2000RS002432 |
| [] | Doornbos E, van Den Ijssel J, Lühr H, et al. 2010. Neutral density and crosswind determination from arbitrarily oriented multiaxis accelerometers on satellites. J. Spacecraft. Rockets , 47 (4) : 580-589. DOI:10.2514/1.48114 |
| [] | Forbes J M, Palo S E, Marcos F A. 1999. Longitudinal structures in lower thermosphere density. J. Geophys. Res. , 104 (A3) : 4373-4385. DOI:10.1029/1998JA900036 |
| [] | Hedin A E, Carignan G R. 1985. Morphology of thermospheric composition variations in the quiet polar thermosphere from Dynamics Explorer measurements. J. Geophys. Res. , 90 (A6) : 5269-5277. DOI:10.1029/JA090iA06p05269 |
| [] | Hedin A E. 1991. Extension of the MSIS thermosphere model into the middle and lower atmosphere. J. Geophys. Res. , 96 (A2) : 1159-1172. DOI:10.1029/90JA02125 |
| [] | Liu H X, Lhr H, Watanabe S, et al. 2006. Zonal winds in the equatorial upper thermosphere:Decomposing the solar flux, geomagnetic activity, and seasonal dependencies. J. Geophys. Res. , 111 (A7) . DOI:10.1029/2005JA011415 |
| [] | Luan X, Dou X. 2013. Seasonal dependence of the longitudinal variations of nighttime ionospheric electron density and equivalent winds at southern midlatitudes. Ann. Geophys. , 31 (10) : 1699-1708. DOI:10.5194/angeo-31-1699-2013 |
| [] | Maus S, MacMillan S, Chernova T, et al. 2005. The 10th-generation international geomagnetic reference field. Geophys. J. Int. , 161 (3) : 561-565. DOI:10.1111/gji.2005.161.issue-3 |
| [] | Oberheide J, Forbes J M, Zhang X, et al. 2011. Climatology of upward propagating diurnal and semidiurnal tides in the thermosphere. J. Geophys. Res. , 116 (A11) : A11306. |
| [] | Park J, Lühr H, Min K W. 2010. Neutral density depletions associated with equatorial plasma bubbles as observed by the CHAMP satellite. J. Atmos. Sol.-Terr. Phys. , 72 (2-3) : 157-163. DOI:10.1016/j.jastp.2009.11.003 |
| [] | Reigber C, Lühr H, Schwintzer P. 2002. CHAMP mission status. Adv. Space Res. , 30 (2) : 129-134. DOI:10.1016/S0273-1177(02)00276-4 |
| [] | Ridley A J, Deng Y, Tóth G. 2006. The global ionosphere-thermosphere model. J. Atmos. Sol. -Terr. Phys. , 68 (8) : 839-864. DOI:10.1016/j.jastp.2006.01.008 |
| [] | Solomon S C, Woods T N, Didkovsky L V, et al. 2010. Anomalously low solar extreme-ultraviolet irradiance and thermospheric density during solar minimum. Geophys. Res. Lett. , 37 (16) : L16103. |
| [] | Solomon S C, Qian L Y, Burns A G. 2013. The anomalous ionosphere between solar cycles 23 and 24. J. Geophys. Res. , 118 (10) : 6524-6535. DOI:10.1002/jgra.50561 |
| [] | Thomas L. 1968. The F2-region equatorial anomaly during solstice periods at sunspot maximum. J. Atmos. Sol. -Terr. Phys. , 30 (9) : 1631-1640. DOI:10.1016/0021-9169(68)90011-1 |
| [] | Wang H, Ridley A J, Zhu J. 2015. Theoretical study of zonal differences of electron density at midlatitudes with GITM simulation. J. Geophys. Res. , 120 (4) : 2951-2966. DOI:10.1002/2014JA020790 |
| [] | Wang H, Lühr H, Ma S Y. 2005. Solar zenith angle and merging electric field control of field-aligned currents:A statistical study of the Southern Hemisphere. J. Geophys. Res. , 110 (A3) : A03306. |
| [] | Xu J Y, Wang W B, Gao H. 2013. The longitudinal variation of the daily mean thermospheric mass density. J. Geophys. Res. , 118 (1) : 515-523. DOI:10.1029/2012JA017918 |
| [] | Xu J S, Li X J, Liu Y W, et al. 2014. TEC differences for the mid-latitude ionosphere in both sides of the longitudes with zero declination. Adv. Space Res. , 54 (5) : 883-895. DOI:10.1016/j.asr.2013.01.010 |
| [] | Zhang S R, Foster J C, Coster A J, et al. 2011. East-West Coast differences in total electron content over the continental US. Geophys. Res. Lett. , 38 (19) : L19101. |
| [] | Zhang S R, Foster J C, Holt J M, et al. 2012. Magnetic declination and zonal wind effects on longitudinal differences of ionospheric electron density at midlatitudes. J. Geophys. Res. , 117 (A8) : A08329. |
| [] | Zhao B Q, Wang M, Wang Y G, et al. 2013. East-west differences in F-region electron density at midlatitude:Evidence from the Far East region. J. Geophys. Res. , 118 (1) : 542-553. DOI:10.1029/2012JA018235 |
 2016, Vol. 59

