 2016, Vol. 59


2 Beijing Engineering and Technology Research Center of Rail Transit Line Safety and Disaster Prevention, Beijing 100044, China
In recent years, as highway and railway transportation has grown in the central and western regions of our country, mountain tunnel engineering is increasing, with the result that the geological hazards and problems of tunnel engineering are becoming increasingly apparent (Qian, 2012 ; Li et al., 2014 ). In order to understand the geological situation of tunnel construction sites, geological surveying methods based on geophysical theory have been developed, such as technologies based on infrared thermal imaging of ground water (Wang et al., 2003 ), geological radar surveying techniques and transient electromagnetic forces (Xue et al., 2008 ; Liu et al., 2015 ), nuclear magnetic resonance (NMR) imaging (Yi et al., 2013 ) and measurements of seismic wave velocity, land sonar, TSP, TGP, HSP, TST and so on (He et al., 2000 ; Liu et al., 2003 ; Zhong, 2007 ; Liu, 2009 ; Xiao et al., 2012 ; Hu, 2013 ; Li et al., 2014 ). These various technologies have begun to be widely used in the field of geological hazard detection. Among these, the TRT detection technology especially is gradually becoming recognized by the specialists in the industry because of its unique technical characteristics.
The full name of TRT is True Reflection Tomography, and it is developed by the C-Thru Ground Sith land geological equipment company. The prominent characteristics of TRT are as follows:
(1) This method allows three-dimensional observation, via a detector and shock point layout on the tunnel or constraints on both sides, which results in full spatial wave field information with limited extension in lateral distribution.
(2) TRT data processing uses seismic tomography technology to improve the positioning precision for analysis of the wave velocity and adverse geological bodies by the study of the speed of tunnel geological body scans and migration imaging. Thus, TRT has an advantage over the negative velocity method, TSP, TGP and HSP technology, although there are similarities between TST technology and TRT technology (Zhao, 2007 ).
(3) As for the assessment of the outcome, TRT technology identifies the existence and position of hazardous geologic bodies by receiving and processing the seismic signals generated by artificial sources and reflected from unfavorable geological sections (e.g., joint fissure zones, fault fracture zones, soft rock, karst, etc.), which is made possible by the real 3-D imaging, and makes the results more intuitive.
(4) in the cost of tunnel exploration is almost zero, TRT does not consume material, and has the additional advantages of being easy to operate, requiring a short time to complete the study and having little impact on the construction, all of which are beneficial to the construction site.
The use of TRT technology to advance geological forecasting has become widespread since it appeared in the United States, including in Japan, New Zealand, Austria, Switzerland and Australia, among other countries. The the system was introduced into our country in 2006 and has been successfully applied in several domestic tunnel engineering projects, and has had some relatively satisfactory detection achievements. At the same time, as with any other advanced prediction technology, there are still some problems with TRT technology that must be solved. For example, the interpretation of TRT image is not systemic, and the types of disasters do not have a unified understanding, so there is often the potential for deviation or error. Furthermore, the algorithm used by the TRT system has some deficiencies and defects, which should be optimized in order to improve the prediction accuracy. Unfortunately, few studies have examined how to improve the system.
2 TRT TECHNOLOGY CHARACTERISTICS 2.1 Basic PrincipleTRT technology identifies potential geological disasters caused by abnormal areas in the selected tunnel site by examining the velocity of the seismic wave as it passes between layers of geological bodies in the tunnel site. The principle can be simply explained as follows: when seismic waves travel across the interface between two adjacent layers, a reflected wave is received by the TRT system, and the transmission seismic wave continues to spread forward until it meets a geological interface once again, at that point reflection and refraction occur again because of the wave impedance difference (Tarantola, 1984 ; Tarantola, 2005 ; Wang, 2015 ). Therefore, the seismic wave can result in multilayer reflection signals from tunnel geological interface, and TRT depends on the collection of these multilayer reflection signals to create a three-dimensional image of the medium in the tunnel through three-dimensional inversion.
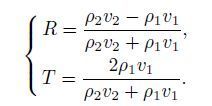
In addition, according to the reflection and transmission coefficient formula (1) (Zhang, 2007 ), the strength of the reflection and transmission of the seismic wave is directly related to the geotechnical properties of the geological body (Zhang et al., 2012 ; Hu et al., 2014 ). In other words, as the local seismic waves spread from soft rock into hard rock, the reflection coefficient is positive, and in the opposite direction, the reflection coefficient is negative. When the interface wave impedance between rock mass varies considerably, reflection is strong and transmission is weak; when there is little variation, reflection is weak and transmission is strong. These regular research outcomes are conducive to arriving at a comprehensive judgment of the lithologic characteristics in the tunnel detection zone.
|
(1) |
In the formula (1), R is the reflection coefficient; T is the transmission coefficient; v1 and v2 are the corresponding propagation velocity of the seismic wave before and after the interface of the rock and soil mass. ρ1 and ρ2 are the corresponding density of rock and soil before and after the interface.
2.2 Observation Method 2.2.1 Hammer focal point selection and layoutTRT system relies mainly on the use of a hammer as the excitation source, and the focal point layout can be divided into two forms: the side wall configuration and working face configuration. The difference between these forms is that when the surface of rock is hammered, the rock perpendicular to the direction of the hammer is mainly influenced by the compression effect, resulting in a longitudinal wave, and the main direction of propagation is vertical to the acting face. Whereas the rock on the two sides of the hammering point is mainly influenced by shearing action, resulting in a transverse wave, with the main direction of propagation is parallel to the acting face (Fig. 1 ). Therefore, when the tunnel wall is hammered on both sides, the TRT system is able to accept the shear wave reflective signal better; When the tunnel working face is hammered, the TRT system can receive P-wave reflected signal better.

|
Fig. 1 The main propagation direction of longitudinal and transverse waves excited by hammering |
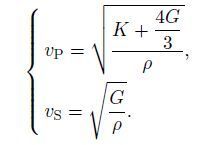
However, based on formula (2), we can see that (Ma et al., 2005 ; Dai, 2013 ) there are different factors that influence the parameters of the propagation velocity of the longitudinal wave and transverse wave in the medium. The velocity of the longitudinal wave is related to the bulk modulus, shear modulus and density of the medium, while the transverse wave velocity is related only to the shear modulus and density of the medium.
|
(2) |
In formula (2), vP, vS is the propagation velocity of the longitudinal and transverse waves in the medium; K is the bulk modulus of the medium; G is the shear modulus of the medium; ρ is the medium density.
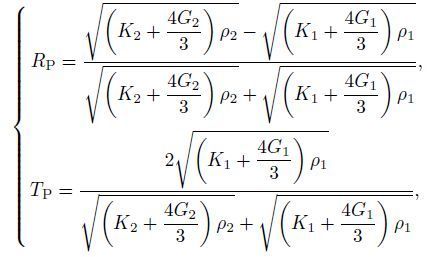
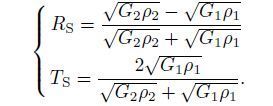
Inserting formula (2) for the longitudinal and transverse velocity into Eq.(1), we see that:
|
(3) |
|
(4) |
In formula (3) and (4), it can be seen that the longitudinal wave can continue to spread after transmission if the interface behind the medium is water (Gwater = 0), while transverse wave will be completely reflected; it is unable to propagate in water to continue to spread. Therefore, the importance of the transverse wave in tunnel water disaster detection is obvious (Zhang et al., 2011 ).
In addition, the hammering operation in the tunnel working face is not safe. Therefore, considering the various factors, the source point of the TRT system is usually on the side wall of the tunnel. The details are as follows: two groups of sources are placed on each side wall about 5∼10 m from the working face; each group along the vertical arrangement consists of 3 focal points about 1 m apart, and the group interval is about 2 m (Fig. 2 ).

|
Fig. 2 The distribution sketch map of hypocenter and receiving point |
For detection, the TRT system generally requires the installation of 10 sensors in the tunnel to receive the reflection signal of the geological body in front of the tunnel. The specific form is as follows (Fig. 2 ) : 10 sensors are arranged in 4 sections with 2 or 3 sensors in each section; the nearest section is 10 m behind the last source; the distance between sections is 5 m; therefore, there are 4 sensors on each side wall and two on the top. A confocal ellipsoid (see Fig. 3 ), which is composed of the focal point and the receiving point, is positioned to realize the three-dimensional imaging of the anomalous body. The formula can be expressed as

|
(5) |

|
Fig. 3 The sketch map about observation principle of TRT system |
In the formula, xfk, yfk and zfk are reflection point coordinates; xsi, ysi and zsi are source point coordinates; xrj, yrj and zrj are receiving point coordinates; v is the velocity of seismic wave, tikj is the propagation time of the focal point to the reflection point to the receiving point; i, j and k are the number of source points and receiving points and reflection points.
2.3 Features of Resultant ImageTRT result images can be prepared for a variety of chromatographic analysis; the most common chromatographic combination is yellow and blue. In the yellow and blue chromatogram, the yellow area indicates that the rock mass is relatively hard, and the wave velocity is relatively high. The blue area indicates that the rock mass is relatively weak, and the wave velocity is relatively low. According to the practical application of the TRT system, it can be concluded that the results of the image can be roughly divided into four types of abnormal areas by analysis of the corresponding type of image and the actual disaster TRT results: cluster anomaly area, single anomaly area, fault anomaly area and interbedded anomaly area. Each of these abnormal areas has its corresponding features.
In the cluster anomaly area, the main feature is that the yellow and blue area is random, so that it has the characteristic of a cluster with no obvious distribution law. The single abnormal area is in a sheet or strip shape, and the absolute value of the reflection coefficient is larger. When the regional anomaly is plate-like, the disaster characteristics generally show water solubility or water tank with fracture zone (Fig. 4a ). When the abnormal body is a strip, the disaster characteristics show a weak fracture zone or karst mud belt (Fig. 4b ).

|
Fig. 4 Typical image of anomaly area located in cluster zone (a) Weak fracture zone or cave filled mud zone.(b) Watery-cave zone or watery-fissure zone; |
In the single anomaly area, the main characteristic is that one or several blue abnormal regions appear in the yellow area, usually in a block or strip shape. When it is a block shape, the blue border is more obvious, which is the general appearance of the unfilled cave (Fig. 5a ). When it is a strip shape, the blue border is more blurred, generally indicates the presence of karst mud (Fig. 5b ).

|
Fig. 5 Typical image of anomaly area located in single rock mass (a) Non-filled type cave;(b) Filled type cave |
In a fault anomaly area, the main feature is the yellow, blue or yellow and blue combination areas, which indicates the obvious fault location; that is, there exists an offset in the reflection area of the same nature. As shown in Fig. 6a, the presentation of the reflection region is a fault structure. In addition, due to the relative motion between the faulted rock, the rock may be influenced by the effect of tension, compression and shear stress, which results in the surrounding rock fissures becoming susceptible to water erosion, and gradually form a broken rock zone in the fault position (Fig. 6b ), and the surrounding rock becomes relatively less stable.

|
Fig. 6 Typical image of fault anomaly area (a) Fault rocks;(b) Fault rupture zone. |
In an interbedded anomaly area, the main characteristic is that the yellow and blue areas are lamellar interbeds, and the absolute value of the reflection coefficient is relatively small. When the anomaly area appears in the front part of the image, it indicates the existence of weak rock between rock masses (Fig. 7a ). When the interbedded anomaly area appears in the image back, in addition to possible soft rock, there may be interference from other clutter waves. These are mainly due to the seismic wave energy decreasing with the increasing distance. The interference of the clutter wave to the back area is relatively large, resulting in the appearance of detection interference area in the rear (Fig. 7b ).

|
Fig. 7 Typical image of interbedded anomaly area (a) Weak rock;(b) Cluttered wave interference. |
Dividing the TRT results of the image features may clearly indicate the type of the disaster potential in the tunnel. It could also guide the improvement and optimization of the tunnel design and construction scheme, and avoid the damage caused by unreasonable design.
3 THE IMPROVED OPTIMIZATION METHOD FOR TRT TECHNOLOGY 3.1 Existing ProblemsThe imaging technology of the TRT system currently relies on the relative explanatory principle, namely, that after the acquisition of seismic signals, the first thing that must be done is to intercept the direct wave and establish a background velocity field according to the gathered discrete velocity information. The next step is to conduct the scan analysis for unknown geological features under the velocity field background, and combine the results with the wave information to calculate the location of geological anomaly areas and the degree of deviation of the background velocity. The last step is to refer to the related geological data in order to analyze and interpret the geological conditions of the surrounding rock in front of the tunnel. It can be seen that the reasonable selection of the background wave velocity is very important for the accuracy of the TRT prediction technique. However, there are currently some problems with the selection of the background wave velocity in TRT technology.
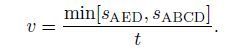
One problem is the existence of errors in the calculation of direct wave velocity by TRT technique. At present, the TRT technique calculates the direct wave velocity based on the straight-line distance between the source point and the receiving point, divided by the propagation time. The linear propagation path is in air, so the direct wave is difficult to reach in this path because the original rock had been removed, and the actual path of direct wave is the shortest curve along the rock medium surrounding the tunnel (Fisher et al., 1993 ; Zhang et al., 2006 ) that is, min [sAED, sABCD](Fig. 8 ).

|
Fig. 8 The shortest path of the actual propagation of direct wave |
The second problem is that the selection of the background velocity occurs in blindness to some degree. When the TRT system collects data, it often hammers at a source n times in order to increase the detection accuracy (for 12 focal points and 10 receiving points), allowing the TRT system to intercept 120 n direct waves in tunnel detection. Because the surrounding rock is not homogeneous, the direct wave velocity is composed of a large number of discrete velocity points in time displacement coordinates. The TRT system uses manual methods to select the wave velocity that gets through the origin point and the most discrete velocity line as the background velocity of the TRT system. There is a certain amount of subjectivity in assigning the background velocity that often leads to inaccuracy in the background velocity and bias in the predicted results.
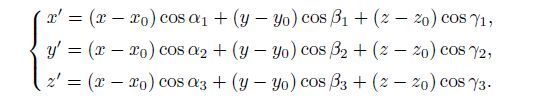
3.2 Methods 3.2.1 Method to improve the first problemIn the calculation of the direct wave velocity, the original space coordinate system o-xyz should be converted appropriately, and the new space coordinate system o’-x’y’z’(Fig. 9 ) should be set up (Hofmann, 2001 ; Chen et al., 2004 ). The specific conversion method can be derived from the formula (6) :
|
(6) |
In the formula, x0, y0, z0 are the coordinates of new coordinate origin point in the original coordinate system; α1, β1 and γ1 are the positive angles of o’x’ axis with ox, oy, oz axis; α2, β2 and γ2 are positive angles of o0y0 with oy, oz and ox axis; α3, β3 and γ3 are the positive angles of o0z0 axis with ox, oy, oz axis.
To obtain the improved velocity of the direct wave, the new coordinate system should be distributed in the plane, after which the shortest distance of the direct wave from the source to the receiving point should be calculated, and then divided by the corresponding time. Let's take the calculation and analysis of a horseshoeshaped tunnel for an example. The upper part of the tunnel is a semi-circle, the lower part is a rectangle. Let the focal point coordinates be (xs’, ys’, zs’), and the receiving point coordinates be (xr’, yr’, zr’). The tunnel radius is r, and the height of the side wall is h, as shown in Fig. 10.

|
Fig. 9 Sketch map of coordinate conversion |

|
Fig. 10 Sketch map of tunnel section |
When zs’ > h, zr’ > h, and the distance of the direct wave to the vault propagation can be written as
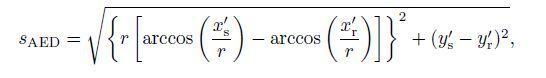
|
(7) |
The propagation distance of the direct wave in the tunnel bottom can be written as
|
(8) |
And the direct wave velocity is as follows
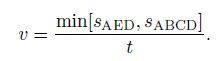
|
(9) |
Similarly, when zs’ > h, 0 ≤ zr’ ≤ h or 0 ≤ zs’ ≤ h, zr’ > h, the velocity of the direct wave could be calculated, and when 0 ≤ zs’≤ h, 0 ≤ zr’ ≤ h, the velocity of the direct wave could also be determined. The direct wave velocity calculated by this method reflects the actual situation of the direct wave propagation better than the original TRT calculation method does.
3.2.2 Method to improve the second problemAccording to statistics theory, the research found that the direct wave captured by the TRT system exhibits a normal distribution, so it is necessary to deal with the velocity distribution characteristics using the principle of normal distribution (Yang et al., 2003 ; Wang et al., 2012 ). In order to calculate the velocity of wave of the confidence interval so that the confidence level is 1-a, the confidence interval of the upper and lower velocity values recorded by the TRT system were analyzed, thus obtaining the TRT three-dimensional image under the background value of the above-limit velocity. In this way, we avoid the blindness that results from the artificial selection of background wave velocity, and reduce the error risk of the single background wave velocity, which causes the TRT prediction results to have a certain interval.
In addition, what must still be paid attention to is that, in order to deal with the distortion of the wave velocity, the data must be reasonably filtered in the process of data processing.
4 ANALYSIS OF EXAMPLESIn order to demonstrate the prediction effect of TRT wave velocity before and after our suggested improvements, we will examine two typical examples of analyzed tunnels, namely, the Heping tunnel (ZK74+626∼ZK74+ 476) and the Xiuwen tunnel (D2K313+611∼D2K313+761).
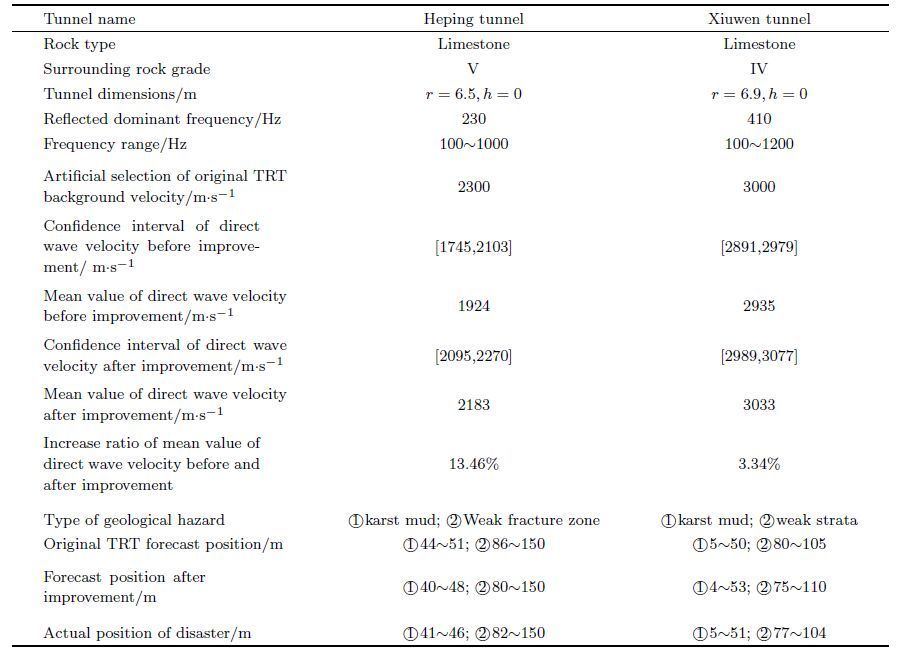
Now, in order to utilize the TRT system to model the two examples of tunnel construction, the modeling dimensions are x × y × z=40 m×200 m×40 m, the tunnel working faces in two models are all at 45 m, the effective detection range is within 155 m in front of working face. The main aim of this analysis is to determine the geological structure of the surrounding rock and detect the disaster distribution. In addition, we will record and analyze the variation and distribution before and after the improvement of speed on tunnel rock types, rock grade, tunnel size, frequency, frequency range and velocity of reflection condition (Table 1 and Figs. 11 -12 ) ; judge the types of geological disasters on tunnel and distribution range comprehensively; and compare the velocity difference before and after improvements with the results of the TRT image features (Figs. 13 -14 ).(Note: the confidence interval of the direct wave velocity before and after the improvement is carried out at a confidence level of 1-0.05)
|
|
Table 1 Comparison of actual tunnel detection parameters between before and after improvement |

|
Fig. 11 Comparison of wave velocity before and after improvement in the Heping tunnel |

|
Fig. 12 Comparison of wave velocity before and after improvement in the Xiuwen tunnel |

|
Fig. 13 TRT results of the background velocity before and after improvement in the Heping tunnel (a-unimproved image; b, c-improved image) (a) TRT image when the background wave velocity is 2300 m·s-1;(b) TRT image when the background wave velocity is 2095 m·s-1, (c) TRT image when the background wave velocity is 2270 m·s-1. |
Through analysis of the relevant parameters in Table 1 for the two tunnels' velocity before and after the improvement, combined with the contrast of velocity distribution before and after the improvement shown in Figs. 11 and 12, it can be seen that the overall distribution of direct velocity is improved to a certain extent over the original TRT distribution of direct velocity. The degree of enhancement is mainly affected by the overall size, focal points and the receiving location and layout of the tunnel surrounding rock properties and other factors of tunnel excavation. At the same time, through analyzing before and after the improvement of the two tunnel velocity increase mean rate, we can see that the Heping tunnel and Xiuwen tunnel velocity increase mean rates are 13.46% and 3.34%, respectively, and as it is shown, while discrete direct velocity is greatest, the improvement is more obvious before and after the changes of mean velocity.
In addition, through the analysis results of TRT images of the two tunnels' velocity before and after improvement (Figs. 13 -14 ), we can see that the two tunnels' velocity before and after the improvement of image feature results doesn't change significantly, but the disaster position in the model has a comparative distance change. Comparing the predicted position with the actual position in the tunnel disaster point in Table 1, we can determine that when using the original artificial TRT method to determine the background velocity, there is an obvious deviation of the predicted results from the actual situation, since the deviation distance increases as the forecast distance increases, making the positioning of rear area disaster in the tunnel usually inaccurate This is because the propagation time of a front disaster wave is relatively short, so the cumulative error is small, but the propagation time of a rear disaster wave is relatively long, making the accumulated error obvious. When using the TRT background velocity selected in the improved method, the background wave velocity is the lower and upper bound velocity corresponding to the confidence level interval. Thus, it can designate the corresponding forecast area in the image of TRT results for a disaster's starting and ending location. Although this form of prediction interval may sometimes be relatively conservative, but it can effectively avoid the omission phenomenon of disaster, and therefore reduce disaster risk.

|
Fig. 14 TRT results of the background velocity before and after improvement in the Xiuwen tunnel (a-unimproved image; b, c-improved image) (a) TRT image when the background wave velocity is 3000 m·s-1;(b) TRT image when the background wave velocity is 2989 m·s-1;(c) TRT image when the background wave velocity is 3077 m·s-1. |
(1) The essay takes the characteristics and existing problems of the TRT system as the starting point, discusses the basic principles of the system, including the layout and observation methods, and the advantage of the shear wave in tunnel geological exploration (i.e., it is sensitive to tunnel water detection). The paper points out that the location of the geological abnormal body in the unimproved TRT system is done by using the confocal ellipsoid, which is composed of the focal point and the receiving point, and the location changes with time.
(2) The essay is based on a large number of research results from the application of TRT technology in the tunnels in questions. Summarizing the characteristics of various TRT patterns of typical geological disasters in the corresponding TRT map, the abnormal area is divided into four types: cluster anomaly, single anomaly, fault anomaly and interbedded anomaly. The paper then describes the corresponding features of the anomaly area.
(3) The paper is aimed at the problem of TRT technology itself, namely, that the calculation of the velocity of direct wave is not accurate because the selection of the background velocity is not reasonable. To solve this problem, the paper puts forward an improvement method in order to obtain the focal point to the actual direct wave receiving point, and calculate the shortest path of direct wave in the actual transmission tunnel body, and then, according to the distribution characteristics of the actual direct wave, obtain the confidence interval for the actual direct wave velocity at the confidence level of 1-a under normal conditions. The paper also tried to establish the confidence interval of the upper and lower limits as the background velocity, and then, recording them into the TRT system, we obtain two groups of results for the TRT images, thus eliminating the blindness and monotony of the artificial fixed background velocity, and resulting in the improved disaster prediction for a certain range of considerations.
(4) This essay compared the tunnel prediction results for velocity before and after improvement, and found that the improved prediction effect is clearly better than the original that relied on artificial prediction to set the background velocity. Furthermore, although the results may sometimes be relatively conservative, they can effectively avoid the omission phenomenon when the background velocity is artificially selected.
(5) Although some progress has been made in the development of the physical exploration technology of tunnels, it is difficult to achieve the goal of accurate prediction by any particular method or means. Therefore, for complicated geological tunnel section, for instance, when TRT results show that there is a large number of disaster points or direct wave velocity dispersion, it may be appropriate to increase the frequency of prediction, or to combine this method with other forecasting methods in order to improve the prediction accuracy of tunnel disaster interpretation and positioning to reduce the risk of tunnel disaster.
ACKNOWLEDGMENTSThis work was supported by the National Natural Science Foundation of China (41372351), Fundamental Research Funds for the Central Universities (2015YJS121, 2015JBM064)
| [] | Chen Y, Shen Y Z, Liu D J. 2004. A simplified model of three dimensional-datum transformation adapted to big rotation angle. Geomatics and Information Science of Wuhan University (in Chinese) , 29 (12) : 1101-1105. |
| [] | Dai J. 2013. Dynamic Behaviors and Blasting Theory of Rock[M].2nd ed. Beijing: Metallurgical Industry Press . |
| [] | Fischer R, Lees J M. 1993. Shortest path ray tracing with sparse graphs. Geophysics , 58 (7) : 987-996. DOI:10.1190/1.1443489 |
| [] | He Z Q, Li H, Liang Y Z. 2000. Geological super-leading forecast during tunnel construction by utilizing seismic response analysis method. Journal of Railway Engineering Society (in Chinese) (4) : 81-85. |
| [] | Hofmann-Wellenhof B, Lichtenegger H, Collins J. 2001. Global Positioning System:Theory and Practice. 5th ed. Berlin:Springer-Verlag[M]. . |
| [] | Hu Y. 2013. Application of advance geological forecast technology (HSP) in tunnel construction. Modern Tunnelling Technology (in Chinese) , 50 (3) : 136-141. |
| [] | Hu Y, Yu X H, Li S L, et al. 2014. Improving the accuracy of geological model by using seismic forward and inversion techniques. Petroleum Exploration and Development (in Chinese) , 41 (2) : 190-197. |
| [] | Li S C, Liu B, Sun H F, et al. 2014. State of art and trends of advanced geological prediction in tunnel construction. Chinese Journal of Rock Mechanics and Engineering (in Chinese) , 33 (6) : 1090-1113. |
| [] | Li Y N, Wang G B. 2014. The research progress of TRT technology. Chinese Journal of Engineering Geophysics (in Chinese) , 11 (6) : 852-858. |
| [] | Liu L B, Qian R Y. 2015. Ground Penetrating Radar:A critical tool in near-surface geophysics. Chinese J. Geophys. (in Chinese) , 58 (8) : 2606-2617. DOI:10.6038/cjg20150802 |
| [] | Liu Y Z. 2009. TGP tunnel seismic wave forecast system and its technology. Geophysical and Geochemical Exploration(in Chinese) , 33 (2) : 170-177. |
| [] | Liu Z G, Liu X F. 2003. TSP application and development in tunnel lead forecast. Chinese Journal of Rock Mechanics and Engineering (in Chinese) , 22 (8) : 1399-1402. |
| [] | Ma Z G, Xie J G. 2005. Relationship among compressional wave, shear wave velocities and density of rocks. Progress in Geophysics (in Chinese) , 20 (4) : 905-910. DOI:10.3969/j.issn.1004-2903.2005.04.004 |
| [] | Qian Q H. 2012. Challenges faced by underground projects construction safety and countermeasures. Chinese Journal of Rock Mechanics and Engineering (in Chinese) , 31 (10) : 1945-1956. |
| [] | Tarantola A. 1984. Inversion of seismic reflection data in the acoustic approximation. Geophysics , 49 (8) : 1259-1266. DOI:10.1190/1.1441754 |
| [] | Tarantola A. 2005. Inverse Problem Theory and Methods for Model Parameter Estimation. Philadelphia, USA:SIAM. |
| [] | Wang H W, Li N. 2012. Linear regression analysis for normal distribution-valued data based on complete information. Journal of Beijing University of Aeronautics and Astronautics (in Chinese) , 38 (10) : 1275-1279. |
| [] | Wang H Z, Feng B, Wang X W, et al. 2015. Analysis of seismic inversion imaging and its technical core issues. Geophysical Prospecting for Petroleum (in Chinese) , 54 (2) : 115-125. |
| [] | Wang Y, Chen Q, Wei Y Y, et al. 2003. Application of infrared acquisition technology in prediction of water gushing in Yuanliangshan tunnel. Chinese Journal of Rock Mechanics and Engineering (in Chinese) , 22 (5) : 855-857. |
| [] | Xiao Q H, Xie C J. 2012. Application of tunnel seismic tomography to tunnel prediction in karst area. Rock and Soil Mechanics (in Chinese) , 33 (5) : 1416-1420. |
| [] | Xue G Q, Li X. 2008. The technology of TEM tunnel prediction imaging. Chinese J. Geophys. (in Chinese) , 51 (3) : 894-900. DOI:10.3321/j.issn:0001-5733.2008.03.031 |
| [] | Yang S Q, Zhang X M, Sun C D. 2003. Testing study on acoustic property of marble block. Journal of Liaoning Technical University (in Chinese) , 22 (6) : 772-775. |
| [] | Yi X F, Li P F, Lin J, et al. 2013. Simulation and experimental research of MRS response based on multi-turn loop. Chinese J. Geophys. (in Chinese) , 56 (7) : 2484-2493. DOI:10.6038/cjg20130734 |
| [] | Zhang M G, Cheng B J, Li X F, et al. 2006. A fast algorithm of shortest path ray tracing. Chinese J. Geophys. (in Chinese) , 49 (5) : 1467-1474. DOI:10.3321/j.issn:0001-5733.2006.05.026 |
| [] | Zhang X, Li S C, Zhang Q S, et al. 2011. Field-testing study on seismic reflection response of large-scale underground water-bearing body. Chinese J. Geophys. (in Chinese) , 54 (5) : 1367-1374. DOI:10.3969/j.issn.0001-5733.2011.05.026 |
| [] | Zhang Y F. 2007. Seismic Exploration Principle and Data Interpretation of Reflected Wave[M]. Beijing: Geological Publishing House . |
| [] | Zhang Y H, Fu X D, Sheng Q. 2012. Effect research of unfavorable geologic structure on elastic P-wave propagation using DDA method. Journal of Sichuan University (Engineering Science Edition) (in Chinese) , 44 (5) : 86-92. |
| [] | Zhao Y G. 2007. Analysis and recommendation of tunnel prediction techniques at home and abroad. Progress in Geophysics(in Chinese) , 22 (4) : 1344-1352. DOI:10.3969/j.issn.1004-2903.2007.04.047 |
| [] | Zhong S H, Sun H Z, Wang R. 2007. Research on survey effects of faults and karst caves using land-sonar in tunnel construction. Tunnel Construction (in Chinese) (Suppl. 2) : 21-25. |