 2016, Vol. 59


2 Earthquake Administration of Yunnan Province, Kunming 650224, China
In recent decades, a number of large artificial water reservoirs are built worldwide to supply the increasing requirement of household and industrial electricity. However, a number of damaging reservoir-triggered earthquakes (RTE) have been recorded after water filling of some reservoirs in China and abroad. For instance, earthquakes were recorded in Xinfeng Jiang reservoir area in Guangdong province of China one month after the first water filling on October 20, 1959; and an M6.1 earthquake occurred on March 19, 1962 when the water level was 110.5 m (Qin et al., 2009 ). The M6.3 Keyna earthquake occurred on December 11, 1967 in Keyna reservoir area which is aseismic before the first filling in 1962(Lee and Raleigh, 1969 ), is so far the largest and most destructive reservoir-triggered earthquake (Gupta, 2002 ). The large RTE are usually more destructive and cause casualty and property losses because they are usually adjacent to the dam, towns and villages and shallow with higher epicentral intensity (Zhou et al., 2010 ). Hence, the reservoir-triggered (-induced) seismicity is an important research topic in seismology. Considering the stress level changes related to water filling is much smaller than the stress drop associated with earthquakes, it is appropriate that the earthquakes associated with water filling of artificial reservoirs are classified as “reservoir-triggered seismicity (RTS) ”(Gupta, 2002 ), thus we uniformly call the earthquakes associated with the filling of reservoir as “RTS” in this paper. Many researchers studied and investigated the locations and seismic activity of the RTS occurred in the Xinfeng Jiang, Three Gorges, and Longtan reservoir area, as well as the velocity models and structural distributions beneath these reservoir areas (Hu and Chen, 1979 ; Gupta, 2002 ; Chen et al., 2009 ; Liao et al., 2009 ; Ma et al., 2013 ), which could provide considerable constraint information for studying the triggering mechanisms of the RTS.
The Xiaowan reservoir is a major artificial reservoir located in the middle and lower section of Lancang Jiang in western Yunnan province which is an active tectonic regions. The maximum height of the reservoir dam is ∼292 m; the normal elevation of storage water level is ∼1242 m and the maximum storage capacity is ∼149×108 m3. The reservoir consists of the western Lancang Jiang (∼178 km) and the eastern Heihui Jiang (∼124 km) which spans Dali, Lincang, and Baoshan in Yunnan province. The maximum elevation is ∼1160 m near the dam area and ∼1210 m near the tail and northern reservoir area, the overall topography is high in the southeastern and low in the northwestern reservoir area. The first filling of Xiaowan reservoir started on December 16, 2008, and the water level increased rapidly from 996 m to 1100 m in July 2009; the maximum water level reached 1210 m in October 2010. Obviously increased seismicity in partial region of Xiaowan reservoir area is observed during the early two cycles of rapid variation in water level (Fig. 1 ). Subsequently, the water level changes annually from 1200 m to 1250 m and intense seismic activities are observed in the vicinity of Xiaowan reservoir area. The destructive M4.9 earthquake occurred in September 2012 in Shidian area is only ∼50 km to the dam.

|
Fig. 1 Distribution of active faults, seismic stations and earthquakes around Xiaowan reservoir (a) Distribution of epicenters recorded by the Xiaowan Seismic Network (XSN) ;(b) Frequency-magnitude distribution from the XSN catalogue;(c) Variation of the frequency of seismicity within Xiaowan reservoir area since 1965;(d) Magnitude-time relation within the reservoir area (M ≥ 1.0). The red and blue dots are the recorded earthquakes; the blue lines are the boundaries of Xiaowan reservoir; the green lines are the rivers in the reservoir area. Active faults: F1 Lancang Jiang fault; F2 Weixi-Qiaohou South fault; F3 Weixi-Qiaohou North fault; F4 Wuliangshan fault; F5 Changning fault; F6 Pupiao-Shidian fault; F7 Kejie fault; F8 Longling-Ruili fault; F9 Nujiang fault; F10 Tengchong fault; F11 Longling-Lancang fault; F12 Nantinghe fault; F13 Honghe fault; F14 Datianshan fault; F15 Shuijing-Gongguoqiao fault. |
Based on the former studies, the characteristics of RTS are: 1) the earthquake magnitude is relatively small, usually smaller than M5(There are less than 20 M ≥ 5.0 RTS cases recorded in the world) ; 2) the distances from the epicenter to the reservoir rim and the focal depths are generally less than 10 km; 3) there are evident correlations between the RTS and water filling process, the largest reservoir-triggered earthquake usually occurs before or after 2∼3 filling cycles when the water level reaches the peak level; 4) the b values of RTS are relatively higher than the b values of the tectonic earthquakes occurred in the same area (Hu et al., 1979 ; Ding, 1989 ; Mekkawi et al., 2004 ; Nascimento et al., 2004 ; Liao et al., 2009 ; Ma et al., 2013 ). Furthermore, the RTS are classified as the rapid response and delayed response type according to the time relation between the RTS and the variations of water level (Simpson et al., 1988 ). However, it is difficult to distinguish the tectonic earthquakes and the RTEs, especially when earthquakes occurred in the vicinity of the reservoir located in the active tectonic regions, for instance, it is still a noteworthy and unsolved question that whether the Zipingpu reservoir played a role in triggering Wenchuan MS8.0 earthquake (Chen, 2009 ; Kerr, 2009 ; Cheng et al., 2012 ).
Considering that the shallow focal depths are important features of RTS, we relocate the small to moderate earthquakes occurred in the vicinity of Xiaowan reservoir area using Double-difference method (Waldhauser et al., 2000 ; Yang et al., 2005 ; Zhu et al., 2005 ; Li et al., 2007 ; Waldhauser et al., 2008 ; Chen et al., 2009 ; Balfour et al., 2012 ; Diehl et al., 2013 ; Fang et al., 2015a, 2015b ) combined with waveform cross-correlation (CC). The CC method has the advantage to eliminate the phase pick errors causing earthquake relocating deviations (Schaff et al., 2004 ). We eventually analyze the characteristics of seismicity in the vicinity of Xiaowan reservoir and the potential seismogenic mechanisms on the basis of the precise relocations, the relation between the seismicity and water level, and calculated b values in different subareas.
2 GEOLOGY AND SEISMIC BACKGROUND OF XIAOWAN RESERVOIRThere are complicated geological structures and widely distributed active faults associated with magmatism and earthquakes in the vicinity of Xiaowan reservoir (Fig. 1a ). The exposed strata in the Lancang Jiang are mainly Paleozoic and Mesozoic sedimentary rocks, metamorphic rocks and magmatic rocks; the Mesozoic strata in the Heihui Jiang; the Triassic limestone in the Wawu region and there are Jurassic and Cretaceous sandstone (mudstone) in the northern Wawu region (Mao et al., 2004 ). Lancang Jiang fault (F1) is the main fault in Xiaowan reservoir area which could be divided into two sections: one section strikes northwesterly from Yongxin to Gongguoqiao in the west of the reservoir dam and the other section has almost east-west strike in the vicinity of the reservoir dam (Ren, 1993 ). The Lancang Jiang fault generally inclines to the west and the dip angle is 70° ∼ 80°. Moreover, the Lancang Jiang fault is a compressive reverse thrust fault which has 50∼100 m wide fracture zones as well as a series of small northeastern tensional faults. Fault dating results show that the intensity of fault activity and seismicity of Lancang Jiang fault have weakened since the Quaternary. In addition, there are different main faults going through or nearby Xiaowan reservoir area (Deng et al., 2002 ; internal data1) ) : Weixi-Qiaohou South fault (F2), Weixi-Qiaohou North fault (F3), Wuliangshan fault (F4), Changning fault (F5), Pupiao-Shidian fault (F6), Kejie fault (F7), Longling-Ruili fault (F8), Nujiang fault (F9), Tengchong fault (F10), Longling-Lancang fault (F11), Nantinghe fault (F12), Honghe fault (F13), Datianshan fault (F14) and Shuijing-Gongguoqiao fault (F15), which are depicted in Fig. 1.
1) Institute of Engineering Science and Technology, Beijing Zhongzhenchuanye. 2009. Reviewed seismic safety evaluation reports of engineering site in Yunnan Xiaowan Hydropower Station.
The Xiaowan Seismic Network (XSN) was established and operated since May 2005 to monitor the seismicity in the vicinity of Xiaowan reservoir. It consists of 16 short-period seismographs with 100 Hz three-component digital recorders (Wu et al., 2010 ). However, the stations are mainly distributed along Lancang Jiang and Heihui Jiang, there are few stations in the tail of reservoir area and the seismically active Weishan and Shidian area. Thus we collect P and S travel times recorded by stations (e.g. Baoshan station, Yunxian station, Tuanshan station) of Yunnan Seismic Network (YSN) to better constrain the DD relocations. After the first water filling on December 18, 2008, significantly increased earthquakes (M > 0) are recorded by XSN, and the largest earthquake occurred on September 15, 2012 in the northern reservoir area is an M3.9 earthquake. The statistics of earthquake frequency (Fig. 1c ) and M-t relation (Fig. 1d ) according to the earthquake catalog recorded by YSN from 1965 indicate that the earthquake frequency had increased since the first water filling and reached the peak level in 2010-2012 in the vicinity of Xiaowan reservoir (24.5°N-25.5°N, 99.0°E-100.5°E). 36836 M > 0 and 12481 M ≥ 1.0 earthquakes are recorded by the XSN and YSN from May 2005 to December 2014, the largest recorded earthquake is an M4.9 earthquake occurred on September 11, 2012 in Weishan outside of the reservoir area (Fig. 1b ). The distribution of epicenters shows that the earthquakes mainly occurred in Shidian and Weishan area outside of the reservoir area, as well as along Lancang Jiang and Heihui Jiang valley inside of the reservoir area. The number of earthquakes occurred within the reservoir area approximately increased 2∼4 times after the first filling (Table 1 ).
|
|
Table 1 Statistics of seismicity within Xiaowan reservoir before and after filling |

Owing to the 1-D velocity model used in the absolute location method, it could result in considerable errors in Xiaowan reservoir area. The double-difference (DD) method proposed by Waldhauser and Ellsworth (2000) is a multi-events relative earthquake location method, which can effectively eliminate the errors caused by velocity model deviation from nearby two events with similar travel paths to a common station. Moreover, the CC method can sufficiently improve the accuracy of the differential travel times of two earthquakes having close spatial distance and similar seismic mechanisms, the CC calculated differential travel times could achieve subsample precision (Schaff and Richards, 2004 ; Huang, 2008 ).
In order to ensure good signal energy in the correlation window and enhance the robustness of the CC measurement, a bandpass filter between 1 and 10 Hz is applied on the waveforms before performing the CC analysis. P- and S-phase CC differential times are calculated from recorded waveforms of 12165 earthquakes (M ≥ 1.0). The length of P-phase time window is 1.5 s (0.5 s and 1.0 s before and after the onset of P-phase, respectively) ; S-phase time window is 2.5 s (0.5 s and 2.0 s before and after the onset of S-phase, respectively). We eventually obtained 272162 P-phase and 155722 S-phase differential times of CC≥ 0.8 from the events recorded by more than or equal to 3 common stations, which were used in the DD location to get robust inversion results. Fig. 2 shows an example of waveform winch CC≥0.8 between the template event (star) and spatial close events (circles) recorded by Yongxin station (YXT).

|
Fig. 2 An example of cross-correlation analysis of waveforms recorded at station YXT (a) Distribution of events and station YXT;(b) Waveforms of Z component with CC≥ 0.8;(c) All waveforms (light gray) and stacked waveform (black), the time window of cross-correlation analysis is marked by red. |
12481 earthquakes (M ≥ 1.0) occurred in the vicinity of Xiaowan reservoir area (24.5°N-25.5°N, 99.0°E- 100.5°E) from June 2005 to December 2014 are relocated using the catalog and CC P-(S-phase) differential times. The DD program we used is hypoDD2.1b released by Waldhauser in 2013. The main changes and advantages of hypoDD2.1b are:(1) taking account of station elevation for travel time prediction;(2) accepting variable vP/vS ratios in layered velocity models;(3) allowing different specific velocity models beneath specific stations;(4) accepting 3D velocity models using the simul2000 ray tracer (Thurber and Eberhart-Phillips, 1999 ). Considering the strong crustal velocity heterogeneity in the vicinity of Xiaowan reservoir area, we take account of station elevation and employ CRUST1.0 velocity model (Laske et al., 2013 ) in DD location to eliminate the location errors.
Before the DD location, we remove the obvious incorrect P- and S-phase travel times according to the relation between epicentral distances and synthetic travel-times. 432079 P-phase, 2585 87 S-phase catalog differential travel times and 272162 P-phase and 155722 S-phase CC≥ 0.8 differential times are employed in the DD location. The DD method accepts both catalog and CC differential travel time data, while the DD inversion may be instable when an event pair has distinct different catalog and CC differential travel times to the common station. Therefore, we preserve the CC differential travel times and remove the corresponding catalog differential travel times to obtain stable and correct inversion results. We eventually employ 416476 P-phase and 252317 S-phase catalog differential travel times in the DD inversion.
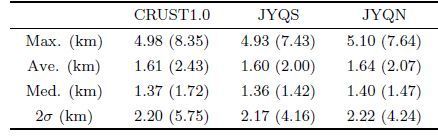
During the preprocessing of travel times in DD location, the ph2dt program searches catalog P- and Sphase data for event pairs with travel time information at common stations and subsample the travel times to optimize the quality of the phase pairs and the connectivity between the events (Waldhauser, 2000 ). The event pairs with more than 8 phase pairs are defined as “strong” neighbors, only “strong” neighbors are considered in the DD location. There are quite a number of earthquakes occurred in the margin of Xiaowan reservoir area or scattered in the region that cannot be linked as “strong” neighbors, thus these earthquakes may be discarded in the DD inversion (about 1900 earthquakes are discarded and 10580 earthquakes are preserved in the preprocessing of travel times). Differential times are removed by the dynamically weighting scheme (1.0 for P-phase and 0.5 for S-phase) that revisits the quality and link strength of the differential travel times during the 15 LSQR iterative location processes. We finally obtain DD locations of 8869 earthquakes, about 84% of all the relocated earthquakes. The average RMS of catalog data (RMSCT) reduced from 0.329 s before the DD location to 0.055 s after the DD location; and the average RMS of CC data (RMSCC) reduced from 0.181 s before the DD location to 0.044 s after the DD location. The hypocenters (Fig. 2a and Fig. 3 ) are distinctly clustered after the DD location and 90% of the earthquakes are shallower than 15 km. Most of the earthquakes occurred along the Lancang Jiang and Qiaoxi-Weihou fault zones inside of the reservoir area, meanwhile most of the earthquakes with focal depth more than 15 km are relocated in Shidian and Weishan area outside of Xiaowan reservoir. After the DD location, there are plenty of small earthquakes with focal depth less than 1 km distributed in the vicinity of the reservoir area (Fig. 3 ). Considering the inaccuracy in the shallow layers of CRUST1.0 velocity model, we additionally choose the other two velocity models (explosion point at south of Jingyunqiao and north of Jingyunqiao, respectively. Fig. 4 ) obtained by Dianxi 86-87 deep seismic sounding (DSS) data and we relocate the same earthquakes using the same control parameters. We obtain the similar hypocentral distribution of relocated earthquakes; there are earthquakes with focal depth about 1 km and earthquakes with focal depth more than 20 km, which means there may be certainly some relatively shallow (∼1 km) and deep (>20 km) earthquakes occurred in the vicinity of Xiaowan reservoir area. Locations of 8117 earthquakes are calculated by the three velocity models and the maximum value (Max.), average value (Ave.), median value (Med.) and 2 times of standard deviation (2σ) shift of DD location in horizontal and vertical directions are shown in Table 2. The statistical results indicated that the location calculated in three velocity models are generally similar and the DD method can effectively eliminate the location arising from bias of velocity models.

|
Fig. 3 Comparison of hypocenters before and after DD locating (a) Initial locations from XSN. Blue dots are earthquakes with focal depths larger than 15 km;(b) DD locations with waveform cross-correlation data. |

|
Fig. 4 Three different 1-D velocity models employed in DD location |
|
|
Table 2 Statistics of shift of DD location in horizontal (vertical) in three velocity models |
The location error is an important indicator in estimating the performance of DD location. However, the DD errors reported by LSQR are grossly underestimated and need to be assessed independently (Waldhauser and Ellsworth, 2000 ). We estimate the uncertainty of DD location referring to Hardebeck's method (2013) . We choose a small cluster of earthquakes as synthetic earthquakes from the DD catalog to estimate the earthquake location uncertainty. The “true” locations of the synthetic earthquakes are the same as the corresponding locations in the DD catalog. Each synthetic event is “recorded” at the same stations as the corresponding real event in the earthquake bulletin, and travel times are calculated using a known “true” 1-D velocity model. The DD inversions are performed with a disturbance of initial “true” locations (according to the previously calculated average 2σ of DD location shift, we assign random ±1 km and ±2 km in horizontal and vertical directions, respectively), random pick errors and a ±5% random velocity perturbation of the “true” velocity model. The mislocation is defined as the vector difference between the DD location and the “true” location of the synthetic event. We relocated 400 times of the synthetic catalog, each with different random errors in the travel times and velocity models, and about 400 mislocations are calculated for each synthetic event. The 95% confidence ellipse of DD mislocations of earthquakes occurred in the tail of reservoir area is determined individually from the distribution of ∼400 mislocations of the recovered locations (Fig. 5 ). The statistical results indicated the largest axis of 95% confidence ellipse is generally less than 2 km; and the 2σ of horizontal and vertical location error is 0.9 km and 1.7 km, respectively. The epicentral error is less than 1.0 km and depth error is less than 2.5 km according to our estimation of location uncertainty.

|
Fig. 5 An example of DD location uncertainty determined from “synthetic” events analysis (a) Distribution of DD epicenters and 95% confidence ellipses of DD location errors;(b) Histogram of horizontal DD location errors;(c) Histogram of vertical DD location errors. |
The DD location results show that the earthquakes are mainly clustered in Lancang Jiang and Heihui Jiang inside of the reservoir area, and Shidian area and Weishan area outside of the reservoir. The reservoir area is divided into 8 subareas to better analyze seismic activities (Fig. 3b ). Considering the topography of Xiaowan reservoir area, we remove the central elevation and obtain the relative water level in subareas A-F inside of reservoir area (except the subarea G and H outside of the reservoir area). The earthquake frequency (M ≥ 1.0), relation between magnitude and water level with time of subarea A-H shown in Fig. 6 indicate that the earthquake frequency in Heihui Jiang (subarea A) and Lancang Jiang (subarea B and C) was relatively lower before the first filling, and it began to increase when the reservoir backwater reached these subareas and the seismicity had rapid response to the water level in these subareas. Subarea D and F show no significant changes in seismicity before and after water filling, and in subarea E the frequency of earthquakes even reduced after water filling. Although there was a rapid increase of seismicity in subarea G and H outside of the reservoir area, no obvious relation between the seismicity and water level was found in subarea G and H.

|
Fig. 6 Variation of earthquake frequency (N) and magnitude with ML ≥ 1.0 and water level with time in 8 subareas shown in Fig. 3b in Xiaowan reservoir area |
Further observation of the relation between earthquake magnitude (M ≥ 1.0) and time (Fig. 6, black lines) in 8 subareas shows that seismicity increased rapidly after the backwater reached subarea A, which was especially evident in the first three water filling cycles (2011-2013), and the largest earthquake is M3.9 occurred on September 15, 2012. However, the magnitude range in subarea A is generally stable before and after water filling (M ≤ 4.0, Fig. 1d ). The seismicity of subarea B and C also increased after the filling, which increased evidently in 2010-2013 in subarea B and in 2013 when the water reached the peak level in subarea C. The magnitude range in subarea B and C is also stable and the largest earthquake is M3.3 occurred in subarea B on November 16, 2012 and M3.5 occurred in subarea C on February 1, 2013. There are relatively fewer earthquakes which have no obvious relation with the water level in subarea D, E and F. The largest earthquake occurred in subarea G is the M4.5 earthquake (August, 2007 ), which occurred before first water filling and there is low seismicity following the M4.5 earthquake sequence during the filling cycles. In subarea H, there are two seismic sequences after the M4.8 earthquake occurred on June 1, 2010 and M4.9 earthquake occurred on September 11, 2010. Meanwhile, there are also similar seismic sequences before water filling and the epicentral distances are more than 50 km, which indicates that the seismicity has little relation to the water impoundment in subarea G and H. Comprehensive analysis suggests that the earthquakes occurred in subarea G and H are likely to be natural tectonic earthquakes rather than RTEs.
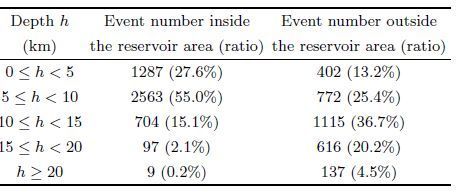
4.2 Focal Depth of DD LocationThe focal depth is a crucial reference index for identifying the reservoir-triggered seismicity (RTS). The DD location results show that earthquakes occurred inside of Xiaowan reservoir are generally shallower than 10 km (82.6%, Table 3 ) and earthquakes occurred outside of Xiaowan reservoir are relatively deeper, there are a number of earthquakes with focal depth more than 15 km occurring in Weishan (subarea G) and Shidian (subarea H) area (Fig. 3 and Table 3 ). We also calculate the average depths of earthquakes occurred in subarea A-H, which are 7.2 km, 6.1 km, 8.7 km, 7.2 km, 5.2 km, 6.9 km, 12.7 km, 10.8 km, respectively; and the ratio of earthquakes with focal depth less than 10 km is 79%, 98%, 59%, 79%, 97%, 81%, 30% and 43%, respectively. The DSS results (Hu et al., 1986 ; Lin et al., 1993 ; Bai et al., 2003 ; Zhang et al., 2006 ; Yang et al., 2014 ) indicate relatively thick crust and the upper crustal thickness is more than 15 km in northwestern Yunnan area. Usually, the seismogenic layers are relatively deep in thick crust area. The statistical results of 31282 M ≥ 2.0 earthquakes occurred from January 1970 to May 2005 in Chinese mainland (Zhang et al., 2002 ) show that the focal depths are relatively deep in west China (west of 107°E), about 90% of the earthquakes occurred in 5∼34 km depth, the peak depth range is 10∼24 km and the average depth range is 18±8 km. Nevertheless, Yang et al.(2004) applied the DD location algorithm to the relocation of 10057 earthquakes occurred in centralwestern China (21°N-36°N, 98°E-111°E) from 1992 to 1999. The average focal depth of 6496 relocated tectonic earthquakes is ∼11 km, the ratio of earthquakes with focal depth in the range of 0∼15 km (0∼20 km) is 77%(91%). In addition, Yang et al.(2004) relocated 6459 earthquakes occurred in central-western China from 1992 to 1999 using 3D velocity model. The relocated locations show that the ratio of earthquakes with focal depth in the range of 0∼10 km (0∼15 km, 0∼20 km) is 52%(71%, 82%). In our DD location results, the ratio of earthquakes occurred outside of the reservoir area (subarea G and H) with focal depth in the range 0∼15 km is approximate 75%(Table 3 ), which is consistent with the results of Yang et al.(2005) . Thus we can affirm that the earthquakes occurred in subarea G and H are tectonic earthquakes as well as there are evident RTS in the reservoir area, especially in subarea A, B and C.
|
|
Table 3 Statistics of relocated focal depths inside and outside of the reservoir area |
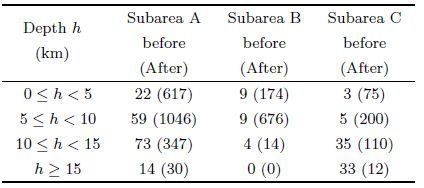
According to the relation between focal depths and time (Fig. 7 ) of earthquakes occurred from 2005 to 2014, we find that there are also some tectonic earthquakes irrelevant to the reservoir water before the impoundment, as well as the range of focal depths didn't change obviously in subarea A and B before and after water filling. Nevertheless, according to our statistics of relocated focal depths and frequency of earthquakes, there are significant increased shallow seismicity in subarea A, B and C after the first water filling. The annual number of M ≥ 1.0 earthquakes with focal depth less than 10 km increased by 20, 45 and 35 times in subarea A, B and C, respectively (Table 4 ). Meanwhile, there is no considerable increase of earthquakes with focal depth more than 10 km in these subareas. The seismic activities in subarea C are quite different from subarea A and B: there are few shallow earthquakes with focal depth less 10 km occurring before the first filling, and plenty of shallow earthquakes occurred after the backwater reached subarea C in 2010. After the first water filling, the ratio of earthquakes with focal depth in the range of 0∼5 km, 5∼10 km, 10∼15 km is 19%, 50%, 28%, there are only 3% earthquakes with focal depth more than 15 km. Evident differences in focal depth of earthquakes occurred before and after water filling clearly reveal that the shallow crustal stress perturbation and seismicity are caused by water permeation in subarea C. However, it need more further researches why there are even fewer earthquakes with focal depth more than 15 km occurred in this area after water filling. In addition, the seismicity increased obviously when the water level increased rapidly from 1218 m in the first two filling cycles (2010-07-2012-06) to 1240 m in the third filling cycle (2012-07-2013-06) in subarea A, B and C.

|
Fig. 7 Distribution of focal depth and water level from 2005-2014 in subarea A, B and C (A), (B) and (C) correspond to subarea A, B and C, respectively. |
|
|
Table 4 Statistics of relocated focal depths in subarea A, B and C before and after water filling |
Further inspection on the DD locations of earthquakes occurred in subarea A shows that the hypocenters seem to “migrate” gradually downward accompanying the water permeation (Fig. 8 ). The ratio of earthquakes with focal depth more than 10 km in the first three filling cycles (2010-07-2013-06) is 8.2%, 17.8% and 26.4%. In addition, there are corresponding relations between the focal depths and water level in each filling cycle: the number of earthquakes with focal depth in the range 0∼15 km increased during the water level rising period from July to September each year; the number of earthquakes with relatively deep focal depth (10∼15 km) is the largest during the peak period of water level from October to December each year; and the number of earthquakes with focal depth in the range 0∼5 km reduced during the water level falling period from January to June each year. The distribution of relocated earthquakes in subarea A in the most active seismic period of the first filling (2010-08-2011-03) is shown in Fig. 9. We can find that the earthquakes mainly occurred in the vicinity of Heihui Jiang valley and Weixi-Qiaohou South fault area at the beginning of the backwater reaching subarea A; and then the earthquakes occurred gradually away from Heihui Jiang valley and “migrated” along Weixi-Qiaohou South fault when the water level increased. The distribution of focal depths along profile A1-A2 indicates that the Weixi-Qiaohou South fault becomes deeper from southeast to northwest in subarea A. Thus the water could permeate downward along Weixi-Qiaohou South fault from southeast to northwest. According to the distribution of focal depths along profile A3-A4, the fault declines to the northeast and the dip angle is approximate 60°, which is generally consistent with the geological survey results. We can also observe possible hypocentral “migration” in subarea A in the second and third filling cycle, but the “migration” is less evident which could be owing to less seismicity (in the second filling cycle) and water saturation after the three-year permeation (in the third filling cycle).

|
Fig. 8 Distribution of focal depths in subarea A from July 2010 to June 2013 |

|
Fig. 9 Distribution of epicenters and focal depths of earthquakes in subarea A from August 2010 to March 2011 (a) Distribution of epicenters;(b) Distribution of focal depths along profile A1-A2;(c) Distribution of focal depths along profile A3-A4. |
Usually, the b value in the Gutenberg-Richter's formula, logN=a-bM, is an important parameter in RTS analysis, which is relatively higher than b value of tectonic earthquakes occurred in the same area. The inverse correlation between stress and b (the low b value represents high regional stress) is consistent with observation of laboratory rock specimens (Schorlemmer et al., 2005 ).
We calculate the b values of subarea A, B, C, G and H using M ≥ 1.0 earthquake catalog of YSN and XSN and the least square method (Fig. 10a ). The b values and fitting errors of subarea A, B and C are 1.208±0.098, 1.398±0.122 and 1.253±0.081; and the b values of subarea G and H outside of the reservoir are relatively lower: 0.904±0.070 and 0.998±0.067, which is consistent with the results of Chen et al.(2003) using the global seismic moment tensor data and earthquake data of China Seismic Networks (1988-2000) ; as well as Li et al.(2010) using seismic catalog of Yunnan area (1970-2009). The relatively lower b values in subarea G and H further confirm tectonic seismicity in these areas.

|
Fig. 10 b values of A, B, C, G and H subarea around Xiaowan reservoir calculated using catalogue from the XSN and YSN (a) b-value;(b) b-value before the filling of Xiaowan reservoir;(c) b-value after the filling of Xiaowan reservoir. |
Moreover, we calculate the b values of earthquakes occurred before (after) water filling in the 5 subareas (A, B, C, G and H), they are 1.114±0.091(1.214±0.101), 1.044±0.090(1.408±0.119), 1.171±0.075(1.273±0.101), 0.884±0.068(0.987±0.101) and 1.037±0.074(0.889±0.066). The b values of subarea G and H change little before and after water filling, which are in the range of b values of tectonic earthquakes in the vicinity area. However, the b values of subarea A, B and C inside of the reservoir area increase after water filling, especially in subarea B. It is most likely associated with the increase of small RTS because of the coupling of pore pressure action with the fluid lubricating and weakening action under the loading.
5 DISCUSSION AND CONCLUSIONSome researchers have suggested that the reservoir impoundment process is an important factor of RTS, whereas the fact that there are few middle to large earthquakes occurred in most reservoir areas in the world indicates that the water is not the decisive factor of RTS. It is possible to trigger the earthquakes when the water body combined other proper conditions (e.g. geological structures, hydrogeology, lithology, stress; Ding, 1989 ; Ren, 1993 ). The loading and permeation of reservoir water mainly produce three kinds of effects: the elastic effect, variation of pore pressure and fault weakening on the base rock and the fault. The water loading leads to the increase of normal stress and shear stress on the fault plane, the increased normal stress makes the deep fault strengthened, while it depends on the fault strike and the direction of the regional stress field (Chen et al., 2009 ). Beck (1976) found that the depth of the maximum shear stress generated by the water loading is as shallow as 1 km. However, the pore pressure in the shallow part is increased first by the water loading and permeation, and then it is increased to the deeper part changing the rock strength or the frictional resistance of the fault (Chen et al., 2009 ) and eventually triggering earthquakes. This is likely to be the main reason for the increasing of seismicity in 0∼5 km after the water filling in subarea A, B and C.
The rock properties are also important factors of RTS. The lithological statistics in 120 reservoir areas in the world (Yang et al., 1996 ) demonstrate that the probability of RTS occurrence in karstic area is greater than in other rock areas. Hu et al.(1995) suggested that the karst can provide a hydraulic connection to change the saturation and pressure and also weak planes for dislocation to trigger seismicity. The statistical results of 150 cases of RTS worldwide and 532 cases of aseismic reservoirs show that the probability of RTS occurrence is 67.1% in karstic areas, 37.7% in granitic areas and 10.1% in clastic rock areas. In subarea A, the dextral strike slip and extensional Weixi-Qiaohou North fault goes through directly the reservoir, the RTS are mostly distributed in Heihui Jiang and Weixi-Qiaohou North fault where the main outcrops are the Jurassic and Cretaceous mudstone and sandstone. The RTS triggered by the water loading at the early stage of water filling is shallow, but relatively deep RTS and “migration” of hypocenters indicate that the permeation and fault activity may be the main controlling factors of the RTS in this area. The Datianshan fault (F14) goes through subarea B, while there is a large area of limestone exposed on both sides of the Lancang Jiang and the focal depths of earthquakes occurred in this area are generally less than 10 km. Thus we take the karst effect, permeation and fault activity as the main controlling factors of RTS in subarea B. There are two faults crossing subarea C: Lancang Jiang fault (F1) and Kejie fault (F7) and the lithology are mainly carbonate rocks of Triassic, with dolomite, limestone and clastic rock (Li, 2011 ). The focal depths of earthquakes occurred in this area are deeper than that of subarea B, which means the controlling factors in subarea C may be similar to in subarea A. The formation lithology of subarea D is similar to subarea A, where mainly the Jurassic and Cretaceous mudstone and sandstone are outcropped. Subarea E is located nearby the dam of Xiaowan reservoir, and the lithology is mainly metamorphic sandstone and slate and gneiss. The Jurassic and Cretaceous mudstone, sandstone are outcropped in the left bank of Lancang Jiang and metamorphic rocks, migmatites and gneisses of unclear age are outcropped in the right bank of Lancang Jiang in subarea F (Ren, 1993 ; Mao et al., 2004 ). Nevertheless, there are different faults going through subarea D, E, and F, and the water level in these areas is similar to those in subarea A, B, and C, but there are few RTS activities in subarea D, E and F after the impoundment. We cannot give a precise explanation at present, and it needs further studies whether or not related to the structure of the deep medium.
In addition, the duration of the earthquake activity is different in subarea A, B and C. The duration of seismic activity in subarea B is longer comparing with subarea A and C, and seismic activity in subarea A and C attenuated faster than that in subarea B, which may be related to the difference of deep medium structures in these regions. According to the characteristics of seismic activity in these areas, there are most likely both RTS and tectonic earthquakes occurring in the vicinity of Xiaowan reservoir as a result of water storage and fault activity. The focal depth of RTS may be deeper than 10 km due to the existence of active faults, which is beyond the previous understanding of RTS. However, it is still a difficult problem to distinguish the RTS and the normal tectonic seismic activities.
According to the DD relocation results of earthquakes occurred in the vicinity of Xiaowan reservoir area and the discussion on the seismic activity and the reservoir water level, we obtain the following conclusions:
(1) The relocated earthquakes are clustered in the vicinity of Xiaowan reservoir area and the focal depths of earthquakes occurred inside and outside of the reservoir are obviously different.
(2) After the reservoir water storage, the seismic activity in the reservoir area increased obviously, and there are obvious RTEs which could be classified into rapid response RTS. The largest earthquakes occurred in 2∼3 filling cycles after the peak level backwater reached these areas, which are consistent with the decay features of pore pressure diffusion (Liu et al., 2011 ). The seismic activities irrelevant to water level variation before and after the water filling, together with the relatively lower b values indicate that the earthquakes occurred outside of Xiaowan reservoir area are likely to be normal tectonic seismic activities.
(3) In subarea A, there are the most obvious seismic activities responding to the loading and permeation of reservoir water. As well as the hypocentral “migration” along Heihui Jiang and Weixi-Qiaohou North fault suggests the possible water permeation process in subarea A.
(4) The seismic activity characteristics in Xiaowan reservoir area are complex: there are both normal tectonic earthquake clusters irrelevant to water filling and RTS clusters mixed with tectonic earthquake clusters. The water loading, permeation and fault activity are considered as the main controlling factors of RTS in this region; and there is no obvious RTS occurred in some subareas (subarea D, E and F) inside of reservoir area, it needs more observation and further studies whether it is related to the deep structures and the medium differences beneath these subareas.
In this study, we obtained high resolution locations of earthquakes occurred in the vicinity of Xiaowan reservoir, the relation between the seismicity and water level, and the b values in each subarea. We further gave the preliminary explanation of seismogenic mechanisms in subarea A, B, C, G, and H. The research results could provide significant references for studies of the mechanisms and characteristics of RTS in other reservoir areas, especially in reservoir areas located in tectonic active area. However, we only made a preliminary discussion according to the DD relocation, the relation between the seismicity and water level, geological structures and lithological conditions in this paper. It needs more precise studies on the water permeation process and detail deep structures beneath Xiaowan reservoir area to obtain more precise seismogenic mechanisms in each subarea.
ACKNOWLEDGMENTSThis work was supported by the National Natural Science Foundation of China (41174051, 41130316, 41490612).
| [] | Bai Z M, Wang C Y. 2003. Tomographic investigation of the upper crustal structure and seismotectonic environments in Yunnan province. Acta Seismologica Sinica (in Chinese) , 25 (2) : 117-127. |
| [] | Balfour N J, Cassidy J F, Dosso S E. 2012. Identifying active structures using double-difference earthquake relocations in southwest British Columbia and the San Juan Islands, Washington. Bull. Seismol. Soc. Am. , 102 (2) : 639-649. DOI:10.1785/0120110056 |
| [] | Beck J L. 1976. Weight-induced stresses and the recent seismicity at Lake Oroville, California. Bull. Seismol. Soc. Am. , 66 (4) : 1121-1131. |
| [] | Chen H L, Zhao C P, Xiu J G, et al. 2009. Study on precise relocation of Longtan reservoir earthquakes and its seismic activity. Chinese J. Geophys. (in Chinese) , 52 (8) : 2035-2043. DOI:10.3969/j.issn.0001-5733.2009.08.011 |
| [] | Chen P S, Bai T X, Li B K. 2003. b-value and earthquake occurrence period. Chinese J. Geophys. (in Chinese) , 46 (4) : 510-519. |
| [] | Chen Y. 2009. Did the reservoir impoundment trigger the Wenchuan earthquake?. Science China Earth Sciences , 52 (4) : 431-433. DOI:10.1007/s11430-009-0067-2 |
| [] | Cheng H H, Zhang H, Zhu B J, et al. 2012. Finite element investigation of the poroelastic effect on the Xinfengjiang Reservoir-Triggered earthquake. Science China Earth Sciences , 55 (12) : 1942-1952. DOI:10.1007/s11430-012-4470-8 |
| [] | Deng Q D, Zhang P Z, Ran Y K, et al. 2003. Basic characteristics of active tectonics of China. Science in China Series D:Earth Sciences , 46 (4) : 356-372. |
| [] | Diehl T, Waldhauser F, Cochran J R, et al. 2013. Back-arc extension in the Andaman Sea:Tectonic and magmatic processes imaged by high-precision teleseismic double-difference earthquake relocation. J. Geophys. Res. , 118 (5) : 2206-2224. DOI:10.1002/jgrb.50192 |
| [] | Ding Y Z. 1989. The Reservoir Induced Earthquake[M]. Beijing: Seismological Press . |
| [] | Do Nascimento A F, Cowie P A, Lunn R J, et al. 2004. Spatio-temporal evolution of induced seismicity at Açu reservoir, NE Brazil. Geophysical Journal International , 158 (3) : 1041-1052. DOI:10.1111/j.1365-246X.2004.02351.x |
| [] | Fang L H, Wu J P, Liu J, et al. 2015a. Preliminary Report on the 22 November 2014MW6. 1/MS6.3 Kangding Earthquake, Western Sichuan, China. Seismol. Res. Lett. , 86 (6) : 1603-1613. DOI:10.1785/0220150006 |
| [] | Fang L H, Wu J P, Wang W L, et al. 2015b. Aftershock observation and analysis of the 2013 MS7. 0 Lushan earthquake. Seismol. Res. Lett. , 86 (4) : 1135-1142. DOI:10.1785/0220140186 |
| [] | Gupta H K. 2002. A review of recent studies of triggered earthquakes by artificial water reservoirs with special emphasis on earthquakes in Koyna, India. Earth-Science Reviews , 58 (3-4) : 279-310. DOI:10.1016/S0012-8252(02)00063-6 |
| [] | Hardebeck J L. 2013. Geometry and Earthquake Potential of the Shoreline Fault, Central California. Bull. Seismol. Soc. Am. , 103 (1) : 447-462. DOI:10.1785/0120120175 |
| [] | Hu H X, Lu H X, Wang C Y, et al. 1986. Explosion investigation of the crustal structure in western Yunnan province. Chinese J. Geophys. (Acta Geophysica Sinica) (in Chinese) , 29 (2) : 133-144. |
| [] | Hu Y L, Chen X C. 1979. Discussion on the reservoir-induced earthquakes in China and some problems related to their origin. Seismology and Geology (in Chinese) , 1 (4) : 45-57. |
| [] | Hu Y L, Liu Z Y, Yang Q Y, et al. 1996. Induced seismicity at Wujiangdu reservoir, China:a case induced in the Karst area. Pure and Applied Geophysics , 147 (2) : 409-418. DOI:10.1007/BF00877492 |
| [] | Huang Y. 2008. Study on the application and development of the DD algorithm with cross correlation of waveform data in the earthquake location. Recent Developments in World Seismology (in Chinese) (4) : 29-34. |
| [] | Kerr R A, Stone R. 2009. A human trigger for the great quake of Sichuan?. Science , 323 (5912) : 322. DOI:10.1126/science.323.5912.322 |
| [] | Laske G, Masters G, Ma Z T, et al. 2013. Update on CRUST1. 0-A 1-degree global model of Earth's crust.//EGU General Assembly 2013. Vienna, Austria. |
| [] | Lee W H K, Raleigh C B. 1969. Fault-plane solution of the Koyna (India) earthquake. Nature , 223 (5202) : 172-173. DOI:10.1038/223172a0 |
| [] | Li L, Chen Q F, Chen Y. 2007. Relocated seismicity in Big Beijing area and its tectonic implication. Progress in Geophysics (in Chinese) , 22 (1) : 24-34. |
| [] | Li P Y. 2011. Study on bank collapse's type and mechanism in mountain reservoir-A case of Xiaowan reservoir[Master's thesis] (in Chinese). Chengdu:Chengdu University of Technology. |
| [] | Li T, Wu X P, Wang Y. 2010. Study on b-value distributions in Yunnan based on regional spatial scanning. Journal of Yunnan University (in Chinese) , 32 (6) : 670-675. |
| [] | Liao W L, Zhang L F, Yao Y S. 2009. Characteristics of seismicity in the Three Gorges reservoir area. Seismology and Geology (in Chinese) , 31 (4) : 707-714. |
| [] | Lin Z Y, Hu H X, Zhang W B, et al. 1993. Investigation of the crustal and upper mantle structure in western Yunnan province. Acta Seismologica Sinica (in Chinese) , 15 (4) : 427-440. |
| [] | Liu Y W, Xu L Q, Yang D X. 2011. Pore pressure diffusion characteristics of Longtan reservoir-induced-earthquake. Chinese J. Geophys. (in Chinese) , 54 (4) : 1028-1037. DOI:10.3969/j.issn.0001-5733.2011.04.017 |
| [] | Ma W T, Lin Y, Yuan J L, et al. 2013. Comparison and analysis on the basic features of reservoir-induced seismicity. Seismology and Geology (in Chinese) , 35 (4) : 914-929. |
| [] | Mao Y P, Wang Y L, Li C C. 2004. Seismo-geological ambiance analyses of reservoir-induced earthquake in Xiaowan area. Journal of Seismological Research (in Chinese) , 27 (4) : 339-343. |
| [] | Mekkawi M, Grasso J R, Schnegg P A. 2004. A long-lasting relaxation of seismicity at Aswan reservoir, Egypt, 1982-2001. Bull. Seismol. Soc. Am. , 94 (2) : 479-492. DOI:10.1785/0120030067 |
| [] | Qin J Z, Liu L F, Qian X D. 2009. Research on characteristics and prediction of reservoir induced seismicity. Journal of Seismological Research (in Chinese) , 32 (2) : 105-113. |
| [] | Ren J W. 1993. On the fault structure conditions of Xiaowan Reservoir in Lancang river area that inducing earthquakes. Inland Earthquake (in Chinese) , 7 (1) : 30-37. |
| [] | Schaff D P, Bokelmann G H, Ellsworth W L, et al. 2004. Optimizing correlation techniques for improved earthquake location. Bull. Seismol. Soc. Am. , 94 (2) : 705-721. DOI:10.1785/0120020238 |
| [] | Schaff D P, Richards P G. 2004. Schaff D P, Richards P G. 2004. Lg-wave cross correlation and double-difference location:Application to the 1999 Xiuyan, China, sequence. Bull. Seismol. Soc. Am. , 94 (3) : 867-879. |
| [] | Schorlemmer D, Wiemer S, Wyss M. 2005. Variations in earthquake-size distribution across different stress regimes. Nature , 437 (7058) : 539-542. DOI:10.1038/nature04094 |
| [] | Simpson D W, Leith W S, Scholz C H. 1988. Two types of reservoir-induced seismicity. Bull. Seismol. Soc. Am. , 78 (6) : 2025-2040. |
| [] | Waldhauser F, Ellsworth W L. 2000. A double-difference earthquake location algorithm:method and application to the northern Hayward fault, California. Bull. Seismol. Soc. Am. , 90 (6) : 1353-1368. DOI:10.1785/0120000006 |
| [] | Waldhauser F, Schaff D P. 2008. Large-scale relocation of two decades of Northern California seismicity using crosscorrelation and double-difference methods. J. Geophys. Res. , 113 : B08331. |
| [] | Wu C D, Fu H, Zhao X Y. 2010. Primary study on source parameters near Xiaowan Reservoir. Journal of Seismological Research (in Chinese) , 33 (1) : 50-54. |
| [] | Yang Q Y, Hu Y L, Chen X C, et al. 1996. Catalogue of reservoir induced seismic events in the world. Seismology and Geology (in Chinese) , 18 (4) : 453-461. |
| [] | Yang T, Wu J P, Fang L H, et al. 2014. 3-D crustal P-wave velocity structure in western Yunnan area and its tectonic implications. Seismology and Geology (in Chinese) , 36 (2) : 392-404. |
| [] | Yang Z X, Yu X W, Zheng Y J, et al. 2004. Earthquake relocation and three-dimensional crustal structure of P-wave velocity in central-western China. Acta Seismologica Sinica (in Chinese) , 26 (1) : 19-29. |
| [] | Yang Z X, Waldhauser F, Chen Y T, et al. 2005. Double-difference relocation of earthquakes in central-western China, 1992-1999. Journal of Seismology , 9 (2) : 241-264. DOI:10.1007/s10950-005-3988-z |
| [] | Zhang G M, Wang S Y, Li L, et al. 2002. Focal depth research of earthquakes in mainland China:implication for tectonics. Chinese Science Bulletin , 47 (12) : 969-974. |
| [] | Zhang Z, Zhao B, Zhang X, et al. 2006. Crustal structure beneath the wide-angle seismic profile between Simao and Zhongdian in Yunnan. Chinese J. Geophys. (in Chinese) , 49 (5) : 1377-1384. |
| [] | Zhou B, Xue S F, Deng Z H, et al. 2010. Relationship between the evolution of reservoir-induced seismicity in space-time and the process of reservoir water body load-unloading and water infiltration-a case study of Zipingpu reservoir. Chinese J. Geophys. (in Chinese) , 53 (11) : 2651-2670. DOI:10.3969/j.issn.0001-5733.2010.11.013 |
| [] | Zhu A L, Xu X W, Zhou Y S, et al. 2005. Relocation of small earthquakes in western Sichuan, China and its implications for active tectonics. Chinese J. Geophys. (in Chinese) , 48 (3) : 629-636. |