 2016, Vol. 59


2 Key Laboratory of Marine Mineral Resources, Ministry of Land and Resources, Guangzhou Marine Geological Survey, Guangzhou 510075, China
Gas hydrate is a new clean potential energy sources in recent years, which is widely present in marine continental slope environments and permafrost regions. Gas hydrate is an ice-like, crystalline solid formed under high pressures and low temperatures (Sloan, 1998). Bottom simulating reflector (BSR) is the direct indication of gas hydrate in the seismic profiles (Song et al., 2007), and is always identified based on these characteristic properties: opposite polarity with respect to ocean bottom, mimicking the sea-floor topography, and crosscut the existing geological horizons (Hyndman and Spence, 1992). Due to gas hydrate hardening of rock matrix, the velocity of sediments will increase, and the free gas is always under the BSR (Zhang et al., 2014). BSR is usually identified as an interface between the bottom of gas hydrate stability zone and underlay free gas zone (Singh et al., 1993 ; Holbrook et al., 1996).
The effect of gas hydrate on velocities is well known; it tends to increase both P- and S-wave velocities of the marine sediments with the increase of hydrate concentration (Wang et al., 2006 ; Niu et al., 2006 ; Zhang et al., 2011). Many velocity models have been proposed for gas hydrate-bearing sediments: weighted equation (Lee et al., 1996), cementation theory (Ecker et al., 1998), effective medium theory (EMT, Helgerud et al., 1999 ; Ecker et al., 2000), and three-phase Biot type equations (Carcione and Tinivella, 2000 ; Lee and Waite, 2008). In contrast, attenuation trends in the gas hydrate-bearing sediments are still actively debated. Based on Biot theory and three occurrence modes of gas hydrate, Zhang et al.(2004) suggested the velocities and attenuation characteristics of gas hydrate-bearing sediments. The analysis of sonic waveform from Mallik 2L-38 gas hydrate research well, Mackenzie delta, Canada shows that the presence of hydrate increases attenuation (Guerin and Goldberg, 2002). The vertical seismic profiling (VSP) data at Mallik shows significant attenuation of gas hydrate bearing sediments (Bellefleur et al., 2007). Laboratory measurements at seismic frequencies (50~500 Hz) show that attenuation increases nonlinearly with the increase of hydrate concentration (Best et al., 2013 ; Priest et al., 2006). However, VSP data from the Nankai trough exploratory well shows no significant seismic attenuation for methane-hydrate bearing sediments (Matsushima, 2006). So these research results indicate that the effect of gas hydrate on seismic attenuation seems to vary from region to region and also from experiment to experiment within the same region (Dewangan et al., 2014). Theoretically, the presence of hydrate strengthens the sediment with the increase in bulk and shear modulus; hence it is expected that the attenuation should decrease with hydrate saturation (Dewangan et al., 2014). However, the facts are persistent. Unexpectedly large attenuation in sediments with gas hydrates has recently been observed at different geographical locations, in different depositional environments and at different frequencies (Dvorkin and Uden, 2004).
Based on the effective medium theory (Helgerud et al., 1999) and BISQ model (Dvorkin and Nur, 1993), we have stimulated the velocity dispersion and attenuation of marine hydrate-bearing sediments in this paper. Due to the combination of the global Biot flow mechanism and the local squirt flow mechanism, the BISQ model can be used to analyze the velocity dispersion and attenuation in the full frequency band (Nie et al., 2010). We apply this model in Ocean drilling Program (ODP) leg 164 and Shenhu area of South China Sea (SCS) to obtain the amount of gas hydrate, and the average hydrate concentration of gas hydrate-bearing sediments is consistent with the pressure core sample (PCS) data.
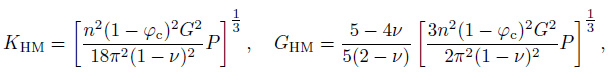
2 MODEL 2.1 Effective Medium TheoryHelgerud et al.(1999) proposed a model to predict the velocity in unconsolidated, high-porosity sediments with gas hydrates based on the effective medium theory. At critical porosity the effective bulk modulus (KHM) and shear modulus (GHM) of the dry rock frame can be calculated by the following equations:
|
(1) |
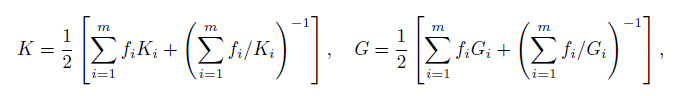
where n is the average number of contacts per grain in the sphere pack (9 in this paper); φc is the critical porosity (0.38 in this paper); P is the effective pressure, P =(ρb - ρw) gD, where ρb is the bulk density of sediment, ρw is water density, g is the gravitational acceleration, and D is depth. ν is the Poisson's ratio, ν =(3K - 2G)/(6K+2G). K and G are the matrix bulk modulus and shear modulus, respectively, and can be obtained by Hill average equation (Hill, 1952).
|
(2) |
where m is the number of mineral constituents and fi is the volumetric fraction of the ith constituent having Ki and Gi in the solid phase.
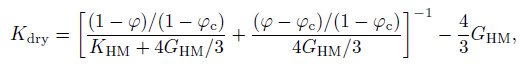
The bulk modus (Kdry) and shear modulus (Gdry) of the dry frame are calculated via the equations (Dvorkin et al., 1999):
|
(3) |

|
(4) |
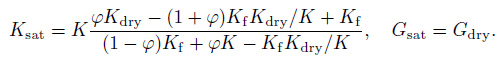
If the sediment is saturated with pore fluid of bulk modulus Kf, the shear modulus Gsat is the same as that of the dry frame. The bulk modulus Ksat is calculated from Gassmann's equation as
|
(5) |
Finally, the elastic velocities of sediment when the pore space is filled with water are calculated via the following equation:
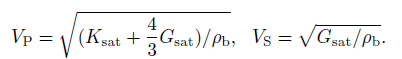
|
(6) |
Due to the combination of the global Biot flow mechanism and the local squirt flow mechanism, Dvorkin and Nur (1993) suggested a unified BISQ model. The velocity, attenuation factor and inverse quality factor of P-wave are calculated as
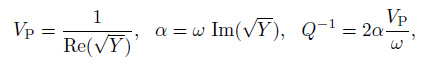
|
(7) |
where
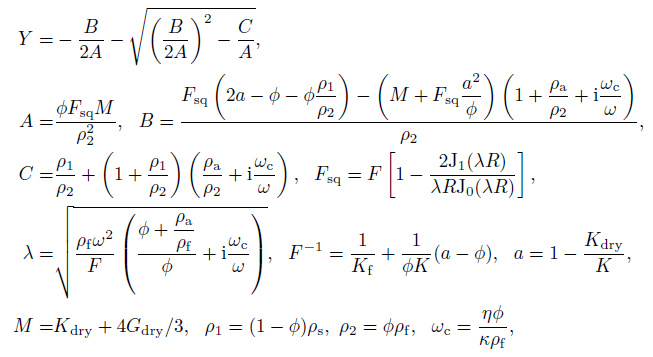
|
where Kdry and Gdry are the bulk modulus and shear modulus of the dry frame, respectively. φ is the porosity of rock; ρs and ρf are the density of solid and fluid phase, respectively. ρa is the additional coupling density; R is the characteristic squirt flow length; K is the bulk modulus of solid phase; η is the viscosity of the fluid, and κ is the permeability of the skeleton.
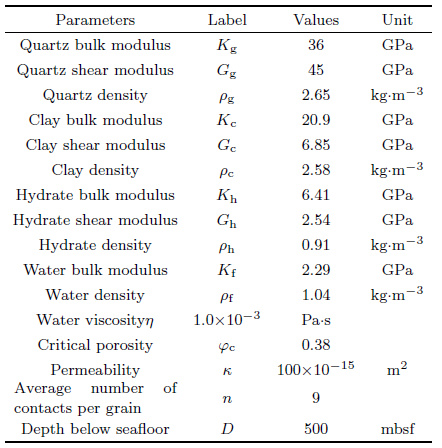
3 NUMERICAL EXAMPLESWe can obtain the bulk modulus and shear modulus of the sediments matrix and dry rock based on the effective medium theory (EMT). Moreover, we use BISQ model to replace Gassmann equation in the EMT, and research the velocity dispersion and attenuation of hydrate-bearing sediments in the full frequency band. Fig. 1 is our research method of this model. Given that gas hydrate is a part of rock frame, and the porosity of rock will decrease with the increasing amount of gas hydrate. The solid phases are quartz, clay and gas hydrate, and the fluid is water. The parameters for the numerical computation are given in Table 1.

|
Fig. 1 The research method of this model |
|
|
Table 1 The parameters in this paper |
Since gas hydrate is a part of rock frame, and the water-filled porosity of rock will decrease with the increasing amount of gas hydrate.
|
(8) |
where φis the porosity of rock; Sh is the amount of gas hydrate.
In order to study the variation of P/S-wave velocity with water-filled porosity, we select three kinds of rock porosity (20%, 40% and 60%). The amount of gas hydrate changes from 0% to 100%, and the water-filled porosity also varies at the same time. In the Fig. 2, no matter whether or not the sediments contain gas hydrate, the velocities always decrease with the increasing porosity. Moreover, when the sediments contain gas hydrate, the P/S-wave velocities always nonlinearly decrease with the increasing water-filled porosity (the decreasing amount of gas hydrate). The variation curves of P/S-wave velocities are coincident with the background line of non-gas hydrate bearing sediments in the saturated water. When the water-filled porosity is below 20%, the variation of wave velocities is obvious. However, when the water-filled porosity is more than 40%(unconsolidated phase), the variation of wave velocities is weak, and the variation of S-wave velocity is less than P-wave velocity.

|
Fig. 2 P-wave and S-wave velocity vary with water-filled porosity |
Based on the combination of the effective medium theory and BISQ model, this model can be used in the full frequency band. In the Fig. 3, the variation of P-wave velocity with frequency is nonlinear. At the low and middle frequency band (<10 kHz), the P-wave velocity will be usually unchanged, but when the frequency increases to the characteristic frequency, the P-wave velocity increases quickly. However, the P-wave velocity will vary little at the high frequency band (>10 MHz). Moreover, with the increase of gas hydrate content, the variation of P-wave velocity change with frequency shows a general upward trend, and this trend is obvious at the low and high frequency. In any frequency range, the P-wave velocities nonlinearly increase with the increase of gas hydrate content (Fig. 4), and the value of P-wave velocities will be elevated at the high frequency. The black spots in the Fig. 4 are the measured data of gas hydrate in the Shenhu area, South China Sea, and the results correspond to these data at the logging and seismic frequency. Moreover, we introduce the frequency calculation formula of the dispersion degree.

|
(9) |

|
Fig. 3 P-wave velocity varies with frequency |

|
Fig. 4 P-wave velocity varies with hydrate concentration at different frequency |
This formula represents the rate of change of Pwave velocity from low to high frequency, which is closely associated with fluid, porosity, clay content and hydrate content. The variations of dispersion degree change with the content of gas hydrate between seismic (100 Hz) and ultrasonic (10 MHz) frequency, and between logging (30 kHz) and ultrasonic (10 MHz) frequency are shown in the Fig. 5. With the increase of gas hydrate content, the dispersion degrees of different frequency separation increase nonlinearly, and it shows a general upward trend at the large frequency separation (from 100 Hz to 10 MHz). According to these former results, the content of gas hydrate can be estimated by the variations of dispersion degree.

|
Fig. 5 Dispersion degree vary with hydrate concentration |
P-wave and S-wave velocity will increase when the concentration of gas hydrate increases and the attenu ation will vary too. The analysis of velocity dispersion and attenuation for hydrate-bearing sediments (GHBS) would contribute to the estimate of gas hydrate concentration. The attenuation change with frequency and gas hydrate concentration is shown in Fig. 6. The elevated attenuation appears at the characteristic frequency (100 kHz), also the attenuation would increase with the increase of gas hydrate concentration, and the position of the peak attenuation would shift to the low frequency. Unlike the expected decrease of attenuation, the attenuation shows an increase trend in this paper; many practical instances from different areas indicate that the presence of gas hydrate would increase attenuation.

|
Fig. 6 The attenuation factor varies with frequency and hydrate concentration |
Figure 7 and 8 indicate the attenuation variation with the porosity and clay content, respectively. Assuming that gas hydrate content is 20%, the position of peak attenuation shifts to the high frequency and the value decreases weakly with the increase of rock porosity (Fig. 7). Also there are no obvious variations of peak attenuation at the 40% porosity or 50% porosity. These results indicate that the rock porosity only changes the position of peak attenuation, and scarcely the value of peak attenuation. Assuming that gas hydrate content is 20%, the position of peak attenuation and the peak value scarcely change with the increase of clay content (Fig. 8). Due to the results of Fig. 6, 7 and 8, gas hydrate concentration plays an important role in the attenuation of marine sediments.

|
Fig. 7 The attenuation factor varies with frequency and porosity (The hydrate concentration is 20%) |

|
Fig. 8 The attenuation factor varies with frequency and shale content (The hydrate concentration is 20%) |
In this study we use the sonic logging and VSP data to estimate the amount of gas hydrate from Site 995 at the Blake Ridge, where obvious BSR and gas hydrate were found (Guerin et al, 1999). Fig. 9 is the logging and VSP data of Site 995. BSR is at about 440 mbsf, and P/S-wave velocity and resistivity all increase obviously in the gas hydrate occurrence zone. The gas volume from chlorinity data and pressure core sampler (PCS) suggests that 0 to 9% of the pore space contains gas hydrate (Dickens et al., 1997). Given gas hydrate is a part of sediments frame, Helgerud et al.(1999) applied EMT in a determination of the amount of hydrate at Site 995, and all estimates point to a general background level of 2%~4% bulk hydrate with peak concentrations of 8%~9%. Guerin et al.(1999) used Archie's relation for estimating the amount of hydrate at Site 995, the results indicate that the amount of gas hydrate is within 13%, and coincide with the pressure core sampler.

|
Fig. 9 The logging and VSP data from Site 995, ODP Leg 164 |
The amount of gas hydrate estimated from sonic logging and VSP data by this paper's model is shown in Fig. 10. The calculation frequency for sonic logging and VSP data is 20 kHz and 100 Hz, respectively. According to the estimation of sonic logging data, the amount of gas hydrate fluctuates between 0% and 12%, and the average value is 7%. As the estimation from VSP data, the amount of gas hydrate fluctuates between 0% and 8%, and the average value is 5%. Because of the velocity dispersion from the different acquisition frequency, the estimation of VSP data is less than that from sonic logging data, but the trend with depth is similar. These two results coincide with the pressure core sampler (the black spots in the Fig. 10), and the research of Helgreud et al.(1999).

|
Fig. 10 The gas hydrate concentration estimated from multiple methods |
Moreover, In order to ensure the confidence of the estimated results, we use Neural network (NN) to predict the amount of gas hydrate, the input data are VP, VS, resistivity, GR and porosity. The results indicate that the amount of gas hydrate is within 12%, and coincide with the previous results from sonic logging and VSP data.
4.2 Shenhu AreaIn March and June 2007, Gas hydrate samples were firstly obtained by Guangzhou Marine Geological Survey (GMGS) in Shenhu area, South China Sea (Lu et al., 2008 ; Xu et al., 2014). The locations of three sites and 2D seismic line are shown in the Fig. 11. GH survey zone from Shenhu area is located in the nearby southeast Shenhu Ansha area in the middle of the northern continental slope, and the bathymetry is about 1200 m (Liang et al., 2013 ; Zhang et al., 2015). The estimations of gas hydrate content from Sites SH7, SH2 and SH3 are displayed in the Fig. 12. Due to the lack of VSP data, we only apply sonic logging data in calculating the amount, and the calculation frequency for sonic logging data is 20 kHz. The bathymetry of Site SH7 is about 1150 m, gas hydrates are distributed between 153 and 180 mbsf, and the amount fluctuates between 20% and 42%; gas hydrates of SH2 are distributed between 191 and 224.5 mbsf, and the amount fluctuates between 25% and 46%. Due to wellbore collapse, the sonic logging data of Site SH3 may be inaccurate. In this paper, the resistivity curve is adopted to correct sonic logging data (Gong et al., 2008). The previous sonic curve is dotted line, and the correction curve is solid line. Gas hydrates of SH3 are distributed between 190 and 201 mbsf, and the amount fluctuates between 12.5% and 25.5%. The estimated results of these three sites all coincide with the pressure core sampler.

|
Fig. 11 The location of three sites in Shenhu area, South China Sea |

|
Fig. 12 The prediction results of hydrate concentration from well SH7, SH2 and SH3 in Shenhu area, South China Sea |
In order to research the seismic attenuation of marine gas hydrate, based on the peak frequency method (Zhang and Ulrych, 2002 ; Liu and Wei, 2005), the seismic quality factor (Q) of BSR can be obtained from the 2D multi-channel pre-stack seismic in Shenhu area, SCS. The estimated effective Q-values are shown for the seismic profile in Fig. 13a and i nterpreted seismic section is shown in Fig. 13b. The effective seismic Q-values fluctuate generally between 180 and 280, and the average value is about 230. The effective Q-values of strong and continuous BSR (CDP#600-720, #900-1100) are more concentrated and low, and the average value is about 200. The Q of weak and discontinuous BSR (CDP#250-500, #720-900) is estimated to be about 250, where the amount of gas hydrate may be insufficient. These results suggest that the increasing amount of gas hydrate would cause the elevated seismic attenuation (low Q-values), and coincide with the above conclusion of this study. Moreover, based on our model, the amount of gas hydrate can be estimated by effective seismic Q-values (Fig. 14). The estimated results fluctuate mostly between 15% and 30%, and coincide with the amount of gas hydrate for nearby site SH3(12.5%~25.5%). But the estimated effective Q-values aren't real Q-values of sediments. The extraction accuracy of Q-values may be limited by the influence of seismic wavelet, geometric diffusion, thin layer tuning and inelastic scattering. So some error may be present in the estimation of has hydrate content, but the variation trend has a certain credibility.

|
Fig. 13 The variation in effective quality factor (Q) along the inline seismic profile in the Shenhu area, South China Sea;(b) The interpreted time-migrated seismic section highlighting major features such as BSR |

|
Fig. 14 The estimated effective gas hydrate saturation using the method in this paper based on the seismic Q-values |
In this paper, we use BISQ model to replace Gassmann equation in the EMT, and research the velocity dispersion and attenuation of marine gas hydrate-bearing sediments in the full frequency band, which would contribute to the estimate of gas hydrate concentration. P-wave and S-wave velocity will increase nonlinearly and the attenuation will vary when the concentrations of gas hydrate increase.
The results of numeral modeling indicate that P-wave, S-wave velocity and attenuation of gas hydratebearing sediments increase with the increasing hydrate concentration. For the same hydrate concentration, P-wave velocity increases when the frequency increases, and the variation is maximum at the characteristic frequency, also the maximum wave attenuation appears at the characteristic frequency. Moreover, the high hydrate concentration will cause the high dispersion degree. Based on the simulation experiments, for the same hydrate concentration, the variation of porosity and clay content does not play a significant role in the attenuation. The rock porosity only change the characteristic frequency, but clay content can change nothing. So the results suggest that gas hydrate concentration plays an important role in the attenuation.
The results of Ocean drilling Program (ODP) leg 164 and Shenhu area indicate that the estimated results of gas hydrate amount all coincide with the pressure core sampler. Moreover, the effective seismic quality factors (Q) of the BSR are estimated from the inline prestack seismic gathers. The results indicate that the increasing saturation of gas hydrate would cause the elevated seismic attenuation, and suggest that the saturation of gas hydrate estimated by the EMT and BISQ equation fluctuates between 15% and 30%. So, the combination of velocity and attenuation would contribute to the estimation of gas hydrate concentration.
ACKNOWLEDGMENTSThanks all researchers of ODP leg164 for the logging and VSP data.
| [] | Bellefleur G, Riedel M, Brent T, et al. 2007. Implication of seismic attenuation for gas hydrate resource characterization, Mallik, Mackenzie Delta, Canada. J. Geophys. Res. , 112 : B10311. DOI:10.1029/2007JB004976 |
| [] | Best A I, Priest J A, Clayton C R I, et al. 2013. The effect of methane hydrate morphology and water saturation on seismic wave attenuation in sand under shallow sub-seafloor conditions. Earth and Planetary Science Letters , 368 : 78-87. DOI:10.1016/j.epsl.2013.02.033 |
| [] | Carcione J M, Tinivella U. 2000. Bottom-simulating reflectors:Seismic velocities and AVO effects. Geophysics , 65 (1) : 54-67. DOI:10.1190/1.1444725 |
| [] | Dewangan P, Mandal R, Jaiswal P, et al. 2014. Estimation of seismic attenuation of gas hydrate bearing sediments from multi-channel seismic data:A case study from Krishna-Godavari offshore basin. Marine and Petroleum Geology , 58 : 356-367. DOI:10.1016/j.marpetgeo.2014.05.015 |
| [] | Dickens G D, Paull C K, Wallace P. 1997. Direct measurement of in situ methane quantities in a large gas-hydrate reservoir. Nature , 385 (6615) : 426-428. DOI:10.1038/385426a0 |
| [] | Dvorkin J, Nur A. 1993. Dynamic poroelasticity:A unified model with the squirt and the Biot mechanisms. Geophysics , 58 (4) : 524-533. DOI:10.1190/1.1443435 |
| [] | Dvorkin J, Prasad M, Sakai A, et al. 1999. Elasticity of marine sediments:rock physics modeling. Geophys. Res. Lett. , 26 (12) : 1781-1784. DOI:10.1029/1999GL900332 |
| [] | Dvorkin J, Uden R. 2004. Seismic wave attenuation in a methane hydrate reservoir. The Leading Edge , 23 (8) : 730-732. DOI:10.1190/1.1786892 |
| [] | Ecker C, Dvorkin J, Nur A M. 1998. Sediments with gas hydrates:Internal structure from seismic AVO. Geophysics , 63 (5) : 1659-1669. DOI:10.1190/1.1444462 |
| [] | Ecker C, Dvorkin J, Nur A M. 2000. Estimating the amount of gas hydrate and free gas from marine seismic data. Geophysics , 65 (2) : 565-573. DOI:10.1190/1.1444752 |
| [] | Gong H L, Su M J, Wang Z Q, et al. 2008. Analysis of environmental impact factors of well logging data and its application. Computing Techniques for Geophysical and Geochemical Exploration (in Chinese) , 30 (1) : 43-47. |
| [] | Guerin G, Goldberg D, Meltser A. 1999. Characterization of in situ elastic properties of gas hydrate-bearing sediments on the Blake Ridge. J. Geophys. Res. , 104 (B8) : 17781-17795. DOI:10.1029/1999JB900127 |
| [] | Guerin G, Goldberg D. 2002. Sonic waveform attenuation in gas hydrate-bearing sediments from the Mallik 2L-38 research well, Mackenzie Delta, Canada. Journal of Geophysical Research , 107 (B5) : EPM 1-1-EPM 1-11. |
| [] | Helgerud M B, Dvorkin J, Nur A, et al. 1999. Elastic-wave velocity in marine sediments with gas hydrates:Effective medium modeling. Geophysical Research Letters , 26 (13) : 2021-2024. DOI:10.1029/1999GL900421 |
| [] | Hill R. 1952. The elastic behavior of a crystalline aggregate. Proceedings of the Physical Society , 65 (5) : 349-354. DOI:10.1088/0370-1298/65/5/307 |
| [] | Holbrook W S, Hoskins H, Wood W T, et al. 1996. Methane Hydrate and free gas on the Blake Ridge from vertical seismic profiling. Science , 273 (5283) : 1840-1843. DOI:10.1126/science.273.5283.1840 |
| [] | Hyndman R D, Spence G D. 1992. A seismic study of methane hydrate marine bottom simulating reflectors. J. Geophys. Res. , 97 (B5) : 6683-6698. DOI:10.1029/92JB00234 |
| [] | Lee M W, Hutchinson D R, Collet T S, et al. 1996. Seismic velocities for hydrate-bearing sediments using weighted equation. J. Geophys. Res. , 101 (B9) : 20347-20358. DOI:10.1029/96JB01886 |
| [] | Lee M W, Waite W F. 2008. Estimating pore-space gas hydrate saturations from well log acoustic data. Geochemistry, Geophysics, Geosystems , 9 (7) : Q07008. |
| [] | Liang J, Wang M J, Lu J A, et al. 2013. Characteristics of sonic and seismic velocities of gas hydrate bearing sediments in the Shenhu area, northern South China Sea. Natural Gas Industry (in Chinese) , 33 (7) : 29-35. |
| [] | Liu Y, Wei X C. 2005. Interval Q inversion from CMP gathers:part I-absorption equation.//75th Ann. Internat. Mtg., Soc. Expl. Geophys., Expanded Abstracts, 1717-1720. |
| [] | Lu J A, Yang S X, Wu N Y, et al. 2008. Well logging evaluation of gas hydrates in Shenhu area, South China Sea. Geoscience (in Chinese) , 22 (3) : 447-451. |
| [] | Matsushima J. 2006. Seismic wave attenuation in methane hydrate-bearing sediments:Vertical seismic profiling data from the Nankai Trough exploratory well, offshore Tokai, central Japan. J. Geophys. Res. , 111 (B10) : B10101. DOI:10.1029/2005JB004031 |
| [] | Nie J X, Yang D H, Ba J. 2010. Velocity dispersion and attenuation of waves in low-porosity-permeability anisotropic viscoelastic media with clay. Chinese J. Geophys. (in Chinese) , 53 (2) : 385-392. DOI:10.3969/j.issn.0001-5733.2010.02.016 |
| [] | Niu B H, Wen P F, Wen N, et al. 2006. Estimation of hydrate concentration based on AVO modeling of BSR. Chinese J. Geophys. (in Chinese) , 49 (1) : 143-152. |
| [] | Priest J A, Best A I, Clayton C R I. 2006. Attenuation of seismic waves in methane gas hydrate-bearing sand. Geophys. J. Int. , 164 (1) : 149-159. DOI:10.1111/gji.2006.164.issue-1 |
| [] | Singh S C, Minshull T A, Spence G D. 1993. Velocity structure of a gas hydrate reflector. Science , 260 (5105) : 204-207. DOI:10.1126/science.260.5105.204 |
| [] | Sloan E D. 1998. Clathrate Hydrates of Natural Gases, 2nd ed[M]. New York: Marcel Dekker . |
| [] | Song H B, Wu S G, Jiang W W. 2007. The characteristics of BSRs and their derived heat flow on the profile 973 in the northeastern South China Sea. Chinese J. Geophys. (in Chinese) , 50 (5) : 1508-1517. |
| [] | Wang X J, Wu S G, Liu X W. 2006. Factors affecting the estimation of gas hydrate and free gas saturation. Chinese J. Geophys. (in Chinese) , 49 (2) : 504-511. |
| [] | Xu H N, Zhang G X, Zheng X D, et al. 2014. Integrated analysis of well logs and seismic data to deduce the possible distribution in depth of gas hydrate in Shenhu Area, South China Sea. Chinese J. Geophys. (in Chinese) , 57 (10) : 3363-3372. DOI:10.6038/cjg20141023 |
| [] | Zhang C J, Ulrych T J. 2002. Estimation of quality factors from CMP records. Geophysics , 67 (5) : 1542-1547. DOI:10.1190/1.1512799 |
| [] | Zhang G X, Xu H N, Liu X W, et al. 2014. The acoustic velocity characteristics of sediment with gas hydrate revealed by integrated exploration of 3D seismic and OBS data in Shenhu area. Chinese J. Geophys. (in Chinese) , 57 (4) : 1169-1176. DOI:10.6038/cjg20140414 |
| [] | Zhang R W, Zhang B J, Huang H D, et al. 2011. AVA characters on gas hydrate-bearing sedimentary deposit. Oil Geophysical Prospecting (in Chinese) , 46 (4) : 634-639. |
| [] | Zhang R W, Li H Q, Zhang B J, et al. 2015. Detection of gas hydrate sediments using prestack seismic AVA inversion. Applied Geophysics , 12 (3) : 453-464. DOI:10.1007/s11770-015-0503-3 |
| [] | Zhang Y W, Liu X W, Jin Y J. 2004. The velocity and attenuation research of hydrate-bearing sediments. Oil Geophysical Prospecting (in Chinese) , 39 (2) : 205-214. |