 2016, Vol. 59


As well known, the gravimeter, tiltmeter and strain gauge can reflect the earth tide variation without much distortion in their observation respectively. One of the reasons is that these observation instruments are all delicately developed as a quasi-linear time invariant system. May we ask whether such systems exist in nature? The answer is true. Liu et al.(2009) and Wang et al.(1988) have proved that the confined aquifer system is one such system theoretically. The change of well water level is a naturally linear time invariant response to the volume strain in the aquifer system. The most prominent features of the linear time invariant system is that the amplitude spectrum of the system's transfer function is a constant, and the phase lag is zero. The output (well water level) has a great amplification effect on the input (volume strain). To validate this theory, the actual evidence based on observation is necessary. So far, we have not found relevant literatures in this field. The reason is that, in addition to the solid tide of well water level can be clearly observed from a borehole, the volume strain in situ can be observed is required at the same time. In this system, the volume strain is the input and cause, while the well water level is the output and effect. We can use both of observed values of the system to demonstrate whether the system is linear time invariant system, and thus examine above theory. Before the demonstration, it is necessary to briefly clarify what the linear time invariant system briefly is. Why can the confined aquifer system become a natural linear time invariant system and what is the transfer function of this system? The key of the demonstration of the system is to find a borehole, which can observe volume strain and the change of well water level at the same time. The curve of the two observations can record the solid tides clearly. Among dozens of four-component strain observation stations, we found the four-component strain and well water level observation data are best suited for the test of the borehole system properties at Linxia seismic station, Gansu Province, China. This borehole was drilled through a confined aquifer, and double peak-valley tidal shape of a day was clearly observed from the well water level and fourcomponent strain observation data. The borehole is good to be found but not guaranteed. How to extract the volume strain information from four component strain observation data in the borehole? How to demonstrate the properties of this borehole system by using the borehole strain and well water level observation data of Linxia station? These questions are the main content of this paper to explore.
2 ELEMENTS OF LINEAR TIME INVARIANT SYSTEMSIf the output is proportional to the input, and the output is neither distorted nor delayed, the system is then called a linear time invariant system. Among the various observation systems in China earthquake administration, the vast majority capable to capture the precursor signals can be classified into such a system. In fact, any kind of observation system cannot be a real linear time invariant system absolutely. For an observation system realizable physically, within the prescribed pass band and meet the requirement of undistorted within allowable range of observation errors, can be approximated as a linear time invariant system.
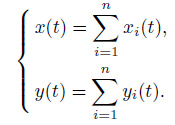
If a system satisfies both the superposition and the homogeneity, the system is regarded as a linear system (Lin, 2008 ; Karu, 2001). The so-called superposition indicates that when a number of inputs excite the system at the same time, the total response of the system is equal to the sum of the responses excited by each input alone.
|
(1) |
Namely in the formula, x (t) and y (t) represent the input and output at t time respectively, xi (t) represent the different frequency components of x (t), yi (t) represents the output corresponding to the input xi (t).
The so-called homogeneity means that when s represents the sensitivity for each output yi (t) corresponding to input xi (t), the system's total output also has the same sensitivity s corresponding to total input.
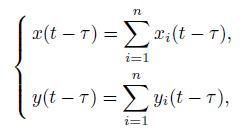
If a linear system meets the requirement
|
(2) |
the system is thus regarded as a time-invariant system (Lin, 2008 ; Karu, 2001). τ represents the time origin in the formula. Time invariant systems show that the response of the system is independent of the time origin, and the output waveform of the system is only related to the input waveform.
In short, the output of a linear time-invariant observation system contains frequency which only exists in the input, neither containing nor involving a new frequency, and every frequency component in the output is amplifies by a same factor with no delay or delayed by a same amount of time. Therefore the waveform is unchanged through the system. The similarity is a key and intuitive indicator to measure whether a system is a linear time invariant system. Any one of the observation system is a physically realizable causality system, which means no output if no input, that is, compared to the input, the output is impossible to occur in advance (Liu et al., 2010).
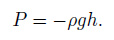
3 THE THEORETICAL BASIS FOR THE CONFINED AQUIFER SYSTEM AS A NATURAL LINEAR TIME INVARIANT SYSTEMThe well water, which is drilled through the confined aquifer, is called the confined water. The water body is filled and confined in each part of the aquifer, which is determined by the imbedded condition of the aquifers, has the following characteristics (Wang et al., 1997): the distribution area of confined water is inconsistent with the recharge area; underground water subjected to hydrostatic pressure is not free; due to the restrictions from aquifuges, the influence of seasonal changes of hydrological and meteorological factors impacts on the water level, flow rate, water temperature and water quality of the confined water is far less than the influence on the underground water; the bearing layer thickness is stable, which is not affected by the seasonal variation of rainfall. Confined aquifer system can be regarded as such a big container made of water-resisting layer, a borehole at the top of the container is interlinked with the groundwater. The transmission hydrostatic pressure of fluid is
|
(3) |
In the equation, the direction of the hydrostatic pressure is contrary to the external stress acting on confined aquifer, while the numeric value is same. h represents the well water level, ρ represents the density of underground water, g represents the gravity, ρg represents the weight measure of the underground water. Due to changes of hydrostatic pressure in confined aquifer system will cause the volume change of aquifer, which lead to changes of water well level in the borehole well. Therefore, well water level can be regarded as a pressure gauge.
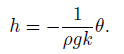
Based on the principle of elastic mechanics and fluid mechanics, the dynamic equations for the response of well water level in a confined aquifer under hydrostatic pressure (Liu et al., 2009) are
|
(4) |
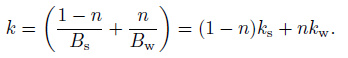
In the equation, θ represents volume strain, k represents reciprocal of bulk modulus of aquifer porous elastic medium, that is, the compression coefficients of the aquifer porous elastic medium. The equation is
|
(5) |
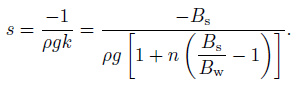
In the equation, n represents the porosity of aquifer, ks and kw represents the bulk modulus of the rock and the fluid in the aquifer respectively, which are the compression coefficients. In the equation, "-" represents the compression of volume strain which raises the well water level, and vice versa. If s is observation sensitivity of the well water level, by definition, 
|
(6) |
In this paper, the unit of h is mm, the strain unit of θ is 10-9, then the unit of s is mm/10-9. In the lithosphere, the bulk modulus of rocks Bs =(0.44 ~ 1)×1011 Pa. The bulk modulus of water is Bw = 2.2×10⁹ Pa, and Bs/Bw ranges from 20 to 45.4. Under a premise that the water level in the wells is dimensional and with a unit of mm, whether in the rock or in the water the value of the bulk modulus B is larger by 108 to 1010 times of the water weight ρg, and the result is that the bearing aquifer sensitivity s maximums up to -10 mm/10-9, namely when volume strain is 10-9, well water level will have a 10 mm changes, with a negative sign meaning they changes in an opposite direction. That is why the well water level has a mechanism of the natural amplification when volume strain excites the confined aquifer system. Therefore, well water level can be used as a volume strain gauge.
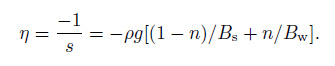
If η is the calibration of the well water level, definition then by follows
|
(7) |
The unit of η is 10-9/mm.
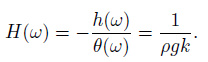
Based on cybernetics theory, if the output is proportional to the input and the output reflects the input without any distortion or delay, called a proportional (or enlarging) link (Zeng, 2007 ; Lu, 2006). Eq.(6) means the dynamics equation of the link, 
|
(8) |
In the equation, ω is the angular velocity, unit is °/ hour, transfer function is a constant, indicating that the amplitude spectrum of the system is constant; phase spectrum is zero, indicating that any frequency component is amplified by the same multiplier in the output comparing with the input in the confined aquifer system and without delay. Because the actual physical system always has an inertia, the output will not be ahead of the input, so the confined aquifer system can be approximated as a linear time invariant system that can achieve physically realizable causality system.
4 FOUR COMPONENT STRAIN OBSERVATION OF BOREHOLE AT LINXIA STATIONLinxia station is located in Gansu province, China, with north latitude 35.6 degree, east longitude 103.2 degree, underlain with a geological formation of granite stratum. The depth of the observation well is 45 m with the probe installed at a depth of 44.7 m. The distance from the water well level to the wellhead is 10 m. The resolution of the water gauge is 0.03 mm. The probe of the strain observation is cylindrical in design, with a diameter of 107 mm and a height of 450 mm. The diameter of the borehole where the probe is installed is 130 mm. Four strain measuring lines with a mutual angel of 45° are laid out in the drill. The azimuth of 1# measure line is 92°or 272°. The resolution of the four-component borehole strain meter is 10-10. Fig. 1 shows the layout of measuring elements of the four-component borehole strainmeter. In addition to the four component strain observation, the water level observation in the borehole of Linxia station can display the change of solid tide as well as the strain component. Linxia station adopt a YRY-4 four-component borehole strainmeter. The observation frequency band of YRY-4 strainmeter is very wide, in addition to recording the solid tide, but also can record the seismic waves. The unit of strain observation is 10-9. Furthermore, water level and water temperature can also be observed. The unit of well water level observation is mm. This paper collected the four component strain and well water level observation data from January 1, 2013 to December 31, 2014.

|
Fig. 1 Distribution of the four component borehole strain measurement lines at Linxia station |
The strain and well water level observation are the same relative observation as ground tilt and gravity observation. For this reason, these two-year hourly observation value of four-component strain and well water level subtracting the corresponding observed values at 0:00 on January 1, 2013 respectively. Fig. 2 are relative observations curve for four-component strain and well water level.

|
Fig. 2 Observation curves of four-component borehole strain and the well water level at Linxia station (the unit of strain in the top figure is 10-9; and the unit of well water level in the lower figure is mm) |
From Fig. 2 we can found outliers appear in the relative observation data of strain components and well water level occasionally, and there are trends in strain data. Therefore, the original data are preprocessed to exclude the trends and outliers.
According to the theory of elasticity (Means, 1982 ; Yang and Budinas, 2005), the sum of strain observation values from two mutually orthogonal lines through the same point is the borehole's surface strain. According to the literature (Liu et al., 1988), 2/3 of near surface borehole surface strain is volume strain, therefore the volume strain can be obtained from the four-component borehole stain values. Fig. 3 are two observation curves of volume strain obtained from two mutually orthogonal strain observation data.

|
Fig. 3 Volume strain of the borehole (the unit of volume strain is 10-9) |
From Fig. 3 we can find that the two volume strain observation curves are very consistent. In this paper, we take the average of two volume strain observations as a final value. Fig. 4 are the volume strain and water well level observation curve after removing linear trend and outliers.

|
Fig. 4 Graphs of volume strain and well water level of the borehole (The unit of volume strain is 10-9, and the unit of well water level is mm). |
From Fig. 4, we found that the well water level curve and volume strain curve are mirror symmetry, and the shapes of both are very similar. The correlation coefficient R = -0.9353. The correlation coefficient and sensitivity are all negative, the two curves are mirror symmetry, the reason is that both well water level and volume strain consist causality system. Regression analysis was carried out on the both curves. The regression coefficient is the sensitivity of the borehole system, and its value s = -0.1620 mm/10-9. The reciprocal value is -6.17×10⁻⁹/mm, that is, the calibration value of borehole system. It is hard to distinguish the existence of phase lag in the well water level relative to the volume strain from Fig. 4. To realize this, the phase lag can be determined by whether the peak/valley and valley/peak on two observation curves are at the same time or not. Well water level cannot be found any advanced phenomenon from Figs. 5 -6, and the phase lag is very small, which demonstrates that the borehole system is a linear time invariant system from the time domain analysis.

|
Fig. 5 Observation graphs of volume strain and water level of the borehole in May, 2013 |

|
Fig. 6 Observation graphs of volume strain and well water level of the borehole in July, 2014 |
According to the theory of linear time invariant system, the sensitivity of semidiurnal wave and diurnal wave superimposed on the volume strain and well water level curves should be the same with the sensitivity of anniversary component in the time domain. To verify this, at this time we observe from the time domain instead of the frequency domain.
The specific situation of Linxia borehole system remains unknown yet. It is like a black box (t)o us, with volume strain and well water level respectively performing as the input and the output of the black box, as shown in Fig. 7.

|
Fig. 7 Schematic diagram of input and output of the borehole system |
According to the control theory and signal processing theory (Lin, 2008 ; Karu, 2001), the relationship between input and output is
|
(9) |
In the equation, * means convolution, h (t) is called the unit pulse time response function, also is called the weight coefficient of the system.
To Eq.(9), if we make Fourier transform on both sides, then we have
|
(10) |
In the equation, H (ω) is called the transfer function of borehole system. Generally transfer function is a complex, which can be written as H (ω)= A (ω) e-jφ(ω). A (ω)= |H (ω)| indicates the amplitude spectrum. φ(ω) is called the phase spectrum. h (t) and H (ω) are Fourier transform mutually. h (t) and H (ω) represent the characteristics of the borehole system in the time domain and frequency domain respectively. h (t) reflects the attenuation characteristics of output (well water level) under the unit volume strain pulse excitation, while H (ω) reflects the sensitivity and time delay of angular velocity ω of the output of the system in frequency domain.
Relative observation data of volume strain and well level were analyzed by Fourier transform respectively. Figs. 8 -9 are the Fourier spectrum of volume strain and well water level respectively. For the period T = 360°/ω, the angular velocity ω is changed to period T (the unit is hour) in the graph. The absolute value of spectrum is the amplitude spectrum A (T). Figs. 8 -9 shows that at T=12, 24 hours, namely, in the semidiurnal wave and diurnal wave frequencies, the amplitude spectrum of A (T) value is very significant, revealing that the sensitivity of the borehole system is large at the two spectra of borehole system, and the calibration value is relatively small. In other frequencies, amplitude spectrum value is comparatively small. Contrasting Fig. 8 with Fig. 9, it can be found that the well water level preserved the semidiurnal wave and diurnal wave component in the volume strain, because both the amplitude spectrum on the two frequencies are very significant. Due to the nonlinear disturbance such as the ground and underground water, the continuous spectrum on both non-tidal band are relatively small. However, the disturbance of the former is smaller than the latter by the precipitation, the underground water, and other non-volume circumstance interference, whose amplitude spectrum is much smaller than the tide spectrum. The Fourier spectrum of complex periodic function made from a mix of wave groups should be a line spectrum if there were not the above nonlinear disturbances.

|
Fig. 8 Fourier spectrum |x (T)| of the volume strain of the borehole |

|
Fig. 9 Fourier spectrum |y (T)| of the well water level |
Assuming that the Fourier spectrum of volume strain and well water level are respectively x (ω)= Ai (ω) e-ji (ω), y (ω)= Ao (ω) e-jo (ω), where Ai (ω) and Ao (ω) are the amplitude spectrum of the two respectively, and i (ω) and o (ω) are the phase spectrum respectively, by Eq.(10), the transfer function of the borehole system H (ω) and its amplitude spectrum A (ω) and phase spectrum φω) are
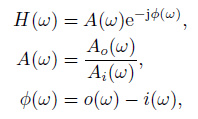
|
(11) |
respectively.
In the equation, A (ω) is the amplitude ratio of a wave group of well water level to volume strain in the frequency of ω, and its value is the absolute value of sensitivity, hereafter referred without distinction for convenient discussion. The amplitude spectrum of volume strain and well water level is given in Fig. 8 and Fig. 9, respectively. According to Eq.(11), the sensitivity of borehole system can be obtained respectively from the semidiurnal wave and diurnal wave spectrum. The results showed that the sensitivity in the above two frequency bands is smaller about one order of magnitude than the result obtained from the time domain, while phase difference is far worse than expected. The cause of the phenomena is that the Fourier transform spectrum analysis cannot analyze tidal spectrum. In a simplified tidal Doodsons expansion (Melchior, 1984 ; Fang, 1984 ; The Earth Physics Department of Peking University et al., 1982), the diurnal wave band has 52 waves and 18 wave groups; the semidiurnal wave band has 27 waves and 13 wave groups. The difference of angular velocity between different wave groups is very small, and the difference between the waves in a same group is farther smaller. Fourier transform cannot identify the wave group with little difference in angular velocity. Therefore, Venedikov harmonic analysis method was applied in this article, the method was, in fact, a kind of digital frequency filter. Using this kind of filtering method can calculate the tidal factor and phase lag of each wave group. Tidal factor is the ratio of observed tidal amplitude to theoretic amplitude for the wave group on the spectrum. Phase lag is the difference between observed phase and the theoretic phase for the wave group. Following this way of thinking, this article used the theoretic volume strain value to analyze the volume strain and well water level observation data based on harmonic analysis method respectively. Assuming that the theoretical tidal amplitude value of volume strain for a wave group is AiT (ω), and the phase lag is iT (ω), the tidal factor of the wave group becomes Ai (ω)/AiT (ω), and the phase lag is i (ω)- iT (ω) in the volume strain harmonic analysis result. Similarly, we can infer that the harmonic analysis tidal factor of the wave group is Ao (ω)/AiT (ω), and the phase lag is (o (ω)- i (ω)) in the well water level.
In this study, we only selected the volume strain and water level observation data of every month during the period from May to July, 2013 and May to July 2014 for harmonic analysis as representatives. The larger amplitude of M2 wave and S2 wave in the semidiurnal wave, and the O1 wave and P1 wave in the diurnal wave were selected in the harmonic analysis results. The amplitude spectrum A (ω) of the wave group in the borehole system can be obtained from wave group of tidal factor of well water level divided by corresponding wave group of tide factor of volume strain, the value is 
|
|
Table 1 The harmonic analysis results of volume strain and well water level and transfer function of borehole system at Linxia Station for M2, S2, O1 and P1 wave groups in 2013-05-2013-07 |

|
|
Table 2 The harmonic analysis results of volume strain and well water level and transfer function of borehole system at Linxia Station for M2, S2, O1 and P1 wave groups in 2014-05-2014-07 |
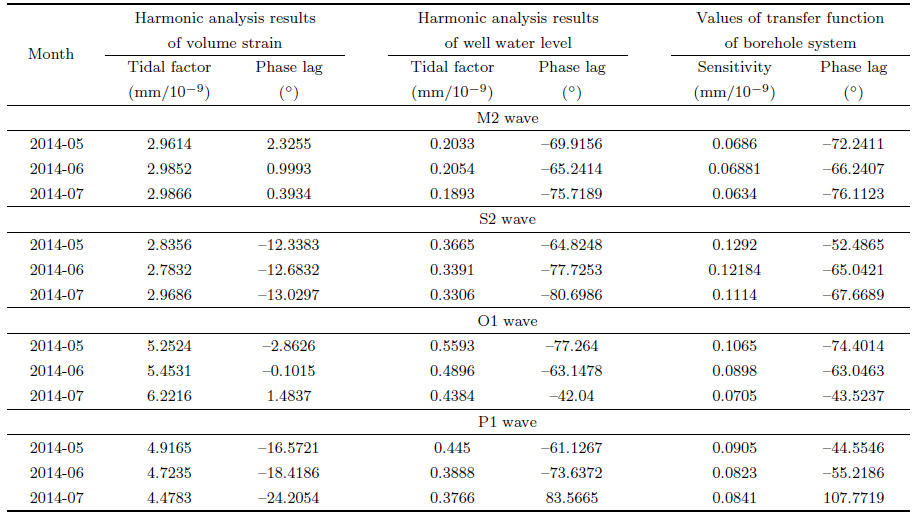
It can be found that from Table 2, the 4 wave groups and a total amount of 12 sensitivities are not as close to the sensitivities of annual periodic change in time domain as the 12 sensitivities in Table 1. Fig. 4 shows that, the corresponding observations curve from Table 2 is rougher than the curve from Table 1, with the reason considered due to more interference. To confirm it, we chose the observation data from Feb. to Apr., 2013, whose observation curve is smoother in Fig. 4, to calculate the sensitivity and phase lag of 4 wave groups of borehole system. The results are shown in Table 3. It can be seen from Table 3 that the sensitivity of 4 wave groups during this period is closer to the sensitivity from annual analysis than the results of Table 1. The less the non-volume parameter interference is, the closer the sensitivity is. Tables 1 -3 demonstrate that in the tidal wave frequencies, the borehole system's sensitivity is roughly close to the annual component of sensitivity, and the amplitude spectrum of borehole system is roughly flat from high frequency to low frequency.
|
|
Table 3 The harmonic analysis results of volume strain and well water level and transfer function of borehole system at Linxia Station for M2, S2, O1 and P1 wave groups in 2013-02-2013-04 |
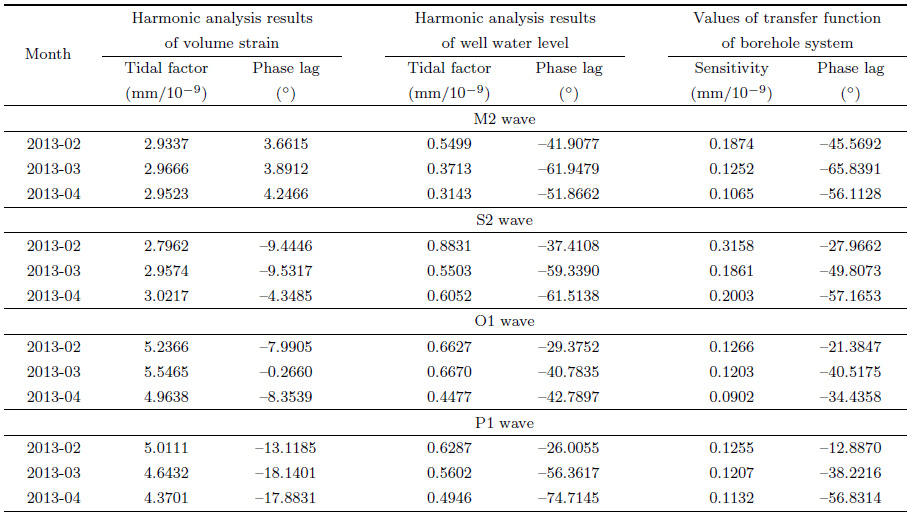
Figure 4 shows that the most significant change of volume strain is about 6×10⁻⁶ in 2 years, the maximum amplitude variation of well water level is about 900 mm. Such a large range is not simply caused by the solid tide, but by the annual change in temperature. Therefore, the sensitivity obtained from the time domain is mainly determined by the annual periodic changes of both observational data of volume strain and well water level. The solid tide superimposed on a background of annual changes shown in the Figs. 5 -6 is simply a kind of high frequency components with small amplitude, which have little effect on the annual changes of data. Consequently the sensitivity obtained from the time domain represents the sensitivity of the annual periodic changes of the borehole system primarily. The phase relationship between well water level and volume strain is determined by the law of causality as well. If the phase lag is close to zero, then the peak and valley of former should correspond to the valley and peak of the latter at the same time. In this regard, the study demonstrated the tidal wave curve which was superimposed on the background of the annual change. For the exploration of this phase relationship, we enlarge the time and the vertical axis of Figs. 5 -6, setting up a line perpendicular to the time axis on the graph, making the straight line move from left to right in the figure, and the results did not detect a phenomenon that the peak and valley of well water level goes ahead of valley and peak of volume strain. Both peak and valley and valley and peak are located almost on the same straight line, which indicates that the phase lag should be close to zero, further demonstrating that the borehole system is close to a linear time-invariant system in the time domain. Provided that the system is a linear system, its various semidiurnal wave groups and diurnal wave groups should be treated equally, and the various wave groups should have the same sensitivity of annual periodic changes in the time domain. At this point, we must change the perspective from the time domain to the frequency domain to seek more evidence. Due to the particularity of the wave groups mentioned above, the traditional Fourier transform cannot extract the amplitude spectrum and phase spectrum of these waves groups, but it can reflect the frequency of solid tides kept in the well water level from the volume strain in semidiurnal and diurnal range. In order to extract the amplitude spectrum and phase spectrum from these wave groups, in the paper we used the theoretical value of solid tide wave of the volume strain to perform harmonic analysis on the volume strain and well water level data, and then we used the tidal factors and phase lags to calculate the amplitude spectrum (sensitivity) and phase spectrum (phase lag) for various wave groups. This paper selected the wave groups with larger amplitudes of the semidiurnal and diurnal waves, and computed 5 semidiurnal wave groups and 6 diurnal wave groups using the software MAPSIS (Jiang, 2000). Most of the sensitivity of the wave groups in nine months were close to the sensitivity computed from the time domain, and most other wave groups not listed, except for a few, were of the same case. However, the phase lags of the transfer function of wave groups were large. The delay of two semidiurnal wave groups is approximately 1~2 hours, and the delay of diurnal wave groups is approximately 1~4 hours. The reason is considered to be due to that the arctangent equation 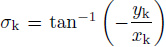
Liu et al.(2009) deduced that the amplitude spectrum of transfer function of the aquifer is a constant, the phase spectrum is zero. This is based on the law of causality in the hydrostatic and elasticity, but the reality may be not the case. Liu et al.(2009) made idealized assumptions on the confined aquifers, and used a simplification method to remove the effects caused by the parameters such as the precipitation, the underground water and the pressure which produced a non-volume-strain in the well water level. It does not comply with the real situation to only keep the modulus of rock frame, liquid and the porosity of aquifers. As the philosopher Ludwig Wittgenstein has said, "it is not a mystery how the world is, but what the world is"(Zhang, 2013). The argumentation in this study from the high frequency of the tidal wave groups, to the low frequency of the temperature annual change, based on the volume strain and well water level observation data from Linxia station, demonstrated that the values of the amplitude spectrum of transfer function among different wave groups of a borehole system are similar, and the phase spectrum are close to zero approximately, which indicates that the borehole system of Linxia station is close to a linear time-invariant system. This approximation due to the borehole system of Linxia station does not fully comply with the ideal assumptions for confined aquifer in Liu et al.(2009), which gave a transfer function based on a result of abstract mathematical interpretation, and which is obtained from extracting the essential properties of the confined aquifer and leaving the nonessential attributes aside. If the external non-volume strain parameters (the precipitation and the underground water, etc.) are smaller, the amplitude spectrum of the transfer function of the borehole system will become close to a constant, and the phase spectrum is close to zero. The theoretical transfer function of a confined aquifer in the Eq.(8) is a target value which can be approached but cannot be reached. If leave aside the circumstance disturbance around a borehole system such as the Linxia station, the results based on observation data may be closer to a linear time invariant system. But by now, no more observation data is available and from the calculation and demonstration in this study, the equation is also proved to be correct in Liu et al.(2009). The reason why an ideal confined aquifer system is a linear system is that the crust is assumed to be linear, homogeneous and isotropic elastic in Liu et al.(2009).
As a famous saying goes that "the ingenious principles hiding in the nature deserve exploration for long", human's curiosity prompts people to make theoretical explanation for the nature phenomena. Human's spirit of suspicion also always prompts people to question the previous interpretation of the theories based on new evidences, and thus the scientific progress and development are realized. This has become a consensus of the scientific community. To date, the well water level and the deep strain observation have caught much more attention, and many more observation stations were newly built. Many researches around the well water level and the deep strain observation were performed while the properties of the borehole system were scarcely discussed, with the main reason considered to be the lack of well water level and volume strain observation data at the same borehole. In this paper, well water level and four-component borehole strain data were obtained at the Linxia station, China. The concrete evidence based on the observation data, not only demonstrated that the borehole system is close to a linear time-invariant system at Linxia station, but also provided a proof for the reliability of the strain gauge of the Type YRY-4 four-component borehole strain, and the well water level observation system.
| [] | Fang J. 1984. Solid Earth Tides (in Chinese)[M]. Beijing: Science Press . |
| [] | Jiang J, Li S L, Zhang Y B, et al. 2000. Seismic Precursor Information Processing System (in Chinese)[M]. Beijing: Seismological Press . |
| [] | Karu Z Z. 1995. Signals and Systems Made Ridiculously Simple[M]. Cambridge, MA: ZiZi Press . |
| [] | Lin Z S. 2008. The Signal and Linear System (in Chinese)[M]. Beijing: Tsinghua University Press . |
| [] | Liu X Y, Li P, Zhang Y B. 1988. Calculation of theoretical value of cubic expansion tide and its harmonic analysis. Crustal Deformation and Earthquake (in Chinese) , 8 (4) : 354-358. |
| [] | Liu X Y, Zheng X J, Wang L, et al. 2009. Response analysis of the well-water-level system in confined aquifer. Chinese J. Geophys. (in Chinese) , 52 (12) : 3147-3157. DOI:10.3969/j.issn.0001-5733.2009.12.025 |
| [] | Liu X Y, Huang S M, Liang Q Q, et al. 2010. Fidelity analysis of an observation system. Journal of Geodesy and Geodynamics (in Chinese) , 30 (Supp. 1) : 1-6. |
| [] | Lu Y X. 2006. Modern Engineering Control Theory (in Chinese)[M]. Beijing: Chemical Industry Press . |
| [] | Means W D. 1982. Stress and Strain (in Chinese). Ding Z Y, Yin Y Q Trans. Beijing:Science Press, 74-114. |
| [] | Melchior P. 1984. The tides of the Planet Earth (in Chinese). Du P R, Wu Q P, Chen Y H Trans. Beijing:Science Press. |
| [] | The Earth Physics Department of Peking University, the Geodetic Survey Department of Wuhan Survey College, the Geophysics Staff Room of University of Science and Technology of China. 1982. Gravity and Earth Tide (in Chinese)[M]. Beijing: Seismological Press . |
| [] | Wang C M, Che Y T, Wan D K, et al. 1988. Study on the Micro Dynamics of Groundwater (in Chinese)[M]. Beijing: Seismological Press . |
| [] | Wang J Y, Dong S Y, Chen J M. 1997. Earthquake Prediction Method of Underground Fluid (in Chinese)[M]. Beijing: Seismological Press . |
| [] | Young W C, Budynas R G. 2005. Roark's Formulas for Strain and Stress (in Chinese). Yue Z F, Gao X S, Wang F H, et al., Trans. Beijing:Science Press, 9-26. |
| [] | Zeng J. 2007. Foundation of Control Engineering (in Chinese)[M]. Beijing: Publishing House of Electronics Industry . |
| [] | Zhang F. 2013. Features of western philosophy in the perspective of four philosophical sayings. Journal of CUPL (in Chinese) , 22 (4) : 142-148. |