 2016, Vol. 59


2 Northwest Regional Climate Center, Lanzhou 730020, China;
3 College of Atmospheric Sciences, Chengdu University of Information Technology, Chengdu 610225, China
Drought is defined as anomalous water deficit of ecosystem (Ghulam et al., 2007 ; Qin et al., 2008). Conventional drought monitoring methods are often based on site observations. However, due to heterogeneity of land surface, conventional methods can hardly reflect drought and its comprehensive impact at relatively large scale. Besides, intensive site observations cost too much, and are poor in time effectiveness (Bao, 2007). Remote sensing technology has the feature of contiguous in space and dynamic in time (Yi, 2008). Taking the advantage of macro view, speediness, objectivity, low cost, large scale and visual display, etc., remote sensing is becoming an effective method for drought monitoring.
Remote sensing of drought is mainly to detect surface soil moisture content. Soil moisture is an important parameter representing land-atmosphere energy exchange and water cycle. Spatial and temporal distribution of soil moisture and its change will influence surface evapotranspiration, soil temperature, etc.(Li et al., 2010), and to the end have impacts on surface hydro-thermal balance. In turn, change in surface hydro-thermal balance can also reflect change in soil moisture, and reflect droughts. To date, drought monitoring models are mainly established by using factors representing soil or vegetation water and heat conditions, and drought monitoring is achieved by analysis of spatial and temporal change in these factors.
Albedo, Normalized Difference Vegetation Index (NDVI), and surface temperature are often used to establish drought monitoring models, because their change can well represent the change in land surface hydro-thermal condition. Albedo can be used for drought monitoring because soil moisture influences vegetation grow and can be reflected by albedo. The NDVI method, which is based on reflectance data (Rouse et al., 1974), takes advantage of the relationship between vegetation conditions and soil moisture. When vegetation suffers water deficit, the reflectance of vegetation cover will change, and then changes in NDVI, thus drought can be monitored by the change in NDVI. After NDVI was proposed, many arid indices based on vegetation index are used for drought monitoring: such as Anomaly Vegetation Index (AVI)(Chen et al., 1994), Vegetation Condition Index (VCI)(Kogan, 1990), Normalized Difference Water Index (NDWI)(Feng et al., 2004), and Normalized Difference Dry Index (NDDI)(Gu et al., 2007), etc. Surface temperature is used to establish drought monitoring models because it reflects micro features of surface hydro-thermal balance. For example, the apparent thermal inertia method, often used for drought monitoring over bare soil, uses linear relationship between apparent thermal inertia and soil moisture to establish drought monitoring model. This model takes advantage of soil thermal features sensitive to soil moisture and uses daily temperature range calculated by maximal and minimal temperature to estimate apparent thermal inertia (Zhao et al., 2013). The methods based on thermal infrared data, such as Temperature Condition Index (TCI)(Kogan, 1995), Crop Water Stress Index (CWSI)(Idso et al., 1981), and Water Deficit Index (WDI)(Moran et al., 1994), were established by using surface temperature on the basis of the principles of transpiration and energy balance. Vegetation transpiration is a heat dissipation process closely related to surface energy and soil moisture. When soil water is sufficient, vegetation canopy temperature is relatively low, when soil water is insufficient and plant lacks water, transpiration will get weak and causes canopy temperature rise. Therefore, canopy temperature can be used to establish an index reflecting plant water condition and drought (Liu et al., 2012). Since NDVI and surface temperature are closely related to dry conditions, drought monitoring model using a combination of the two factors was developed and can better monitor drought. Temperature Vegetation index (TVX)(Prihodko and Goward, 1997), defined as the ratio of surface temperature to NDVI, is a simple and physically clear and recognized as a relatively efficient integrated drought index. Many similar models, such as Temperature Vegetation Drought Index (TVDI)(Sandholt et al., 2002), Vegetation Temperature Condition Index (VTCI)(Wang et al., 2001), were also established by using surface temperature and NDVI.
However, these methods are applicable only to bare land table (such as apparent thermal inertia method), or only to vegetation covered surface (such as NDVI method and a series of drought monitoring models based on NDVI). These methods can rarely be suitable for a mixed surface of bare soil and vegetation, and the monitoring accuracy of these methods can't meet our requirements at most of the time. To meet today's increasing demand for drought monitoring, exploring new remote sensing drought monitoring method can help to further improve and develop drought monitoring and warning technology.
Bowen ratio is defined as the ratio of sensible heat flux to latent heat flux and reflects energy partitioning between sensible heat and latent heat influenced by surface moisture change (Mo and Su, 1997 ; Zeng, 2011 ; Wang et al., 2008). When soil moisture is sufficient, surface temperature is relatively low, and sensible heat flux is relatively small and latent heat flux is relatively large, on the contrary, when soil moisture is insufficient, surface temperature is relatively high, and sensible heat flux is relatively large and latent heat flux is relatively small. In this process, the total of sensible heat and latent heat is constrained by available energy. Based on this, we can infer that more sufficient soil moisture implies a smaller Bowen ratio and less soil moisture implies a large Bowen ratio. Therefore, theoretically, Bowen ratio can reflect surface hydro-thermal features and can be used to represent dry-wet conditions of surface. The larger the Bowen ratio, the dryer the surface; the smaller the Bowen ratio, the wetter the surface (Wang et al., 2008 ; Gao et al., 2002 ; Zhang and Cao, 2003 ; Tu et al., 2009). Besides, relative to models established by surface temperature, sensible heat and latent heat fluxes of Bowen ratio represent energy and moisture conditions respectively. The two most important factors, energy and moisture, are included in the Bowen ratio. In addition, the energy term of Bowen ratio (sensible heat flux) is suitable for both bare and vegetated surface, and the moisture term (latent heat flux) represents transpiration over vegetated surface and evaporation over bare soil. Therefore, Bowen ratio method is suitable for both bare soil and vegetated surface. This is a development for previously mentioned methods which are suitable for either bare soil or vegetated surface. Given this, we have sufficient reasons to introduce Bowen ratio as a new method for drought monitoring.
Although Bowen ratio was used to reflect surface dry-wet conditions and help do analysis in land surface processes (Zeng, 2011 ; Wang et al., 2008 ; Gao et al., 2002 ; Zhang and Cao, 2003 ; Tu et al., 2009 ; Xia and Zhang, 2014), however, to date, Bowen ratio has not been applied to drought monitoring area. In this paper, on the basis of the principle of surface energy balance, selecting Hedong region of Gansu province as the study region, we established a Bowen ratio method for drought monitoring using MODIS image data and compared it with TVX method. At the same time, we established classification criteria of Bowen ratio method according to agricultural drought classification of relative soil water content, and assessed spatial distribution of dry-wet conditions of soil over Hedong region of Gansu province.
2 STUDY AREASNorthwest China is a region where drought takes place frequently, and Gansu province is the most typical province of the dry Northwest China. Gansu province is located at the upstream of Yellow river. Far from the sea and under the control of dry land air mass, Gansu province is short of precipitation and belongs to arid and semi-arid climate. Drought is the most typical, serious, frequent weather disaster in Gansu province, accounting for 70% of total weather disasters (Wang et al., 2009). The Yellow river runs through Gansu province, and we usually call the regions at the west of the Yellow river as "Hexi" region and call the regions at the east of the Yellow river as "Hedong" region. Hexi region is located in arid region where irrigation agriculture is dominant, while Hedong region is located in semi-arid and semi-humid region and rain-fed agriculture is dominant. Baiyin and Lanzhou are included in Hedong region. Although Hexi region lacks rainfall throughout a year, crops are irrigated during growth periods and agricultural drought seldom happens. However, in the Hedong rain-fed region, crop growth totally relies on natural precipitation, and weather droughts are usually converted into agricultural drought, therefore, drought monitoring is particularly important in this region.
Hedong region is selected as the study areas, including Lanzhou, Baiyin, Linxia, Dingxi, Tianshui, Pingliang, Qingyang, Gannan and Longnan, within the region of 32°31′N-37°36′N and 100°48′E-108°46′E (Fig. 1). This region is a sensitive area to climate change and a fragile area of ecosystem (Zhang et al., 2009). Meteorological and soil observation is intensive in this region, and there are 61 conventional sites and 50 automatic soil moisture sties (Fig. 1).

|
Fig. 1 Distribution of meteorological stations in the study region |
The data used to derive Bowen ratio include:
(1) 8 tiles of clear sky MODIS image which covers the study region were selected. The spatial resolution of MODIS data is 1 km, and three tiles are in spring (April 7, 2014, May 11, 2014, and May 26, 2014), three tiles are in summer (July 16, July 24, and July 29, 2014), and two tiles are in autumn (October 5, October 23, 2014). Spring, summer and autumn are the seasons when droughts take place most frequently. MODIS data are from Northwest Regional Climate Center, Gansu Meteorological Administration. MODISL1B data were used for study, which include 36 bounds of reflectance and solar zenith and so on. The data were firstly processed by image processing software developed by China National Satellite Meteorological Center, including radiation correction, atmospheric correction, geometric correction, geo-targeting, and splicing, cutting, and so on, and produced.ld3 files which can be processed in ENVI software. During this process, NDVI and surface broadband albedo α were calculated by the following equations (Liang, 2001):
|
(1) |

|
(2) |
where α1, …, α5, α7 are band 1-5 and band 7 of MODIS reflectance, respectively. Because solar zenith and altitude angle are mutual complementary angles, solar altitude angle can be calculated by solar zenith, such as
|
(3) |
where ω is solar altitude angle and δ is solar zenith.
(2) The synchronized surface meteorological data (61 sites) were provided by Gansu Meteorological Administration, including: pressure p (hPa), surface air relative humidity Hr, surface air temperature Ta (℃), surface temperature Ts (℃), and surface wind speed u (m·s-1). The Celcius temperature was transformed into Kelvin temperature by the equation T (K)=T (℃)+273.15. Air density was calculated using pressure p and surface air temperature Ta (K):
|
(4) |
where ρ is air density, in unit of kg·m-3. Actual vapor pressure was calculated by the Tetens formulation using relative humidity Hr and surface air temperature Ta(K)(Sheng et al., 2003):
|
(5) |
|
(6) |
where ea and e0 are actual and saturated vapor pressure, in unit of hPa. Finally, the meteorological variables were interpolated by Kriging method to match the scale of MODIS image data.
3.1.2 Ancillary data(1) Synchronized soil water content (50 sites), provided by Northwest Regional Climate Center, include layers of 10 and 20 cm depths, and the temporal interval is one hour. The mean soil water content for the 10~20 cm soil layer was calculated by the average of soil water content of layer 10 and 20 cm depths. Then the average soil water content was interpolated to match the time of MODIS image data.
(2) Synchronized surface turbulent data and seven tiles of MODS image data. The results of Bowen ratio method were validated by turbulent data observed by Eddy Covariance system (EC) from three sites, Dingxi (104.62°E, 35.58°N), Pingliang (106.94°E, 35.53°N), and Qingyang (107.85°E, 35.68°N), in the study region. In addition to eight tiles of MODIS image data and synchronized EC data over the study region, the MODIS image data and EC data at the three sites in 7 clear sky days were also selected. These clear sky days include March 26, June 6, July 4, August 14, September 3, October 24, and November 16, 2014. Turbulent data, including sensible heat (H) and latent heat (LE) fluxes, were interpolated to match the time of MODIS satellite passing territory. Finally, the observed Bowen ratio was obtained by β = H/LE at the three sites.
(3) Historical precipitation data. Daily precipitation data at 61 sites for the period from January 1985 to October 2014 were provided by Gansu Meteorological Administration. Precipitation anomaly percentage is an index that represents precipitation during a period is larger or smaller than climate mean precipitation for the same period, and can reflect drought caused by short of precipitation (Guo and Guan, 2007). The study used precipitation anomaly percentage to evaluate the ability of the index β in drought monitoring. Precipitation anomaly percentage is calculated by (Guo and Guan, 2007):
|
(7) |
where Pa is precipitation anomaly percentage, P is precipitation during a period, in unit of mm, P is climate mean precipitation for the same period, in unit of mm.
|
(8) |
where n is 1~30, i = 1, 2, …, n.
3.2 Drought Indices 3.2.1 Temperature Vegetation index (TVX)Drought changes surface hydro-thermal features by changing surface NDVI, albedo, temperature, etc. A combination use of these factors can accurately represent dry-wet conditions of surface. Some studies were devoted to investigating combining NDVI, albedo, and surface temperature to establish drought monitoring model. Among them, TVX is recognized as a relatively accurate index for drought monitoring (Qin et al., 2008). It is defined as the ratio of surface temperature to NDVI,
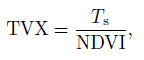
|
(9) |
where Ts is surface temperature in unit of ℃, obtained from in-situ observations, NDVI is obtained from remote sensing data processing.
Lack of water during vegetation growth will inhibit vegetation growth and cause vegetation index to reduce. Reduction in soil water content will cause surface and vegetation canopy temperature to rise. Thereby surface temperature and vegetation index can reflect soil water content indirectly. The TVX method is established based on such mechanism. When soil water is deficient, Ts is higher, NDVI is smaller, TVX is larger, indicating that drought is more serious; when soil water is sufficient, Ts is lower, NDVI is larger, TVX is smaller, indicating that drought is light or no drought exists. The advantage of TVX method is that it combines visible light, near infrared, and thermal infrared bands and more spectral information can retrieve more sufficient and clear surface information, leading to more accurate results. However, TVX is not only influenced by soil moisture, but also by soil physical parameters and vegetation physiological features which are not considered in the method. In addition, when NDVI tends to be infinitely small, such as bare soil, TVX tends to be infinitely large and cannot be suitable for drought monitoring.
3.2.2 Establishment of Bowen ratio index (β)Bowen ratio β can reflect surface hydro-thermal features synthetically and can be expressed as

|
(10) |
where H and LE are sensible and latent heat fluxes, in unit of W·m-2. β is dimensionless. Fig. 2 gives the flow chart of Bowen ratio derived by MODIS data, and the details were introduced in the following paragraphs.

|
Fig. 2 Technique flow chart of Bowen ratio inverted from MODIS |
Sensible heat flux represents heat transfer between surface and atmosphere in the form of turbulence, and is often expressed as one dimensional flux gradient (Zhao et al., 2013),
|
(11) |
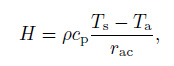
where ρ is air density, which is calculated by the equation mentioned in previous section; cp is specific heat capacity at constant pressure, with a value of 1004.67 J·kg-1·℃-1; ρcp is volumetric heat capacity of air; Ts and Ta are air temperature at surface and reference height (2 m) obtained from in-situ observations, in unit of ℃; rac is aerodynamic resistance which is related to near surface turbulence and represents resistance of sensible heat transfer between surface and reference height, in unit of s·m-1. At present, there are many empirical methods to calculate rac, this study used equations from Zhao et al.(2011),
|
(12) |
where z is reference height or effective height, 2 m; u is wind speed at reference height, in unit of m·s-1; z0 is aerodynamic roughness length and usually calculated by
|
(13) |
where h is the height of canopy, in unit of m. h can be calculated by LAI (Zhao et al., 2011),
|
(14) |
LAI is closely related to NDVI and can be computed by empirical equation (Zhao et al., 2011),
|
(15) |
where NDVI can be obtained by the method introduced in the data preprocessing.
Latent heat flux represents the heat used for water transfer between surface and atmosphere, including energy for soil evaporation and plants transpiration. Latent heat flux is usually calculated by residual method (Zhao, 2013), that is, calculated indirectly by energy balance principle. Surface net radiation is mainly partitioned into sensible heat used for raising air temperature, latent heat used for soil evaporation and plant transpiration, and soil heat flux used for raising soil temperature. In addition, a small part of net radiation is used for plant photosynthesis, which is a very small part and can be neglected. Hence, surface energy balance can be expressed as
|
(16) |
where Rn is surface net radiation, G is soil heat flux, in unit of W·m-2. Then, latent heat flux can be calculated by
|
(17) |
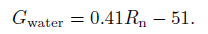
Such method has explicit physical meaning and can be easily realized. Because its high precision, this method is widely used (Zhao, 2013). From Eq.(17), we can see that the calculation of latent heat flux LE needs sensible heat flux H, net radiation Rn, and soil heat flux G.
Surface net radiation is the sum of net shortwave and net longwave radiations, that is, the difference of surface energy budget. According to surface net radiation balance equation, surface net radiation Rn is expressed as (Zhao, 2013)
|
(18) |
where Ts and Ta are in unit of K, and are obtained from in-situ observations; σ is Stefan-Boltzmann constant, with a value of 5.67×10⁻⁸ W·m-2·K-4; Q is solar total radiation, in unit of W·m-2, and can be calculated by Eq.(19)(Li and Zhao, 2006),
|
(19) |
where S is solar constant usually being 1353 W·m-2, ω is solar altitude, α is broadband albedo, these variables can be obtained by the methods introduced in the data preprocessing; εa is air emissivity, εs is surface emissivity, εa can be calculated by the equation given by de Rooy and Holtslag (1999),
|
(20) |
where ea is air actual vapor pressure at temperature Ta, and can be calculated by the method introduced in the data preprocessing. εs can be calculated by vegetation cover f,
|
(21) |
For water body, εs = 0.995. f and NDVI can be calculated according to Gutman and Ignatov's method (1998),
|
(22) |
where NDVImin, NDVImax, NDVI are vegetation index for bare soil, vegetated surface, and mixed surface, respectively. NDVImin=0.099, NDVImax=0.77. When NDVI≤ 0.099, vegetation cover f = 0, when NDVI≥ 0.77, vegetation cover f = 1.
Soil heat flux is heat transfer inside soil, that is, the heat from surface to deep soil or from deep soil to surface. Soil heat flux is usually obtained by its empirical relationship with net radiation. This study used empirical equation proposed by Bastiaanssen et al.(1998),

|
(23) |
where Ts is in unit of K. For water body pixel, soil heat flux is calculated by (Burba et al., 1999),
|
(24) |
From the calculation process of β, it is seen that β index also combines visible, near infrared, and thermal infrared bands of remote sensing data, which takes advantage of sufficient spectral information no less than TVX method.
4 RESULTS 4.1 Validation of Retrieved ResultsBefore Bowen ratio is used for drought monitoring, the accuracy of Bowen ratio needs to be validated. The ground observed H and LE were used to calculate β and compare with that retrieved from satellite data at Dingxi, Pingliang, and Qingyang sites. Fig. 3 gives the scatter plot of retrieved and ground observed β(Because all of the 15 tiles of MODIS images over Dingxi, Pingliang, and Qingyang sites are clear sky and ground observation did not have any missing data, the samples of the three sites are 15). It is seen that the retrieved and observed β are well correlated, with determination coefficients (R2) of 0.7358, 0.7877, and 0.7593(all passed 0.01 significance test), and fitting coefficients of 0.8317, 0.8268, and 0.8866(close to 1:1 line) at Dingxi, Pingliang, and Qingyang, respectively. For the reason that the spatial resolution of MODIS data is 1000 m, the mismatch between MODIS data and ground observations is the main cause of difference between MODIS retrieved and ground observed β. In addition, Bowen ratio method has some shortcomings. Overall, MODIS retrieved Bowen ratio can mainly reflect the real status of surface Bowen ratio and is demonstrated to be reliable.

|
Fig. 3 Correlation of observed β and β inversed by MODIS (Dingxi, Pingliang and Qingyang) |
Because drought is directly correlated to soil moisture, the correlation between Bowen ratio and soil water content was the first step to see the performance of Bowen ratio method reflecting the wet-dry condition in the study region. The degree of the performance is compared to TVX method, which is recognized as a relatively good method in drought monitoring. Usually, soil water content in the layer of 0~20 cm is the most important in agricultural drought monitoring and observations often monitor soil wetness of this layer. Remote sensing can also reflect soil moisture of shallow layer to some extent. In this study, correlation analysis was made between relative soil water moisture and β, and TVX. It is worth noting that because relative soil moisture is only observed at height of 10 cm and 20 cm depths, mean relative soil moisture at layer 0~20 cm was averaged by relative soil moisture at the depth of 10 cm and 20 cm. To avoid confusion, it is called relative soil moisture in the following text. The selected 8 tiles of MODIS images over the sites with automatic soil moisture observations were almost clear-sky. Only the data of a few sites of instrument malfunction or cloud contamination were deleted. 9 sites were deleted on April 7, 41 sites remained; 3 sites were deleted on May 11, 47 sites remained; 1 site was deleted on May 26, 49 sites remained; 1 site was deleted on July 16, 49 sites remained; 4 sites were deleted on July 24, 46 sites remained; 1 site was deleted on July 29, 49 sites remained; 1 site was deleted on October 5, 49 sites remained; 4 sites were deleted on October 23, 46 sites remained. β and TVX were calculated by Eqs.(9)-(24) and the corresponding values at the sites with automatic soil moisture observation were fetched by longitude and latitude of each site.
Figure 4 shows the scatter plot of relative soil moisture versus β and TVX. It is seen that β is well negatively correlated to relative soil moisture, with R2 of 0.5449, 0.3360, 0.4092, 0.3231, 0.6797, 0.4552, 0.7595, and 0.4036(all passed 0.01 significance test), respectively. In contrast, although TVX is also negatively correlated to relative soil moisture, the correlation between TVX and relative soil moisture was much weaker, with R2 of 0.2478, 0.2055, 0.2029, 0.1796, 0.5079, 0.1921, 0.4581, and 0.2337(all passed 0.01 significance test), respectively. As discussed in the Section 3.2.1, except soil moisture, there are many other factors affecting TVX, although TVX combines visual-infrared and thermal infrared and can capture more spectral information, this will also disturb the relationship between soil moisture and TVX (Qin et al., 2008). Because Bowen ratio (β) index considers both energy and moisture which are the prerequisite of drought, it is theoretically more reasonable and comprehensive, its monitoring accuracy is apparently greater than that of TVX, especially on April 7 and October 5, 2014, the R2 of β being 0.3 greater than the R2 of TVX. Obviously, visible-infrared and thermal infrared bands utilized in β index play a positive role in drought monitoring.

|
Fig. 4 Correlation of 0~20 cm soil relative humidity with β and TVX (7 April 2014, 11 May 2014, 26 May 2014, 16 July 2014, 24 July 2014, 29 July 2014, 5 October 2014 and 23 October 2014) |
Of course, although β and TVX were significantly correlated to relative soil moisture, the R2 of them were not as high as expected regarding to drought monitoring, especially on May 11 and July 16, 2014. The reasons for this result may be that, (1) there exist systematic errors in the relative soil moisture obtained by the automatic soil moisture sites, (2) the spatial resolution of MODIS image is 1000 m, there exists mismatch between scale of MODIS pixel and ground observations, (3) there exists atmospheric disturbance. For the errors in the β index, there are two more reasons:(1) when ground meteorological data were spatially interpolated, the interpolated data had error, (2) during the process of retrieving Bowen ratio, some variables were calculated by empirical methods, this will also cause error. Nevertheless, the correlation of β and relative soil moisture is much larger than that of TVX and relative soil moisture, indicating that β index is more superior.
4.3 Application of β Index to Drought Monitoring-A Case Study over Hedong Region on October 5Above analysis demonstrates that Bowen ratio (β) monitoring method is efficient at large scales and can be used for surface drought monitoring. The clear sky images over study region on October 5, 2014 were selected to calculate β index and analyze spatial distribution of drought.
Figure 5a shows that high values of β index are mainly situated at the northwest of study region and some high values are situated at the southeast of study region. Generally, β index shows a high-low-high pattern from northwest to southeast, reflecting a strong-light-strong pattern of drought. Because the study region is a rain-fed agricultural region, precipitation can be used to validate the performance of drought monitoring using β index. Fig. 6 gives spatial distribution of accumulative precipitation from a month before October 5, 2014 over the study region (spatially interpolated from 61 sites). Precipitation shows a small-large-small pattern from northwest to southeast. This indicates that the distribution of droughts is coherent with the distribution of regional precipitation. There still exist some points where drought and precipitation are mismatched, which may be related to that spatial distribution of precipitation is interpolated from site observations. Furthermore, we fetched the β index at 61 sites and analyzed their correlation with local precipitation. Fig. 7 shows that β is well correlated to local precipitation, with correlation coefficient (R) up to 0.754(passed 0.01 significance test). The correlation coefficient is not that large, this is related not only to errors within retrieving β index, but also to the fact that accumulated precipitation can hardly accurately reflect drought because accumulated precipitation is affected by timing and magnitude. Overall, the performance of drought monitoring by β index was validated satisfactorily by the precipitation test.

|
Fig. 5 Distribution of Bowen ratio (β) and dry-wet conditions over study region on October 5, 2014 |

|
Fig. 6 Distribution of rainfall over study region in September 2014 |

|
Fig. 7 Relationship of β on October 5, 2014 against monthly precipitation of September 2014 over study region |
Since our ultimate goal is to evaluate the degree of drought in the study region, we need to establish drought classification of β after β is calculated. According to "The national standard of drought warning levels of the Peoples' Republic of China", when relative soil moisture of 0~20 cm layer is larger than 60%, soil moisture is relatively wet and most suitable for crop growth, this level of relative soil moisture is defined as no drought; when relative soil moisture of 0~20 cm layer is within the range of 50%~60%, soil water can maintain crop growth but not sufficient, this level of relative soil moisture is defined as light drought; when relative soil moisture of 0~20 cm layer is within the range of 40%~50%, drought is getting worse, this level is defined as moderate drought; when relative soil moisture of 0~20 cm layer is less than 40%, soil suffers serious water shortage and can seriously affect crop growth, this level is defined as severe drought. On the basis of fitting relationship between β and relative soil moisture of 0~20 cm layer on October 5, 2014 in Fig. 4, the levels of β can be calculated by relative soil moisture: when relative soil moisture of 0~20 cm is 60%, β is about 2.5; when relative soil moisture of 0~20 cm is 50%, β is about 6; when relative soil moisture of 0~20 cm is 40%, β is about 19. Thereby we obtained thresholds of no drought, light drought, moderate drought, and severe drought, and these levels of β values can be used to evaluate distribution of dry-wet conditions over study regions. According to classification of β, Fig. 5b gives distribution of drought on October 5, 2014 over study region. It is seen that there are light drought and small part of moderate drought in the north of Baiyin. North Lanzhou and northwest Gannan have small part of light drought. Overall, the dry-wet condition of most of the study region is appropriate. To assess whether the results are reasonable, Fig. 8 gives the distribution of precipitation anomaly percentage in September 2014 at study sites. It is seen that precipitation is large at most sites, the sites where precipitation is 80% larger than climate mean account for 60% of total sites. Only 5 sites of 61 sites have precipitation a little less than climate mean. Thus the results from the classification of β index is coherent with the results of precipitation anomaly percentage, indicating that the classification of β index is reasonable and the application of Bowen ratio (β) method to drought monitoring is feasible.

|
Fig. 8 Precipitation anomaly percentage of each site in study region in September 2014 |
On the basis of surface energy balance principle, a new drought monitoring method-Bowen ratio (β), was established using MODIS remote sensing data and applied to drought monitoring over Gansu Hedong region. Selecting 8 tiles of clear-sky MODIS images representing typical data in spring, summer, autumn, we concluded that β is highly negatively correlated to relative soil moisture, with determination coefficients of 8 tiles up to 0.5449, 0.3360, 0.4092, 0.3231, 0.6797, 0.4552, 0.7595, and 0.4036, respectively. Relative to TVX method, which is recognized as a good drought monitoring method and widely used, β has a higher correlation with relative soil moisture of 0~20 cm layer and the monitoring accuracy is significantly improved. Further, we chose clear-sky images on October 5, 2014 over study region and established classification standard of drought degree according to the levels of β values and assessed drought distribution over study region. It is found that soil drywet distribution is well coherent with distribution of precipitation anomaly percentage. The assessment shows that most of study region had appropriate dry-wet condition and is attributed to that precipitation anomaly percentage is relatively large in September 2014. Thus, Bowen ratio based on MODIS data can well applied to drought monitoring. In future, remote sensing data from other satellites should be applied to this method and some of parameter calculation methods should be optimized to further improve the precision of this method.
This paper is the first to introduce Bowen ratio, which reflects surface dry-wet conditions, to remote sensing drought monitoring. With the need for increasing drought monitoring precision, this method is an innovation. Although Bowen ratio method for drought monitoring has robust scientific theory and improves drought monitoring compared to commonly used methods, the correlation between β and relative soil moisture is not universal and different in different time and regions due to that some parameters during the retrieving process of β, like temperature and albedo, have apparent seasonality and volatility. This causes that the classification standard of β is dynamic and monitoring results lack temporal and spatial comparability. In this study, the scatter plot of β and relative soil moisture on October 5, 2014(Fig. 4) is different from other days. Thus, further study should focus on each region of China and accumulate long term remote sensing data for comparative analysis and develop uniform drought monitoring standard. Besides, because the retrieving process of β is complex and need remote sensing data and ground meteorological data, this will reduce the efficiency of conventional drought monitoring operation. To meet the requirement of real time drought monitoring operation, perfect meteorological data sharing service and remote sensing datasets should be established.
ACKNOWLEDGMENTSThis work was jointly supported by Scientific Research Found of Arid Meteorology (IAM201413) and the Major National Basic Research Program of China (973 program)(2013CB430206).
| [] | Bao P Y. 2007. Estimation of the day evapotranspiration in semiarid area using remote sensing[Master's thesis] (in Chinese). Nanjing:Hohai University. |
| [] | Bastiaanssen W G M, Pelgrum H, Wang J, et al. 1998. A remote sensing surface energy balance algorithm for land(SEBAL):Part 2:Validation. Journal of Hydrology , 212-213 : 213-229. DOI:10.1016/S0022-1694(98)00254-6 |
| [] | Burba G G, Verma S B, Kim J. 1999. Surface energy fluxes of Phragmites Australis in a prairie wetland. Agricultural and Forest Meteorology , 94 (1) : 31-51. DOI:10.1016/S0168-1923(99)00007-6 |
| [] | Chen W Y, Xiao Q G, Sheng Y W. 1994. Application of the anomaly vegetation index to monitoring heavy drought in 1992. Remote Sensing of Environment China , 9 (2) : 106-112. |
| [] | de Rooy W C, Holtslag A A M. 1999. Estimation of surface radiation and energy flux densities from single-level weather data. Journal of Applied Meteorology , 38 (5) : 526-540. DOI:10.1175/1520-0450(1999)038<0526:EOSRAE>2.0.CO;2 |
| [] | Feng Q, Tian G L, Wang A S, et al. 2004. Experimental study on drought monitoring by remote sensing in China by using vegetation condition indexes (I)-Data analysis and processing. Arid Land Geography , 27 (2) : 131-136. |
| [] | Gao Y H, Chen Y C, Lü S H. 2002. Role of irrigation in maintenance and development of modern oasis. Journal of Desert Research (in Chinese) , 22 (4) : 383-386. |
| [] | Ghulam A, Qin Q M, Zhan Z M. 2007. Designing of the perpendicular drought index. Environmental Geology , 52 (6) : 1045-1052. DOI:10.1007/s00254-006-0544-2 |
| [] | Gu Y X, Brown J F, Verdin J P, et al. 2007. A five-year analysis of MODIS NDVI and NDWI for grassland drought assessment over the central Great Plains of the United States. Geophysical Research Letters , 34 : L06407. |
| [] | Guo N, Guan X D. 2007. An improvement of the vegetation condition index with applications to the drought monitoring in northwest China. Advances in Earth Science (in Chinese) , 22 (11) : 1160-1168. |
| [] | Gutman G, Ignatov A. 1998. The derivation of the green vegetation fraction from NOAA/AVHRR data for use in numerical weather prediction models. International Journal of Remote Sensing , 19 (8) : 1533-1543. DOI:10.1080/014311698215333 |
| [] | Idso S B, Jackson R D, Pinter P J Jr, et al. 1981. Normalizing the stress-degree-day parameter for environmental variability. Agricultural Meteorology , 24 : 45-55. DOI:10.1016/0002-1571(81)90032-7 |
| [] | Kogan F N. 1990. Remote sensing of weather impacts on vegetation in non-homogeneous areas. International Journal of Remote Sensing , 11 (8) : 1405-1419. DOI:10.1080/01431169008955102 |
| [] | Kogan F N. 1995. Application of vegetation index and brightness temperature for drought detection. Advances in Space Research , 15 (11) : 91-100. DOI:10.1016/0273-1177(95)00079-T |
| [] | Li S B, Zhao C Y. 2006. Estimating evapotranspiration based on energy balance in Guanchuan river basin using remote sensing. Remote Sensing Technology and Application (in Chinese) , 21 (6) : 521-526. |
| [] | Li Z, Tan D B, Qin Q M, et al. 2010. Recent advance of remote sensing drought monitoring approaches based on spectral feature space. Journal of Yangtze River Scientific Research Institute (in Chinese) , 27 (1) : 37-41. |
| [] | Liang S L. 2001. Narrowband to broadband conversions of land surface albedo I:algorithms. Remote Sensing of Environment , 76 (2) : 213-238. DOI:10.1016/S0034-4257(00)00205-4 |
| [] | Liu H, Liu R G, Liu S Y. 2012. Review of drought monitoring by remote sensing. Journal of Geo-Information Science(in Chinese) , 14 (2) : 232-239. DOI:10.3724/SP.J.1047.2012.00232 |
| [] | Mo X G, Liu S X. 1997. Characteristics of energy partitioning and water transfer in winter wheat field. Acta Geographica Sinica (in Chinese) , 52 (1) : 37-44. |
| [] | Moran M S, Clarke T R, Inoue Y, et al. 1994. Estimating crop water deficit using the relation between surface-air temperature and spectral vegetation index. Remote Sensing of Environment , 49 (3) : 246-263. DOI:10.1016/0034-4257(94)90020-5 |
| [] | Prihodko L, Goward S N. 1997. Estimation of air temperature from remotely sensed surface observations. Remote Sensing of Environment , 60 (3) : 335-346. DOI:10.1016/S0034-4257(96)00216-7 |
| [] | Qin Q M, Ghulam A, Zhu L, et al. 2008. Evaluation of MODIS derived perpendicular drought index for estimation of surface dryness over northwestern China. International Journal of Remote Sensing , 29 (7) : 1983-1995. DOI:10.1080/01431160701355264 |
| [] | Rouse J W, Haas R W, Schell J A, et al. 1974. Monitoring the vernal advancement and retrogradation (green wave effect) of natural vegetation. NASA/GSFC Type Ⅲ Final Rep., Greenbelt, Md. , 371 . |
| [] | Sandholt Z, Rasmussen K, Andersen J. 2002. A simple interpretation of the surface temperature/vegetation index space for assessment of surface moisture status. Remote Sensing of Environment , 79 (2-3) : 213-224. DOI:10.1016/S0034-4257(01)00274-7 |
| [] | Sheng P X, Mao J T, Li J G, et al. 2003. Atmospheric Physics (in Chinese)[M]. Beijing: Peking University Press: 18 -22. |
| [] | Tu G, Liu H Z, Dong W J. 2009. Characteristics of the surface turbulent fluxes over degraded grassland and cropland in the semi-arid area. Chinese Journal of Atmospheric Sciences (in Chinese) , 33 (4) : 719-725. |
| [] | Wang H, Hu Z Y, Ma W Q, et al. 2008. The seasonal variation of microclimate characteristics and energy transfer in the surface layer over Dingxin Gobi. Chinese Journal of Atmospheric Sciences (in Chinese) , 32 (6) : 1458-1470. |
| [] | Wang P X, Gong J Y, Li X W. 2001. Vegetation-temperature condition index and its application for drought monitoring. Geomatics and Information Science of Wuhan University , 26 (5) : 412-418. |
| [] | Wang Y, Wang R Y, Zhang K, et al. 2009. Review of arid climate disaster in Gansu province. Journal of Catastrophology(in Chinese) , 24 (1) : 117-121. |
| [] | Xia L, Zhang Q. 2014. Plateau surface energy balance components and interannual variability in response to climate fluctuations. Acta Physica Sinica (in Chinese) , 63 (11) : 119201. |
| [] | Yi Y H. 2008. Vegetation parameter and evaporation estimation based on remote sensing for assessing regional drought[Ph. D. thesis] (in Chinese). Beijing:Tsinghua University. |
| [] | Zeng J. 2011. The characteristics and parameterization of land surface processes and its relationship with climate over northern China[Master's thesis] (in Chinese). Beijing:Chinese Academy of Meteorological Sciences. |
| [] | Zhang Q, Cao X Y. 2003. The influence of synoptic conditions on the averaged surface heat and radiation budget energy over desert or Gobi. Chinese Journal of Atmospheric Sciences (in Chinese) , 27 (2) : 245-254. |
| [] | Zhang X D, Mi X D, Xin J W, et al. 2009. Analysis of the agriculture index temperature based on DEM-A case study in Hedong region of Gansu province. Journal of Glaciology and Geocryology (in Chinese) , 31 (5) : 880-884. |
| [] | Zhao J, Liu C Y, Pan J H, et al. 2011. Spatial and temporal distributions of evapotranspiration in Gannan grassland based on MODIS data. Resources Science (in Chinese) , 33 (2) : 341-346. |
| [] | Zhao Y S. 2013. Analysis Principle and Method of Remote Sensing Application. 2nd ed. (in Chinese)[M]. Beijing: Science Press . |