 2016, Vol. 59


2 University of Chinese Academy of Sciences, Beijing 100049, China
As an important approach in the study of oceanic crust-mantle structure and structural features, the Ocean Bottom Seismometer (OBS) wide-angle seismic survey plays a vital role in the continental margins (Czuba et al., 2004; Ito et al., 2009; Lester et al., 2014; Mjelde et al., 2008) and mid-oceanic ridges (Bohnhoff and Makris, 2004; Minshull et al., 2006; Zhao et al., 2013). At present, primary refraction and reflection phases are mainly used to study oceanic crust-mantle structure in OBS wide-angle seismic survey, but multiple waves with strong amplitude, continuous phases and farther distance of propagation can be always found on the profile of OBS record. However, there are no sufficient cognition and application for such multiple waves (Jin and Wang, 2012; Osen et al., 1999; Wang et al., 2012; Weglein, 1999). Actually, the application of multiple waves is an important content of ocean survey, and eliminating or utilizing multiple wave is one of discussion topics for improving the capacity of oceanic seismic survey.
The multiples are generated by the same source as primaries, which have different propagation paths (Dash et al., 2009). Therefore, multiple wave phases are also related to actual crustal structure, and include some structure information which the primary wave phases fail to have under a certain situation (Berkhout and Verschuur, 2006; Verschuur and Berkhout, 2011). Previous studies have been gradually aware of the importance of multiples (Dash et al., 2009; Xia et al., 2010; Yang and Guo, 2012). If those multiple phases can be sufficiently used, some disadvantages such as large OBS position spacing and small quantity of primary wave will be overcome, and it’s helpful for improving imaging precision of crustal structure. Meléndez (2014) discussed the cause of multiple wave by numerical modeling and suggested that the multiple signal is stronger than that of primary wave, whose traceable offset of phases is larger than that of primary wave. Yang and Guo (2012) confirmed that multiple wave is characterized by reflection followed by refraction based on the research of multiple reflection and refraction wave of land seismic survey. Wang et al. (2012) effectively improved the imaging range of shallow subsurface using OBS multiple wave data in South China Sea. Grad (2012) carried out more accurate division for water-body velocity at different layers in North Atlantic Ocean based on the multiple of direct water wave. Berkhout and Verschuur (2006) transformed multiple wave into primary wave to improve the imaging precision of crustal structure. Brown and Guitton (2005) put forward a method of joint imaging of primary and multiple waves that improve the quality of reproduction of signals by combining information of primary and multiple waves. These researches have driven the application of multiple wave in seismic imaging. However, there is no detailed analysis on the features of multiple wave from OBS wide-angle seismic profile and no practical application in crustal imaging. Therefore, for the purpose of covering above-mentioned shortages and systematically recognize and fully exploit multiple wave information on OBS wide-angle seismic profile, this paper selects three OBS wide-angle seismic lines in the Taiwan shoal waters of northeastern SCS, Pearl River Mouth Basin of northern SCS and northwestern Sub-Basin (Fig. 1). We carry out systematic analysis and study for secondary Pg phases on the above three OBS lines, calculate the travel path of secondary Pg phase, and comparatively analyze the waveform and particle movement track of primary Pg and secondary Pg phases. Furthermore, a contrastive analysis of utlizing the secondary Pg phase on restraining sedimentary depth and improving crustal imaging precision is carried out based on the imaging results.

|
Fig. 1 Map showing distribution of seismic survey lines and OBS stations Solid black circles represent OBS data used in this paper. |
Xia (2009), Xia et al. (2010) suggested that the group of phases almost paralleling to and closely following the Pg phases are multiple-reflection Pg phases. The recorded sections were filtered from 3 Hz to 15 Hz through a classical band-pass Butterworth filter to enhance the signal-to-noise (S/N) ratios of some weak seismic phases. The multiple Pg phases are present pervasively, especially secondary Pg phases being the most noticeable (Fig. 2). Here, we mainly analyze the typical secondary Pg phases. Generally, the energy of multiples quickly attenuate in the process of propagation due to the reflections between layers (Červený, 1966), but in the OBS seismic profile (Fig. 2a) and recorded seismic waveform (Fig. 3), the secondary Pg phases are continuous and clear and have prominent amplitudes. Those amplitudes are equal to or even stronger than that of primary Pg phases. Xia (2009) speculated that this phenomenon results from the reflection of secondary Pg phases mainly occurred on the interface with large velocity jump. As shown in Fig. 2, the secondary Pg phases are very clear and basically consistent with the tendency of primary Pg phases and the apparent velocities are slightly smaller than primary Pg phases. It is noteworthy that primary Pg phases disappear in the case of offset being 45 km, whereas secondary Pg phases can be traced to about 55 km (Fig. 2a). That is, the traceable offset of secondary Pg phases is further than primary Pg phases.

|
Fig. 2 Seismic record section of OBS with reduced velocity of 6 km·s−1 (a) 10th station of survey line 2012; (b) 11th station of survey line 2006. |

|
Fig. 3 Recorded seismic waveforms and picked up primary Pg and secondary Pg along seismic profile OBS2012. (a) Station OBS09; (b) Station OBS10 |
To further study the feature of secondary Pg phases, the OBS seismic waveform and clear first arrivaltime of primary Pg and secondary Pg phases were picked. Fig. 3 presents the OBS waveform data and the first arrival-time positions of primary Pg and secondary Pg phases of OBS09 and OBS10 along the OBS2012 profile. In the process of recognizing these two phases from seismic waveform, we jointly make use of the time and offset of shot points and reduction travel times (reduction velocity 6 km·s−1 in this paper) to calculate the theoretically predicted travel times. Then, their corresponding locations were marked on the OBS seismic waveform. It can be found from Fig. 3 that the maximum amplitude value of secondary Pg phase is obviously larger than primary Pg phases. The secondary Pg phases have an arrival-time lag of 1.5~2.5 s compared with Pg phases. This phenomenon is identical to that observed from seismic profile (Fig. 2a).
In addition, by rotating the azimuth angle recorded by OBS09 and OBS10 along OBS2012 profile, the particle motions of primary Pg and secondary Pg phases were plotted and a contrastive analysis was made. The particle motions of both phases are similar, showing the feature of P-wave (Fig. 4). This indicates that the secondary Pg phases don’t generate significant P-to S-wave transition and the travel time lags are not caused by the slow S-wave (Amundsen et al., 1995; Zhao et al., 2008). It is noteworthy that the amplitude of secondary Pg phases (Figs. 4(a2, b2)) is almost equivalent to the primary Pg phases (Figs. 4(a1, b1)) or even bigger in the vertical component. Different particle motions are recorded by different stations, for example, the energy of these two phases recorded by OBS09 (Fig. 4a) is bigger than that recorded by OBS10 (Fig. 4b) in each component. We infer that it is resulted from different environment noise or the difference of lower crustal structure.

|
Fig. 4 Particle motion traces of primary Pg and secondary Pg phase recorded by OBS09 and OBS10 seismic stations along profile OBS2012 |
In the OBS wide-angle seismic survey, the secondary Pg phases are firstly reflected once between layers then refracted through the upper crust to arrive at the receiver. A theoretical velocity model (Fig. 5) was established and the method of RAYINVR ray tracing (Zelt and Smith, 1992) was used to simulate the ray path of secondary Pg phases to confirm the reflective layer. Set the depth of water near 200 km offset of theoretical model to be 1.5 km with the velocity of 1.5 km·s−1; the sediment thickness is 3 km, and the velocity is 3 km·s−1. The simulation results present three different kinds of propagation paths due to the difference of reflective layer: (a) the reflective layer is only the water layer when the reflection takes free interface and seafloor as boundaries (Fig. 5a); (b) the reflective layer is the water and sediment when the reflection takes free interface and basement as boundaries (Fig. 5b); (c) the reflective layer is only the sediment when the reflection takes seafloor and basement as boundaries (Fig. 5c). The primary Pg and secondary Pg phases have a roughly similar tendency in the OBS sections, and the difference of travel times mainly relies on reflective layer thickness (Fig. 5). Comparing to the difference of travel times of primary Pg and secondary Pg phases in Figs. 5a, 5b and 5c, the difference of reflective layer is responsible for the different travel time lags of secondary Pg phases.

|
Fig. 5 Ray-tracing and calculated travel time of primary Pg and secondary Pg phases with reduced velocity of 6 km·s−1 |
Xia (2009) took the sediment as the reflective layer according to apparent velocities and amplitude feature of secondary Pg phases but it is just a qualitative analysis. Instead, we choose OBS09 data along OBS2012 profile in Taiwan shoal in the northeastern SCS for calculation and make analysis to further confirm the actual propagation path of secondary Pg phases. The results of travel time fitting of primary Pg phases and three possible propagation paths of secondary Pg phases are shown in Fig. 6. A 50 ms picking error was applied to Pg phases and a 80 ms picking error was set for secondary Pg phases according to the S/N ration. The primary Pg and secondary Pg phases recorded by OBS09 are relatively clear and the depth of water and the thickness of sediment have distinct change, which yield obvious travel time differences among these three different theoretical ray paths.

|
Fig. 6 Primary Pg phases’ and secondary Pg phases’ ray-tracing and traveltime fits of OBS09 station along seismic profile OBS2012 with reduced velocity of 6 km·s−1 |
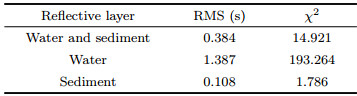
The fitting results of OBS09 data in Fig. 6 reveal that (a) when the reflective layer is water and sediment, the calculated travel time of secondary Pg phases is much bigger than observed travel time (Fig. 6b). Especially, the calculated travel time of secondary Pg phases gradually deviates from observed travel time within the offset 35~50 km due to the increasing of water depth. Root-mean-square (RMS) value of travel time fitting is 0.384 s, and χ2 value is 14.921; (b) when the reflective layer of secondary Pg phases is the single water layer, the calculated travel time is much less than observed travel time (Fig. 6c). The travel time of secondary Pg phases is almost equal to that of primary Pg phases within the offset 15~30 km because the water is so shallow ( < 100 m) that the travel time of secondary Pg phases mainly depend on the sediment. RMS value is 0.387 s, and χ2 value is 193.264; (c) when the reflective layer is the sediment only, the calculated travel time of secondary Pg phases is well consistent with observed travel time (Fig. 6d). RMS value is 0.108 s and χ2 value is 1.786 (for details, see Table 1).
|
|
Table 1 RMS misfits and normalized χ2 of secondary Pg phases for different reflective layers |
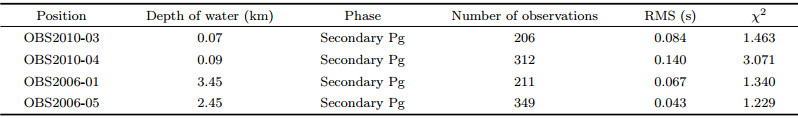
Four OBS data (OBS03, OBS04, OBS01 and OBS05 in Fig. 1) with relatively good quality along OBS2010 profile (Cao et al., 2014) and OBS2006 profile (Ao et al., 2012) were utilized to confirm the reliability of result obtained from OBS09. The sediment as the reflective layer also explains the behaviours of the travel time fitting of secondary Pg phases (Figs. 7, 8, 9 and 10). At the left portion of OBS03 section, the travel time difference of secondary Pg phases and primary Pg phases is small due to the thin sediment so that these two phases interfere with each other. Thus, the identification of secondary Pg phases is difficult and we do not give a travel time fitting. In addition to this, the primary Pg and secondary Pg phases of other stations are recognizable and clear. Here, the fitting results of primary Pg phases were obtained by previous reserchers. This study mainly calculated the travel time fitting of secondary Pg phases based on the previous velocity models. The final results of four OBS data are given in Table 2. OBS04 has a big χ2 value (3.071) due to the relatively bad data quality of secondary Pg phases in the left portion, whereas the χ2 value of other three OBS stations (OBS03, OBS01 and OBS05) are close to the standard value 1.0 showing that the fitting results are good. The secondary Pg phases come from the reflection of sediment, which is verified by travel time fitting results of these four OBSs. What can be observed is that fittings of observed travel time and calculated travel time of Pg and secondary Pg phases are appropriate regardless of the shallow ( < 100 m) or abyssal (>2000 m) regions or different crustal structures beneath OBS2010 and OBS2006 profiles (Figs. 7, 8, 9 and 10). These indicate that the inference of secondary Pg phases mainly coming from sedimentary reflection is universally applicable in OBS wide-angle seismic survey.

|
Fig. 7 Calculation model, ray-tracing (a) and traveltime fits (b) of OBS03 along the OBS2010 seismic profile. Descriptions are same as Fig. 6. (c) Model position of (a). Red box is enlarged in Fig. 7a |

|
Fig. 8 The calculation model, ray-tracing (a) and traveltime fits (b) of OBS04 along the OBS2010 seismic profile. Descriptions are same with Fig. 6. (c) Model position of (a), Red box is enlarged in Fig. 8a |

|
Fig. 9 The calculation model, ray-tracing (a) and traveltime fits (b) of OBS01 along the OBS2006 seismic profile. Descriptions are same as Fig. 6. (c) Model position of (a), Red box is enlarged in Fig. 9a |

|
Fig. 10 The calculation model, ray-tracing (a) and traveltime fits (b) of OBS05 along the OBS2006 seismic profile. Descriptions are same as Fig. 6. (c) Model position of (a), Red box is enlarged in Fig. 10a |
|
|
Table 2 Number of traveltimes, RMS misfit between calculated and picked travel times, and normalized χ2 for secondary Pg phases |
The sediment refractive phases (Ps) are relatively obvious in plenty of OBS wide-angle seismic profiles, but the identification of the sediment reflective phases (PsP) is difficult. And it’s also difficult to recognize the Ps phases in case the sediment is thin. Thus, first-arrival forward modeling cannot properly resolve the sediment layer. However, the particularity of propagation path of secondary Pg phases provides a new method for constraining the sediment interfaces. Especially, in the case of lacking multichannel seismic, the reflection of secondary Pg phases is an effective approach to control the sediment interfaces. A theoretical model was established to prove the constraint of secondary Pg phases on the sediment interfaces by virtue of RAYINVR. Set the model length to be 100 km, OBS interval to be 20 km, shot interval to be 200 m, and traceable offset of Pg phases and secondary Pg phases to be 20 km. In Fig. 11, the morphology of sediment bottom interface, the inversion result from Pg phases data and the inversion result from secondary Pg phases data are shown in panel a, b and c, respectively. Restoration errors of these two groups of data are given in Fig. 11d. We find that the interface depth errors based on secondary Pg phases data are basically from –0.1 to +0.1, while the errors based on Pg phases data are larger. These results indicate that sediment interfaces constrained by Pg phases are unreliable, whereas secondary Pg phases exert a good effect on controlling the sediment interfaces. Fig. 12b shows the constraint on the sediment utilizing secondary Pg phases of OBS01 data.

|
Fig. 11 Reconstructed interface depths of sedimentary strata from inversion |

|
Fig. 12 (a) Schematic diagram of secondary Pg phase’s propagation path; (b) Secondary Pg phase ray-tracing and traveltime fits of OBS2010-01 station |
|
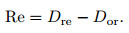
(1) |
In the formula, Re refers to restoration errors, Dor refers to initial interface node depth and Dre refers to interface node depth after restoration.
To analyze the difference of crustal imaging resolution (especially imaging resolution for the sediment) before and after adding secondary Pg phases data, we use the model same as Fig. 11 and set the offset of primary Pg phases to be from 20 km to 40 km. The total of primary Pg phases is 1100 and the quantity of secondary Pg phases is 70% and 100% of primary Pg phases. The model has only the sediment and upper crust with the velocity 3 km·s−1 and 6 km·s−1, respectively. The checkerboard test (Zhao et al., 1992) was used to analyze the differences of crustal imaging precision based on three groups of data. The first group only includes the travel time data of Pg phases; secondary Pg phases of 70% of Pg phases are added to the second group data, and the third group includes secondary Pg phases of the same quantity of Pg phases. The cell size is 10 km horizontally and the velocity node has Fig. 11 Reconstructed interface depths of sedimentary strata from inversion (a) Initial model; (b) Inversion result using Pg phase data; (c) Inversion result using secondary Pg phase data; (d) Distribution of inversion errors. Green solid circles show recovery error of node depth of secondary Pg phases, red show recovery error of node depth of Pg phases. maximum perturbations (±0.5 km·s−1) (Fig. 13a). Imaging results (Figs. 13b, 13c and 13d) show that the recovery capabilities of velocity perturbations have significant differences among these three groups of data. The imaging resolution is poor in the ends of model due to the weak ray coverage, while the other portion of model has a much better imaging resolution (Figs. 13c and 13d) after adding secondary Pg phases than the imaging resolution of models (Fig. 13b) only using Pg phases. Especially, it brings a prominent improvement in the sediment imaging precision. Restoration deviation was introduced to compare the differences.

|
Fig. 13 Checkerboard test results of resolution of the model |
|
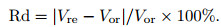
(2) |
In the formula, Rd is restoration deviation, Vre refers to node velocity after restoration and Vor refers to node velocity before restoration. The result shows that the deviations of node velocity after adding secondary Pg phases are less than that before adding secondary Pg phases (Fig. 13).
Taking OBS2010 profile in the northern SCS (Fig. 1) as an example, we tested the imaging resolution of crustal structure using the actual OBS data, which contain a total of 2433 phases (including primary Pg and PmP phases) and 1849 secondary Pg phases. Set transverse size of each gridding point to be 10 km and velocity node maximum perturbations to be±0.3 km·s−1 (Fig. 14a). The imaging result, which is similar to the result of theoretical model (Fig. 14), shows that the imaging resolution of sediment is significantly improved after adding secondary Pg phases (Fig. 14c) when compared to the imaging resolution without adding secondary Pg phases (Fig. 14b). What’s more, the imaging resolution of upper crust is improved to some extent. We therefore believe that the secondary Pg phases play an important role in restraining interfaces of sediment and seismic imaging resolution.

|
Fig. 14 Checkerboard test results of the model of survey line OBS2010 |
We have discussed the features of primary Pg and secondary Pg phases. The seismic waveform of secondary Pg phases following the primary Pg phases was identified, and the particle motions of secondary Pg phases show a similar feature with primaries. In order to analyze the application of secondary Pg phases in the crustal imaging, we discussed and calculated the possible propagation path in the crust. Based on the fitting results of OBS data (Fig. 6) and the verification for this propagation path from previous models, it is confirmed that secondary Pg phases mainly come from the reflection of sediment (Fig. 12a). Meanwhile, there are significant differences of crustal structures and OBSs’ water depth among those profiles, and therefore the waveform and signal magnitude of secondary Pg phases on seismic sections are also significantly different (Figs. 6, 7, 8, 9 and 10). However, the results show that secondary Pg phases mainly come from the reflection of sediment in above circumstances, thus it is concluded that the propagation path of secondary Pg phases has a reflection in the sediment which is universally applicable to OBS wide-angle seismic survey.
The effect of secondary Pg phases on crustal imaging is mainly embodied on the following two aspects. First, the reflection in the sediment can effectively restrain sedimentary basement, which makes up the deficiency of reflection phases from the sediment layer and the difficulty of identification of refractive phases from thin sedimentary layer. Moreover, after adding secondary Pg phases, the ray density in the sediment is three times of only primary Pg phases (Fig. 5) due to one more reflection in the sediment compared with primary Pg phases. Meanwhile, not only does the ray density increase in the sediment, but a small amount of ray increase in the upper crust (Figs. 7, 8, 9 and 10). It is beneficial for both forward modeling and inversion (Operto et al., 2006; Wong et al., 2012). As shown in Figs. 11, 13 and 14, the secondary Pg phases have greatly improved the imaging precision of sediment and upper crust, and enhanced the recovery capability of velocity perturbations, which is helpful to acquire more precise crustal structure.
It is believed that abundant multiple Pg phases are helpful to resource exploration with the development of seismic imaging in the future. In fact, not only the Pg phases, noticeable phenomenon of multiple waves of Ps and PmP phases can be found in many OBS data. How to utilize multiple waves to explore and obtain more fine crustal structure is one of development directions of seismic imaging.
ACKNOWLEDGMENTSThis study is supported by the shared voyage of 2012 Natural Science Foundation of China. Thanks to all members of "Shiyan 2" and Institute of Geology and Geophysics. Thanks also to Qiu X L and Zhao M H for giving some guidance and suggestions, and Ao W for providing OBS2006 data to this paper.
| [] | Amundsen L, Reitan A. 1995. Decomposition of multicomponent sea-floor data into upgoing and downgoing P-and S-waves. Geophysics , 60 (2) : 563-572. DOI:10.1190/1.1443794 |
| [] | Ao W, Zhao M H, Qiu X L, et al. 2012. Crustal structure of the northwest sub-basin of the South China Sea and its tectonic implication. Earth Science (Journal of China University of Geosciences) (in Chinese) , 37 (4) : 779-790. |
| [] | Berkhout A J, Verschuur D J. 2006. Imaging of multiple reflections. Geophysics , 71 (4) : SI209-SI220. DOI:10.1190/1.2215359 |
| [] | Bohnhoff M, Makris J. 2004. Crustal structure of the southeastern Iceland-Faeroe Ridge (IFR) from wide aperture seismic data. Journal of Geodynamics , 37 (2) : 233-252. DOI:10.1016/j.jog.2004.02.004 |
| [] | Brown M P, Guitton A. 2005. Least-squares joint imaging of multiples and primaries. Geophysics , 70 (5) : S79-S89. DOI:10.1190/1.2052471 |
| [] | |
| [] | Červený V. 1966. On dynamic properties of reflected and head waves in the n-layered earths crust. Geophysical Journal International , 11 (1) : 139-147. DOI:10.1111/gji.1966.11.issue-1 |
| [] | Czuba W, Ritzmann O, Nishimura Y, et al. 2004. Crustal structure of the continent-ocean transition zone along two deep seismic transects in north-western Spitsbergen. Polish Polar Res. , 25 (3-4) : 205-221. |
| [] | Dash R, Spence G, Hyndman R, et al. 2009. Wide-area imaging from OBS multiples. Geophysics , 74 (6) : Q41-Q47. DOI:10.1190/1.3223623 |
| [] | Grad M, Mjelde R, Czuba W, et al. 2012. Elastic properties of seafloor sediments from the modelling of amplitudes of multiple water waves recorded on the seafloor off Bear Island, North Atlantic. Geophys. Prospect. , 60 (5) : 855-869. DOI:10.1111/J.1365-2478.2011.01022.X |
| [] | Ito T, Iwasaki T, Thybo H. 2009. Deep seismic profiling of the continents and their margins. Tectonophysics , 472 (1-4) : 1-5. DOI:10.1016/j.tecto.2009.01.018 |
| [] | Jin H Z, Wang P. 2012. Model-based Water-Layer Demultiple (MWD) for shallow water:from streamer to OBS.//2012 SEG Annual Meeting, Society of Exploration Geophysicists. |
| [] | Lester R, Van Avendonk H J A, McIntosh K, et al. 2014. Rifting and magmatism in the northeastern South China Sea from wide-angle tomography and seismic reflection imaging. Journal of Geophysical Research:Solid Earth , 119 (3) : 2305-2323. DOI:10.1002/2013JB010639 |
| [] | Meléndez A, Sallarès V, Ranero C R, et al. 2014. Origin of water layer multiple phases with anomalously high amplitude in near-seafloor wide-angle seismic recordings. Geophysical Journal International , 196 (1) : 243-252. DOI:10.1093/gji/ggt391 |
| [] | Minshull T A, Muller M R, White R S. 2006. Crustal structure of the Southwest Indian Ridge at 66 E:Seismic constraints. Geophysical Journal International , 166 (1) : 135-147. DOI:10.1111/gji.2006.166.issue-1 |
| [] | Mjelde R, Breivik A J, Raum T, et al. 2008. Magmatic and tectonic evolution of the North Atlantic. Journal of the Geological Society , 165 (1) : 31-42. DOI:10.1144/0016-76492007-018 |
| [] | Operto S, Virieux J, Dessa J X, et al. 2006. Crustal seismic imaging from multifold ocean bottom seismometer data by frequency domain full waveform tomography:Application to the eastern Nankai trough. Journal of Geophysical Research:Solid Earth (1978-2012) , 111 (B9) : B09306. |
| [] | Osen A, Amundsen L, Reitan A. 1999. Removal of water-layer multiples from multicomponent sea-bottom data. Geophysics , 64 (3) : 838-851. DOI:10.1190/1.1444594 |
| [] | Verschuur D J, Berkhout A J. 2011. Seismic migration of blended shot records with surface-related multiple scattering. Geophysics , 76 (1) : A7-A13. DOI:10.1190/1.3521658 |
| [] | Wang X C, Xia C L, Liu X W. 2012. A case study:imaging OBS multiples of South China Sea. Marine Geophysical Research , 33 (1) : 89-95. DOI:10.1007/s11001-012-9148-2 |
| [] | Weglein A B. 1999. Multiple attenuation:an overview of recent advances and the road ahead (1999). The Leading Edge , 18 (1) : 40-44. DOI:10.1190/1.1438150 |
| [] | Wong M, Biondi B, Ronen S. 2012. Imaging with multiples using linearized full-wave inversion.//SEG Technical Program Expanded Abstracts, Society of Exploration Geophysicists:1-5. |
| [] | Xia S H, Zhao M H, Qiu X L, et al. 2010. Crustal structure in an onshore-offshore transitional zone near Hong Kong, northern South China Sea. Journal of Asian Earth Sciences , 37 (5-6) : 460-472. DOI:10.1016/j.jseaes.2009.11.004 |
| [] | Xia S H. 2009. Tomographic imaging of two classic continental margins in the East Asian[Ph. D. thesis] (in Chinese). Beijing:University of Chinese Academy of Sciences. |
| [] | Yang K, Guo C B. 2012. Propagation paths of multiple reflected refraction. Oil Geophysical Prospecting (in Chinese) , 47 (3) : 379-384. |
| [] | Zelt C A, Smith R B. 1992. Seismic traveltime inversion for 2-D crustal velocity structure. Geophysical Journal International , 108 (1) : 16-34. DOI:10.1111/gji.1992.108.issue-1 |
| [] | Zhao D P, Hasegawa A, Horiuchi S. 1992. Tomographic imaging of P and S wave velocity structure beneath northeastern Japan. Journal of Geophysical Research:Solid Earth (1978-2012) , 97 (B13) : 19909-19928. DOI:10.1029/92JB00603 |
| [] | Zhao M H, Qiu X L, Li J B, et al. 2013. Three-dimensional seismic structure of the Dragon Flag oceanic core complex at the ultraslow spreading Southwest Indian Ridge (49°39'E). Geochemistry, Geophysics, Geosystems , 14 (10) : 4544-4563. DOI:10.1002/ggge.20264 |
| [] | Zhao M H, Qiu X L, Xia S H, et al. 2008. Identification and analysis of shear waves recorded by three-component OBSs in northeastern South China Sea. Progress in Natural Science , 18 (2) : 181-188. DOI:10.1016/j.pnsc.2007.06.005 |