 2016, Vol. 59


2 GFZ German Research Centre for Geosciences, Potsdam 14473, Germany;
3 Institute of Geodesy and Geophysics, Chinese Academy of Sciences, Wuhan 430077, China;
4 School of Earth and Space Sciences, Peking University, Beijing 100871, China;
5 Institute of Disaster-Prevention Science and Technology, Yanjiao, Beijing 101601, China;
6 Office of the Western Yunnan Earthquake Prediction Study Area, China Earthquake Administration, Yunnan Dali 671000, China
The west Kunlun mountain earthquake of MS8.1 that occurred on November 14, 2001 is the largest earthquake in China in nearly half a century, which caused a surface rupture of 426 km (Xu et al., 2002; Xu et al., 2002a, b, 2005; Dang et al., 2002; Chen et al., 2003), and got attention from domestic and foreign scholars. Based on different methods, many authors researched the rupture distribution of this earthquake (Qiao et al., 2002; Shen et al., 2003; Lin et al., 2003; Shan et al., 2004; Xu et al., 2004; Ren et al., 2005; Lasserre et al., 2005; Ma et al., 2006; Wan et al., 2008). As shown in Fig. 1, the aftershocks were mainly distributed in the east of rupture segments in the following month after main shock, and after that, a few scattered aftershocks occurred.

|
Fig. 1 The distribution of aftershock and GPS station near the MS8.1 region |
Since there are quite limited monitoring stations within 500 km from the epicenter, researches on rupture process with seismology methods can only rely on data from teleseismic stations. Xu et al., 2004 used the global long period waveform data to conduct inversion and obtained an average slip of 1.2 m and a maximum slip of 2.2 m; Lin et al. (2003) also used the global long period waveform data and obtained an average slip of 1.8 m and a maximum slip of 5.8 m; while using the same method, Lin et al. obtained a maximum rupture of 16.3 m. These results provided important constraint conditions for us in understanding this earthquake and researching rupture model; however, there are some differences between these results, so it is necessary to introduce more near field observation data to research its rupture distribution in detail.
There is no doubt that geological investigation on surface rupture site is an important and reliable observational constraint. Xu et al. (2002) found the following information of this earthquake: the maximum dislocation of 6 m is located in the northeast of Kusai Lake between 93°E–93.5°E, surface rupture zone extends along N70°–90°W, consisting of a series of open tension cracks, tension shear cracks, and humps or pits, showing characteristics of pure shear strike-slip rupture; the maximum rupture given by Chen et al. (2003) was 6.4 m, which was consistent with the result of Xu et al. However, the result from Lin et al. (2002) by independent investigation was similar to that of Xu et al. (2002), and finally the maximum rupture was determined as 16.3 m. Since the earthquake rupture is in an area perennially covered with snow with an elevation of over 4000 m, there are many inaccessible areas, and to obtain its information is also difficult, which greatly increases the difficulty of surface scientific investigation and researches on earthquake. Up to now, there are still a lot of controversy on rupture distribution and depth of this area, and these results show that rupture scale, the maximum rupture location and others obtained from different materials, methods and models have large differences. Therefore, it is necessary to use other near field observation data to conduct inversion.
Geodetic surveying observation data from GPS, InSAR and others provided an effective means for near field observations. Using InSAR data to investigate the maximum dislocation rupture, the results were as follows: 8 m from Lasserre et al. (2005); 7.4 m from Shan et al. (2004); Wan et al. (2008) used InSAR and GPS data to conduct inversion through vertical fault, changing fault dip angles and other methods, and obtained the maximum dislocation rupture of 7 m. Most research conclusions showed that the range of maximum surface dislocation was 6~8 m, and different observation points of relevant dislocation had different observed value, indicating that this earthquake was in high altitude and part of glaciers regions, which brought great difficulty to investigation. Besides, earthquake rupture zone was not included in earthquake monitoring region basically, so it was difficult to determine dislocation distribution of underground and surface according to a few observation points, which needed a comprehensive analysis with a variety of methods.
Research on earthquake deformation has made great progress in recent decades, Okada (1992) derived the analytic solution of surface deformation caused by earthquake in semi-infinite space model, and this method has been widely used because of its fast computation speed and high precision. However, with the abundance of observational data, people found that the inhomogeneous earth medium had a certain impact on coseismic and post-seismic deformation. For coseismic dislocation inversion, there were some past research results mostly from inversion on the basis of Okada’s forward modeling, but Okada algorithm used half-space homogeneous medium model. For example, fault depth inverted by using a semi-infinite space model was greater than the real fault depth, and its slip amount was also larger than the real slip (Savage, 1998; Cattin et al., 1999). Uniform semi-infinite space medium model has become too simple to research earthquake deformation process, therefore, it is necessary to adopt layered earth model which is more similar to the real one.
On the basis of the above factors, Wang et al.(2003, 2005, 2006, 2007, 2011, 2013) published PSCMP and SDM, the forward and inversion procedures of surface deformation caused by earthquake dislocations in layered medium model. It could establish rupture model according to earthquake properties and surface fault and conduct joint inversion of surface rupture and underground dislocation by combining with GPS, InSAR, and strong earthquake data, which solved the relationship between establishment of model and actual earthquake rupture in detail, and this calculation program has been verified by a lot of earthquake cases and has been widely used (Wang, 2005; Wang et al., 2009; Wang et al., 2011; Diao, 2011; Jin, 2014). In inversion research on the existing measurement data of the West Kunlun mountain earthquake of MS8.1, Green function was mainly obtained on the basis of Okada elastic semi-infinite space model. Based on the layering model, this thesis collected data of surface rupture, GPS and InSAR and conducted underground dislocation inversion with SDM, for obtaining more accurate information of underground dislocation distribution and stress distribution.
2 DATA AND MODELINGCombined with research results of East Kunlun active fault zone by Qinghai Earthquake Administration and the Institute of Crustal Dynamics (1999), taking surface investigation data by Xu et al.(2002a, 2002b) and Chen et al. (2003) as reference for fault trace model and integrated with USGS fault model, this thesis established a surface rupture model with rupture length of 425.43 km. InSAR results given by Lasserre et al. (2005) were adopted. As shown in Fig. 2, it contained 4 interference patterns, a total of 4468 data points, and from east to west, the interference patterns were T362, T133, T405 and T448 respectively. GPS data was from Wan et al. (2008) (see Fig. 1b and Fig. 7).

|
Fig. 2 InSAR data processing |
As shown in Fig. 2, because InSAR data had 4 interference patterns and these patterns had different deviation from north and south of the fault respectively, which needed correction respectively. According to distribution of surface fault, this thesis divided these 4 interference patterns into 8 interference patterns with surface rupture trace as boundary, removed data too close to the fault or overlapping with fault line, and then corrected them by inversion according to orbit parameters. In initial inversion, data of the east interference pattern (T362) was difficult to combine with data of the other three. This thesis conducted weight setting and multiple fitting, obtaining offset value of this figure, and then carried out single correction, after that, calculated all data based on weight 1.0; since GPS observation had only 34 sets of data, which differed by about two orders of magnitude from InSar information data points, this thesis set its weight as 100. For all data involved in calculation, the author gave 0.005 of error control.
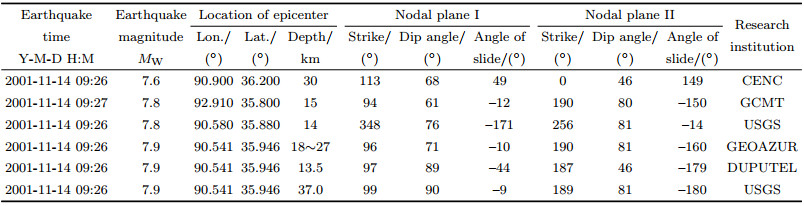
For determination of source parameters, the magnitude, focal depth, and epicenter location from focal mechanism solutions given by different institutions were shown in Table 1. Focal mechanism solutions and surface investigation results of these institutions all showed that earthquake rupture was sinistral strike-slip, and obtained that overall rupture trend and strike variation range of fault was 94°~113°, dip angle variation range was 61°~90°, and focal depth variation range was 15~38 km, which provided a reference basis for establishment of fault model of this thesis.
|
|
Table 1 The source parameters from different research institutions |
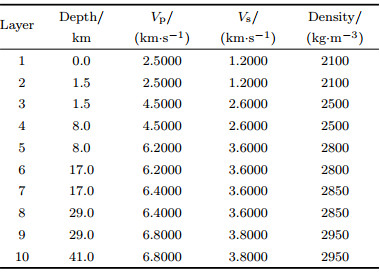
For selection of medium model, previous researchers found that layering of earth medium had a certain influence on coseismic deformation field (Du et al., 1994; Savage, 1998; Cattin et al., 1999; Hearn and Bürgmann, 2002). This thesis used a layering model in calculation, which was established according to collected relevant data (Li et al., 2006; Wang et al., 2008), and its parameters were shown in Table 2.
|
|
Table 2 Layered earth structure |
The research region is located at no man’s land at high altitude, what made it extremely hard to collect seismic data was its harsh climate and environment. Thankfully, before MS8.1 earthquake in 2001, Qinghai Seismological Bureau and the Institute of Crustal Dynamics, CEA conducted deep research on East Kunlun active fault belt in 1990s (1999) and obtained many precious materials. After the earthquake, Qinghai Seismological Bureau cooperated with geology, earthquake and geodetic surveying multidisciplinary expedition sent by China Earthquake Administration to conduct field monitoring and scientific investigation. They investigated the earthquake comprehensively, traced its fault and gained a series of meaningful observation data of the earth’s surface (Xu et al., 2002a, 2002b; Dang et al., 2002; Chen et al., 2003). The break points on the surface measured through the investigation can be connected to form a fault rupture trace of 426 km long. Fault trace model in the thesis was formed on the basis of these surface investigation data and surface rupture model of USGS.
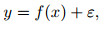
The thesis adopted SDM method put forward by Wang et al. (2013) and built post-earthquake fault model according to related materials, which can be expressed as the following formula:
|
(1) |
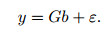
where x is the parameter related to fault, including fault length, width, location, strike, dip angle and slippage, ε is error; y is surface observation value. After determining geometrical parameters of the fault, inversion problem of slip model can be transformed into general linear inversion problem, which can be expressed as the following formula:
|
(2) |
In formula (2), G is Green function, which is calculated by slip theory according to semi-infinite half-space model or layered earth model; b is slippage of fault plane underground, y stands for surface observation quantity. In order to get higher resolution, we divided fault plane into many small segments and b stands for slippage of each sub fault planes. The layered medium model parameters for calculating Green’s function are listed in Table 2.
|
(3) |
In formula (3), in order to obtain shear stress drop according to slip distribution of the whole fault, H is finite difference approximation of weight factor of related displacement amplitude and Laplace operator; s is slippage of underground fault plane; y is surface observation quantity; α is smooth factor.
4 RESULT AND ANALYSISOn the basis of previous studies (Xu et al., 2002, 2005; Dang et al., 2002; Chen et al., 2003; Qiao et al., 2002; Shen et al., 2003; Lin et al., 2003; Shan et al., 2004; Xu et al., 2004; Ren et al., 2005; Ma et al., 2006; Lasserre et al., 2005; Wan et al., 2008), the thesis set fault plane width as 20~35 km, dip angle variation range as 75°~85°, rupture length as 425.43 km, every 5 km×5 km area as a sub fault plane, then used SDM program to invert GPS data, InSAR data, and combined InSAR and GPS data. Through more than 300 calculations, we finally found that when the dip angle is 83°, residual is the minimum, so the thesis set 83° as dip angle to invert for other fault parameters. In order to determine reasonable slip distribution of the fault, it is necessary to choose a proper smooth factor α. The thesis used the curve of slip roughness and misfit to determine α, as shown in Fig. 3, the final smooth factor α=0.08. The thesis got underground slip distribution with a layered medium model, see Fig. 4a, which are mainly sinistral strike-slip, showing that the earthquake was a sinistral strike-slip earthquake, but at the same time there are some dip-slip fault component in regions of 20~40 km, 180~240 km. The main rupture area of the earthquake was located above 15 km underground with average slippage of 1.64 m; the maximum slip near the surface was 6.9 m and was located around 35.76°N, 93.40°S; moment magnitude was MW7.83, fitting correlation coefficient of data model was 0.996, average stress drop was 1.3 MPa and the maximum stress drop was 8.3 MPa. See stress distribution in Fig. 5. Fig. 4b is the result calculated by homogeneous model, in which the maximum slip near the surface is 3.89 m, fitting correlation coefficient of data model is only 0.426, showing that the result of homogeneous model has less reliability than that of layered medium model on calculating the earthquake.

|
Fig. 3 The curve of slip roughness and misfit |

|
Fig. 4 The slip distribution on earthquake fault plane |

|
Fig. 5 Stress distribution on the fault (GPS, InSAR and GPS+InSAR) |
Figure 5 shows the stress distributions calculated by GPS data, InSAR data and GPS+InSAR data respectively, which shows that the part of large stress variation along the rupture strike basically agrees with the underground area with larger rupture; stress variation in the dip direction can be divided into several areas, but the variation is much smaller than that along rupture strike, which shows that the earthquake was dominated by pure strike-slip fault; the distribution of normal stress variation shows that stress increased in the east area, while stress weakened in the west area.
Figure 6 took longitude as abscissa to plot the calculated and observed surface rupture distribution. Fig. 6a is the contrast diagram of surface rupture inverted from GPS data and the surface investigation data, the maximum slip is 8.6 m; Fig. 6b is the contrast diagram of surface rupture inverted from InSAR data and the surface investigation data, the maximum slip is 6.8 m; Fig. 6c is the contrast diagram of surface rupture distribution calculated from GPS+InSAR data and the surface investigation data, the maximum slip is 6.9 m. Because there were less GPS data, they can only provide a rough estimation of large-scale change; while the result of joint conversion which combined GPS data and ISAR data is more reliable. The corresponding result agreed with the location of the maximum rupture investigated by previous researchers, as well as the earthquake magnitude.

|
Fig. 6 The comparison between surface slips from field investigation and slip inversion |
According to rupture size, it can be seen obviously from Fig. 4 to Fig. 6 that this earthquake has three regions with large rupture size, showing that the earthquake had a very complicated rupture process. The analysis indicated that the earthquake was caused by consecutive rupture of three large sub events. In fact, only in this way can we better explain the surface rupture size of~426 km. At the same time, it can be seen from longitudinal profile that depth range of the main underground rupture is less than 10 km or even smaller; rupture of more than 4 m slip occurred on faults above 10 km depth and rupture of more than 2 m slip can be down to 20 km.
Xu et al., 2004 inverted seismic waveform data and thought that the earthquake was caused by ruptures of three sub earthquakes and provided rupture size and rupture speed; Xu et al. (2005) also thought the earthquake was caused by ruptures of three sub earthquakes through geological survey and research and provided corresponding sub earthquakes’ magnitude from west to east, namely MW=6.8, MW=6.2 and MW≤7.8, in which the earthquake with MW≤7.8 in the east was the principal earthquake of West Kunlun mountain earthquake. Rupture distribution, size and scale in this thesis agreed with these conclusions. The comparison to above-mentioned research achievements indicated that the underground slip inversion in the thesis has high reliability. Thus, more analyses and discussions can be developed. On the problem of surface rupture, the thesis’s results basically agreed with previous researchers’ results made by scientific investigation of the surface, but there was a big difference between 91° to 91.5°, the possible reasons are as follows: on one hand, there were no near-fault GPS data and InSAR data available on two sides of the fault; on the other hand, the region consisted of a number of en echelon ruptures including tension rift, tension rupture, tension sheer strike-slip rupture, sheer strike-slip rupture and humps. The wide rupture, together with factors like collapse, landslide, etc. after the earthquake may lead to different surface observation.
Figure 7 is the distribution of seismic sources provided by different institutions and contrast diagram of calculated surface particle displacement distribution and GPS observation data (notes: red arrow is computed result, blue arrow is GPS observation result), which shows that the computed result is close to GPS observation value, further displaying that the research’s results are reliable.

|
Fig. 7 The fault trace and the comparison of GPS observation data and particle displacement data |
The thesis took GPS data, InSAR data and InSAR+GPS data as observation data and adopted layered medium model to invert for underground slip model of West Kunlun mountain MS8.1 earthquake (MW7.8) on November 14th, 2001. Through comparison and analysis, the thesis believed that results calculated by InSAR+GPS data are closer to results of surface investigation and at the same time found that the earthquake has normal strike-slip component in local regions, the maximum rupture is 6.92 m, the average rupture is 1.64 m; the earthquake can be divided into three sub earthquakes with different scales according to rupture size of fault rupture plane and its distribution, rupture range of more than 4 m slip is located above 10 km underground and rupture of more than 2 m slip is mainly located above 20 km underground, showing that rupture in the earthquake mainly occurred in shallow upper crust.
5.2 DiscussionThe comparison with the surface scientific investigation and observation results of Xu et al. (2002) and Chen et al. (2003) found that the observation values in most areas basically agreed with results calculated by the model except for evident differences at E91°–92°. Considering that in the area, Xu et al. used “?” to show that the observation in that place is uncertain, slip model of the thesis can make up for the data missing in the area. At the same time, the thesis put forward that the earthquake was caused by three sub earthquakes, which basically agreed with the research results of Xu et al. (2002) and Xu et al., 2004. When comparing with Lasserre et al.’s results calculated only by InSAR data, the thesis had the similar rupture form, but rupture zone provided by Lasserre had large-scale regions with 0 value; while the thesis inverted InSAR+GPS data jointly and the results showed that basically there was no 0 value regions. Slip distribution is smoother, so theoretically, the thesis’s rupture form is closer to physical image of the fault rupture.
Combined with results of previous researches, it is considered that inversion results of the West Kunlun mountain MS8.1 earthquake in the thesis has many common points with conclusions made by surface investigations and different inversion methods, confirming analysis result of the three sub earthquakes provided by Xu et al. (2002) and Xu et al., 2004 and agreeing with specialists and scholars in terms of the maximum slip break point. In terms of the maximum slip amount, remove the maximum value 16.3 m (Lin et al., 2004) and the minimum value 2.2 m (Xu et al., 2004), the result of the thesis is equivalent to the average of other values.
When inverting, the thesis used layering model, simplified the fault according to features of the surface rupture track, adopted a single fault plane of~425.43 km long, took 5 km×5 km sub fault plane as calculation unit, which may ignore the fault’s local effect, but the overall result showed that the calculated results agree with results of the surface investigation.
ACKNOWLEDGMENTSWhen modifying the thesis, we got precious comments and suggestions from editorial board and reviewers. I would like to extend my gratitude to all of them. This work is supported by the Science for Earthquake Resilience (XH16039), the Ministry of Human Resources and Social Security Study Plan According to Qualification, the Special Industry Earthquake (201408023), and the National Scholarship.
| [] | Cattin R, Briole P, Lyon-Caen H, et al. 1999. Effects of superficial layers on coseismic displacements for a dip-slip fault and geophysical implications. Geophys. J. Int. , 137 (1) : 149-158. DOI:10.1046/j.1365-246x.1999.00779.x |
| [] | Chen J, Chen Y K, Ding G Y, et al. 2003. Surface rupture zones of the 2001 earthquake MS8.1 west of Kunlun pass, northern Qinghai-Xizang Plateau. Quaternary Sciences (in Chinese) , 23 (6) : 629-639. |
| [] | Dang G M, Wang Z J. 2002. Characteristics of the surface rupture zone and main seismic hazards caused by the MS8.1 earthquake west of the Kunlun pass, China-Constraints on the regional stability of the Qinghai-Tibet Plateau. Geological Bulletin of China (in Chinese) , 21 (2) : 105-108. |
| [] | Diao F Q. 2011. Co-seismic and Post-seismic Deformation Studies Based on GPS Observations[Ph. D. thesis] (in Chinese). Institute of Geodesy and Geophysics, Chinese Academy of sciences. |
| [] | Du Y J, Segall P, Gao H J. 1994. Dislocations in inhomogeneous media via a moduli perturbation approach:General formulation and two-dimensional solutions. J. Geophys. Res. , 99 (B7) : 13767-13779. DOI:10.1029/94JB00339 |
| [] | Hanks T C. 1979. b values and -Y seismic source models:implications for tectonic stress variations along active crustal fault zones and the estimation of high-frequency strong ground motion. Journal of Geophysical Research:Atmospheres , 84 (B5) : 2235-2242. DOI:10.1029/JB084iB05p02235 |
| [] | Hanks T C, McGuire R K. 1981. The character of high-frequency strong ground motion. Bull. Seismol. Soc. Am. , 71 (6) : 2071-2095. |
| [] | Hearn E H, Bürgmann R, Reilinger R E. 2002. Dynamics of zmit earthquake postseismic deformation and loading of the Dzce earthquake hypocenter. Bull. Seismol. Soc. Am. , 92 (1) : 172-193. DOI:10.1785/0120000832 |
| [] | Jin M P, Wang R J, Tu H W. 2014. Slip model and co-seismic displacement field derived from near-source strong motion records of the Lushan MS7.0 earthquake on 20 April 2013. Chinese J. Geophys. Chinese J. Geophys. (in Chinese) , 57 (1) : 129-137. DOI:10.6038/cjg20140112 |
| [] | Lasserre C, Peltzer G, Crampé F, et al. 2005. Coseismic deformation of the 2001 MW=7.8 Kokoxili earthquake in Tibet, measured by synthetic aperture radar interferometry. J. Geophys. Res. , 110 : B12408. DOI:10.1029/2004JB003500 |
| [] | Li Y H, Wu Q J, An Z H, et al. 2006. The Poisson ratio and crustal structure across the NE Tibetan Plateau determined from receiver functions. Chinese J. Geophys. (in Chinese) , 49 (5) : 1359-1368. |
| [] | Lin A M, Fu B H, Guo J M, et al. 2002. Co-seismic strike-slip and rupture length produced by the 2001 MS8.1 Central Kunlun earthquake. Science , 296 (5575) : 2015-2017. DOI:10.1126/science.1070879 |
| [] | Lin A, Kikuchi M, Fu B. 2003. Rupture segmentation and process of the 2001 MS7.8 central Kunlun, China, earthquake. Bull. Seismol. Soc. Am. , 93 (6) : 2477-2492. DOI:10.1785/0120020179 |
| [] | Ma C, Shan X J. 2006. A multi-segment analytic modeling of hypocentral geometric characteristic parameters of the MS8.1 earthquake at the Kunlun mountains. Chinese J. Geophys. (in Chinese) , 49 (2) : 428-437. |
| [] | McGuire R K, Hanks T C. 1980. RMS accelerations and spectral amplitudes of strong ground motion during the San Fernando, California earthquake. Bulletin of the Seismological Society of America , 70 (5) : 1907-1919. |
| [] | Okada Y. 1992. Internal deformation due to shear and tensile faults in a half-space. Bull. Seismol. Soc. Am. , 82 (2) : 1018-1040. |
| [] | Qiao X J, Wang Q, Du R L, et al. 2002. Characteristics of crustal deformation relating to MS8.1 Kunlunshan earthquake. Journal of Geodesy and Geodynamics (in Chinese) , 22 (4) : 6-11. |
| [] | . 1999. Qinghai Seismological Bureau and Institute of Crustal Dynamics China Seismological Bureau[M]. Beijing: Seismological Press: 1 -186. |
| [] | Ren J W, Wang M. 2005. GPS measured crustal deformation of the MS8.1 Kunlun earthquake on November 14th 2001 in Qinghai-Xizang Plateau. Quaternary Sciences (in Chinese) , 25 (1) : 34-44. |
| [] | Savage J C. 1998. Displacement field for an edge dislocation in a layered half-space. J. Geophys. Res. , 103 (B2) : 2439-2446. DOI:10.1029/97JB02562 |
| [] | Shan X J, Liu J H, Ma C. 2004. Preliminary analysis on characteristics of coseismic deformation associated with MS=8.1 western Kunlunshan Pass earthquake in 2001. Acta Seismologica Sinica (in Chinese) , 26 (5) : 474-480. |
| [] | Shen Z K, Wan Y G, Gan W J, et al. 2003. Viscoelastic triggering among large earthquakes along the east Kunlun fault system. Chinese J. Geophys. (in Chinese) , 46 (6) : 787-795. |
| [] | Wan Y G, Shen Z K, Wang M, et al. 2008. Coseismic slip distribution of the 2001 Kunlun mountain pass west earthquake constrained using GPS and InSAR data. Chinese J. Geophys. (in Chinese) , 51 (4) : 1074-1084. |
| [] | Wang L, Wang R, Roth F, et al. 2009. After slip and viscoelastic relaxation following the 1999 M7.4 zmit earthquake from GPS measurements. Geophysical Journal International , 178 (3) : 1220-237. DOI:10.1111/gji.2009.178.issue-3 |
| [] | Wang R J, Lorenzo-MartÍn F, Roth F. 2003. Computation of deformation induced by earthquakes in a multi-layered elastic crus-FORTRAN programs EDGRN/EDCMP. Computer and Geosciences , 29 (2) : 195-207. DOI:10.1016/S0098-3004(02)00111-5 |
| [] | Wang R J. 2005. The dislocation theory:a consistent way for including the gravity effect in (visco) elastic plane-earth models. Geophysical Journal International , 161 (1) : 191-196. DOI:10.1111/gji.2005.161.issue-1 |
| [] | Wang R J, Lorenzo-MartÍn F, Roth F. 2006. PSGRN/PSCMP-a new code for calculating co-and post-seismic deformation, geoid and gravity changes based on the viscoelastic-gravitational dislocation theory. Computers and Geosciences , 32 (4) : 527-541. DOI:10.1016/j.cageo.2005.08.006 |
| [] | Wang R J, Schurr B, Milkereit C, et al. 2011. An improved automatic scheme for empirical baseline correction of digital strong-motion records. Bulletin of the Seismological Society of America , 101 (5) : 2029-2044. DOI:10.1785/0120110039 |
| [] | Wang R J, Parolai S, Ge M R, et al. 2013. The 2011 MW9.0 Tohoku earthquake:Comparison of GPS and strong-motion data. Bulletin of the Seismlogical Society of America , 103 (2B) : 1336-1347. DOI:10.1785/0120110264 |
| [] | Wang W M, Su Y L, Gao X, et al. 2008. A study of the velocity structure beneath Himalaya mountain chain region using transform function method. Chinese J. Geophys. (in Chinese) , 51 (6) : 1735-1744. |
| [] | Xie C L, Ye G F, Wei W B, et al. 2012. Electrical features of the main faults beneath Northern Tibetan Plateau. Chinese J. Geophys. (in Chinese) , 55 (12) : 3991-4002. DOI:10.6038/j.issn.0001-5733.2012.12.011 |
| [] | Xu L S, Chen Y T. 2005. Temporal and spatial rupture process of the great Kunlun mountain pass earthquake of November 14, 2001 from the GDSN long period waveform data. Science in China Series D:Earth Sciences , 48 (1) : 112-122. |
| [] | Xu X W, Chen W B, Yu G H, et al. 2002. Characteristic features of the surface ruptures of the Hohsaihu (Kunlunshan) earthquake (MS8.1), northern Tibetan plateau China. Seismology and Geology (in Chinese) , 24 (1) : 1-13. |
| [] | Xu X W, Chen W B, Ma W T, et al. 2002. Surface rupture of the Kunlunshan earthquake(MS8.1), northern Tibetan plateau, China. Seismol. Res. Lett. , 73 (6) : 884-892. DOI:10.1785/gssrl.73.6.884 |
| [] | Xu X W, Tapponnier P, Van Der Worerd J J, et al. 2005. Late Quaternary sinistral slip rate along the Altyn Tagh Fault and its structural transformation model. Science in China Series D:Earth Sciences , 48 (3) : 384-397. DOI:10.1360/02yd0436 |