 2016, Vol. 59


Substorms are electromagnetic disturbances occurring on the nightside of the magnetosphere and in the high-latitude ionosphere, which vary with time and space. This concept firstly appeared in the 1960s (Akasofu, 1964). Substorms contain three phases: a growing phase, an expansion phase, and a recovery phase (McPherron, 1970), and generally last for 2~3 h. The occurrence of substorms is usually accompanied by local energy changes, which are of importance for the ionospheric-thermospheric coupling system. Plasma convection and zonal wind are both common and important physical phenomena in the ionosphere and thermosphere.
Plasma convection is the movement of magnetospheric plasma forced by the interaction between the solar wind and magnetosphere (Kamide and Chian, 2007), and thermospheric zonal wind is the movement of neutral particles along the latitudinal direction.
Both plasma convection and zonal wind have been studied extensively with satellite data and through model simulation in the past few decades. For example, the occurrence of substorms has obvious effects on the plasma convection (Schindler and Birn, 1978; Baumjohann et al., 1990; Angelopoulos et al., 1992). Kamide’s research showed that substorms can significantly enhance the night and morning sectors’ plasma convection velocity (Kamide 1994). Grocott (2009) studied ionospheric convection from 60 min before to 90 min after substorms. He found that substorms have latitudinally different influences on plasma, with low-latitude substorms being more likely to enhance the plasma velocity and, during the expansion phase, convection decreasing significantly in the midnight sectors; for high-latitude substorms, however, convection increases significantly and quickly in night sectors. Xing (2010) found that, after substorm occurrence, the center of the westward electrojet moves equatorward. Sandholt (2012) further pointed out a summer-winter hemisphere asymmetry in the influence of substorms on the convection, with the influence in the winter hemisphere being more obvious.
The neutral air plays an important role in the ionospheric-thermospheric coupling, leading to numerous thorough studies of atmospheric density, meridional and zonal wind, etc. (Schlegel et al., 2005; Demars and Schunk, 2007; Rentz and Lühr, 2008). The occurrence of substorms also has a significant influence on the neutrals. Fujiwara (1996) found that, after the occurrence of a high-latitude substorm, the enhanced air mass densities move to the equator side through large-scale meridional wind, whose horizontal speed is close to the local wind speed. Emmert (2002) indicated that the substorms’ influence on the westward zonal wind occurs in the 12~24 h MLT sector area, 0~9 h after substorm onsets, and that the maximum value appears in the afternoon sectors at an altitude of 150 km at middle latitudes. Ritter (2010), using CHAllenging Mini-Satellite Payload (CHAMP) satellite data, found that, after the occurrence of a substorm, atmospheric density increases and spreads to the equator, in the form of a traveling atmospheric disturbance, in the 22~1 h MLT sector area. At the time of stronger magnetic activity, the zonal wind has a larger disturbance, about 50 m·s−1, at middle latitudes (53° − 74°), whereas, during magnetic quiet periods, disturbance occurs only in the western area of substorm onsets. Then Lühr, Park, and Ritter (2012) further confirmed Ritter’s (2010) conclusion by comparing zonal average wind velocities before and after substorms. Clausen (2014), also using CHAMP data, found that 90 min after substorm occurrence the atmospheric mass density increases by 34% at an altitude of 400 km, but he did not specify the critical effects on the zonal wind.
These previous results show that substorms can enhance the plasma convection velocity, with latitudinal, hemispheric, and seasonal differences, but the response time (difference between the east and west MLT sector areas of substorm onsets) was not involved, and conflicting views on the effects on zonal wind remain. Meanwhile, Emmert (2006) and Wang’s (Wang and Lühr, 2011; Wang et al., 2012) researches have indicated that there exists an interaction between plasma convection and the zonal wind, the details of which are still lacking. Therefore, studying the time and space response to substorms is of great significance for further understanding the ionospheric-thermospheric coupling system.
2 DATA 2.1 Substorm DataThe substorm onset time and location used in this paper are given by Newell and Gjerloev (2011), who used the SuperMAG geomagnetic station chain to obtain the new polar electrojet index (SME) (which differs from the traditional 12 stations based AE index). SME=SMU–SML, where SMU is the most-positive deviation and SML is the most-negative deviation. The method has been described in detail in Section 3.3 of Newell and Gjerloev’s (2011) paper. We just give a summary here. When the SML index drops 45 nT in 3 min after time t0, and in the next 1.5 h the difference value between its average and the initial value is > −100 nT, we identify time t0 as the substorm onset time; at the same time, to ensure that substorm events are independent, the SML variation is required for at least 2 h and is compared to IMAGE satellite (FUV) ultraviolet imaging to ensure the accuracy of event selection; the positional coordinates refer to the contributing station for SML 1 min after onset and thus give the approximate onset location. Newell and Gjerloev (2011) selected 12458 substorm events in 2001–2005. To avoid overlap of substorm events that can influence the results during the research time range (1.5 h before to 3 h after substorm onsets), we set the time between two substorm events to be >4.5 h. Finally, we selected 1253 substorm events in 2001–2005.
2.2 Satellite DataWe use Defense Meteorological Satellite Program (DMSP) F13 and F15 and CHAMP data to study the temporal and spatial variation of both plasma convection and zonal wind during substorm periods.
The DMSP satellites have polar, nearly circular sun-synchronous orbits (orbital inclination of 96°) of 830 km altitude and 101 min periods. The magnetic local times of satellites are near 0600–1800 MLT (F13) and 0930–2130 MLT (F15). The azimuthal plasma drift velocity (Vy) data are used, with positive value standing for westward direction (Rich and Hairston, 1994). Data samples are taken every 4 s, and each set of data has a quality mark. We just use the most reliable data (quality index R, I of 1 or 2), at the same time, and we eliminated plasma convection velocity data for which the absolute velocity is larger than 2500 m·s−1.
CHAMP was launched on 15 July 2000 into a near-polar (83.7° inclination) orbit with an initial altitude of about 450 km (Reigber et al., 2002). The average altitude of CHAMP during 2002 and 2003 was 400 km. The satellite processes 1 h in local time every 11 days, thus covering all local times within 130 days.The thermospheric zonal wind velocity is calculated from CHAMP space triaxial accelerometer measurements (Doornbos et al., 2010). The accuracy of the data is about±10 m·s−1. We make a positive zonal wind velocity standing for westward direction.
3 STATISTICAL RESULTS 3.1 Event SelectionWe aim to investigate the temporal effects of substorm on the plasma convection and thermospheric zonal wind, thus, we group data into three UT intervals with reference to the onset time: [–1.5 h, 0], [0, 1.5 h], [1.5 h, 3 h].
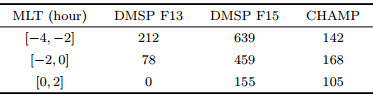
To investigate the spatial effects of substorms, we group the data into three MLT bins with reference to the substorm onsets MLT: [–4 h, –2 h], [0, –2 h] and [0, 2 h]. It takes 130 days for CHAMP to cover all local time (Reigber et al., 2002). DMSP are sun-synchronous satellites. F13 is in the 0600–1800 MLT and F15 is in the 0930–2130 MLT sectors. As substorm onsets occur mostly after 18 h MLT, there are no DMSP F13 observations in the MLT bin of [0, –2 h]. The numbers of satellite orbit segments are listed in Table 1, which are enough for a statistical study.
|
|
Table 1 Number of DMSP/CHAMP orbits during substorm periods in different MLT sectors |
A superposed epoch analysis (SEA, Wang et al., 2011) is performed to show the magnetic latitudinal (MLat) trends of plasma and wind velocity during substorm periods. In each MLT bins, we compare observations before and after onsets: [–1.5 h, 0], [0, 1.5 h], [1.5 h, 3 h]. Data from 30° MLat equatorward and 20° MLat poleward of the substorm onsets are presented. The stack plots of the DMSP plasma velocity as functions of MLat are shown in Fig. 1 for each MLT and UT bins. The average velocities at an interval of 1° MLat are shown as red lines. The standard deviations of the averages are shown as vertical bars. Fig. 1 shows a sine-wave variation of plasma convection velocity as a function of MLat. 0° MLat means the position where substorm onset occurs. The velocity is firstly westward (positive) and increases with the latitude, then decreases and turns eastward (negative).

|
Fig. 1 Superposed epoch analysis of the plasma velocity at different MLT sectors before and after substorm onset as observed by DMSP F13 as functions of magnetic latitude |
In this study, we focus on the temporal and spatial variation of average velocity, which is shown in Fig. 2. The mean velocities in the UT intervals of [–1.5 h, 0], [0, 1.5 h] and [1.5 h, 3 h] are shown as blue, red, and black lines, respectively. The peak westward velocities locate equatorward of substorm onsets. The peak westward velocities get enhanced after substorm onsets ([0, 1.5 h]) as compared to those before onsets ([–1.5 h, 0]).

|
Fig. 2 The averaged plasma velocity as a function of magnetic latitude in each MLT sector as observed by DMSP F13 (a–b) and F15 (c–e). Blue curves are for those occurring 0~1.5 h before the substorm onsets, red for those 0~1.5 h after the onsets, and black for those 1.5~3 h after onsets |
The SEA study of CHAMP zonal wind along magnetic latitude is shown in Fig. 3, with positive value for westward direction. The blue, red, black, and green lines indicate the UT intervals of [–1.5 h, 0], [0, 1.5 h], [1.5 h, 3 h] and [3 h, 4.5 h], respectively. The zonal winds increase for 3 h after substorm onset (i.e., [0, 1.5 h] and [1.5 h, 3 h]). In the MLT bins of [–4 h, –2 h] the wind velocities decrease, while in the MLT bins of [–2 h, 0] and [0, 2 h] the wind velocities continue increasing. The substorm effects on the wind are longer lasting as compared to their effect on the plasma velocity.

|
Fig. 3 (a–l) Superposed epoch analysis of the zonal wind velocity at different MLT sectors before and after substorm onsets as observed by CHAMP as functions of magnetic latitude. Black lines are stack plots and red lines are average values. Vertical lines denote standard deviations. 0 MLat indicates substorm onset location. (m–o) The averaged zonal wind velocity as a function of magnetic latitude in each MLT sector as observed by CHAMP. Blue curves are for those occurred 0~1.5 h before the substorm onsets, red for those 0~1.5 h after the onsets, and black for those 1.5~3 h after onsets |
The present work studies the substorm effects on the plasma velocity and zonal wind by using both CHAMP and DMSP satellite data, with the aim to understand the ionosphere-thermopshere coupling mechanism.
4.1 Variation of Plasma Convection VelocityThe peak westward plasma velocity in each MLT and UT bins are listed in Table 2 to represent the substorm effects. In the MLT sector of [–2 h, 0], the F15 plasma velocity is 276.9 m·s−1 before substorm onsets (i.e., [–1.5 h, 0]). Shortly after substorm onsets ([0, 1.5 h]), the plasma convection velocity reaches 341.4 m·s−1. As compared to [–1.5 h, 0] before substorm onsets, the speed value increases by 64.5 m·s−1. In [1.5 h, 3 h], the velocity value drops to 336.6 m·s−1, but relative to [–1.5 h, 0], the velocity still increases by 59.7 m·s−1. A similar situation also appears in the MLT sector of [–4 h, –2 h] for F15 satellites. In the MLT sector of [0, 2 h] the plasma velocity continues to increase after substorm onsets. In the two MLT sectors of F13, the plasma velocity increases significantly within 1.5 h after substorm onsets, then the velocity drops, becoming less than that before substorm onsets. These indicate that the substorm can significantly and quickly increase the plasma convection velocity (within 1.5 h). The effects become weaker after 1.5 h in the MLT sectors of [–4 h, –2 h] and [–2 h, 0]. The effect persists longer in the MLT sector of [0, 2 h].
|
|
Table 2 Peak plasma velocity and its MLat location as observed by DMSP at different MLT and UT sectors |
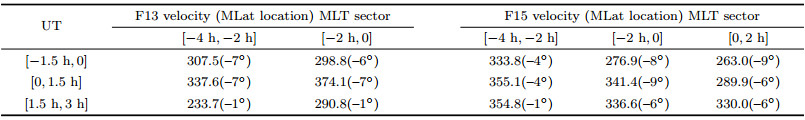
Although the plasma convection velocities increase after the substorms in each MLT sector, the extent of the increase is different; this is because the background plasma velocities in each MLT sector are different. Thus, we use the percentage speed increment to eliminate background effects. We set the value in the UT interval of [–1.5 h, 0] as the reference point, and observe the velocity increment in the UT interval of [0, 1.5 h] and [1.5 h, 3 h].
The two MLT sectors of the F13 satellite are both in the western side of substorm onsets. In [–2 h, 0], the velocity relative increment is 25.20%, whereas in [–4 h, –2 h] the velocity relative increment is only 9.8%. For F15, in [–2 h, 0] the velocity relative increment is 25.20%, whereas in [–4 h, –2 h] the velocity relative increment is only 6.38%. Taken together, these results indicate that the effects of substorms are mainly concentrated at a distance of 2 h MLT from onsets. The [0, 2 h] sector (eastside of substorm onsets) velocity increment of the F15 satellite is 10.23%, less than the increment in [–2 h, 0] sector, suggesting that its impact will be spread out on both sides of the onsets at the same time, but its main influence is in the western side. Therefore the effect of substorms on plasma convection has not only a latitude dependence (Grocott et al., 2009) but also a MLT-sector dependence, which has not been found in the past.
The MLat locations of velocity peaks are recorded in brackets in Table 2 (as shown in Figs. 2 and 3). A minus MLat indicates that the location is equatorward of substorm onsets. In the MLT sector of [–4 h, –2 h] (for both F13 and F15 satellites), the locations where plasma velocities attain peaks remain unchanged after the substorms ([0, 1.5 h]), then they move poleward ([1.5 h, 3 h]). However, in the MLT sector of [–2 h, 0], the positions move equatorward in [0, 1.5 h], and then retreat poleward in [1.5 h, 3 h]). This result is consistent with those results of Xing (2010), which indicates that the occurrence of substorms prompted movement of the peaks of the plasma convection velocity to the equator side. During substorms the solar wind energy is deposited and released in the magnetotail (Gérard, 2004; Kullen and Karlsson, 2004). The auroral oval boundary is the separator between the open and closed magnetic field lines. Previous research has shown that the aurora oval will expand equatorward during storm periods (Maltsev et al., 1996; Schulz, 1997; Alexeev et al., 2000). The plasma convection centers around the aurora oval, therefore, they will move to the equator side together.
4.2 Variation of Zonal Wind VelocityThe peak wind velocities in each MLT and UT bins are listed in Table 3. The average zonal wind velocity in all MLT sectors increase for almost 3 h after substorms occur. Later in the UT interval of [3 h, 4.5 h] the velocity in the MLT sector of [–4 h, –2 h] decreases, while the speed in [–2 h, 0] and [0, 2 h] continues to increase. This means that substorm effects are larger and longer in the MLT bins closer to the substorm, which support Emmert’s (2002) theory. Meanwhile, the effects mainly occur in the western side of onsets, which is consistent with results from Ritter (2010) and Lühr (2012). Moreover, the response time to the substorms has a 1.5 h delay, the same as the atmospheric density’s response time found by Clausen (2014).
|
|
Table 3 Thermospheric zonal wind and its MLat location as observed by CHAMP at different MLT and UT sectors |
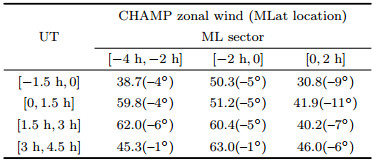
Within 1.5 h after substorm onsets, the speed in the MLT interval of [-2 h, 0] keep almost unchanged, while the relative increment in [–4 h, –2 h] is up to 54.52%, greater than the relative increment in [–2 h, 0] (36.04%). For 1.5 h to 3 h after the onsets, the relative increments in both [–4 h, –2 h] and [0, 2 h] are the same as above, but the speed in [–2 h, 0] starts to increase, with the relative increment being 20.08%. The value of increment is the same as the results of Ritter’s (2010) study (20 m·s−1). It can be concluded that, after substorm onsets, the thermospheric response occurs quickly on the western side ([–4 h, –2 h]), then moves to the east, with the main response range being within 2 h MLT, especially in the western side.
From the above analysis, we conclude that the variations of zonal wind after the occurrence of substorms are similar to the variations of plasma convection, for example, the speed increasing after substorms, east-west regional difference, and difference in the position of the peaks. However, the zonal wind response time to the substorms has a 1.5 h delay compared with plasma convection, which shows that the plasma’s response is faster than that of the neutral components. This is easy to understand: as the neutral mass is heavier than the ion, their responses should lag behind those of the plasma.
5 SUMMARYThe present work statistically investigates the temporal and spatial variations of plasma convection velocity (Vy) and thermospheric zonal wind velocity (Uy) during substorm periods by using both CHAMP and DMSP satellite observations from years of 2001 to 2005. Some interesting features were disclosed:
(1) Substorms can significantly enhance the plasma convection velocity (Vy). Vy increases 1.5 h after onsets, and the centers move equatorward. In the subsequent 1.5 h, Vy decreases in intensity and retreat poleward.
(2) The relative increases of Vy are largest on the westside of onsets (–2 h, 0), then next on the eastside (0, 2 h). The relative increase is smallest in the interval from MLTonset –4 h to MLTonset –2 h. This indicates that the substorm effects are largest within 2 h MLT centered around onsets.
(3) The zonal wind, Uy, keeps increasing for 3 h after substorm and shifts equatorward. The response to the substorm has a 1.5 h time delay as compared to Vy. The substorm effect is largest within 2 h MLT centered around onsets.
ACKNOWLEDGMENTSThis work was supported by the National Natural Science Foundation of China (41222030, 41221003, 41431073).
| [] | Akasofu S I. 1964. The development of the auroral substorm. Planet. Space Sci. , 12 (4) : 273-282. DOI:10.1016/0032-0633(64)90151-5 |
| [] | Alexeev I I, Belenkaya E S, Clauer C R. 2000. A model of region 1 field-aligned currents dependent on ionospheric conductivity and solar wind parameters. J. Geophys. Res. , 105 (A9) : 21119-21127. DOI:10.1029/2000JA900052 |
| [] | Angelopoulos V, Baumjohann W, Kennel C F, et al. 1992. Bursty bulk flows in the inner central plasma sheet. J. Geophys. Res. , 97 (A4) : 4027-4039. DOI:10.1029/91JA02701 |
| [] | Baumjohann W, Paschmann G, Lühr H. 1990. Characteristics of high-speed ion flows in the plasma sheet. J. Geophys. Res. , 95 (A4) : 3801-3809. DOI:10.1029/JA095iA04p03801 |
| [] | Clausen L B N, Milan S E, Grocott A. 2014. Thermospheric density perturbations in response to substorms. J. Geophys. Res. , 119 (6) : 4441-4455. DOI:10.1002/2014JA019837 |
| [] | Demars H G, Schunk R W. 2007. Thermospheric response to ion heating in the dayside cusp. Journal of Atmospheric and Solar-Terrestrial Physics , 69 (6) : 649-660. DOI:10.1016/j.jastp.2006.11.002 |
| [] | Doornbos E, Van Den Ijssel J, Lühr H, et al. 2010. Neutral density and crosswind determination from arbitrarily oriented multiaxis accelerometers on satellites. Journal of Spacecraft Rockets , 47 (4) : 580-589. DOI:10.2514/1.48114 |
| [] | Emmert J T, Fejer B G, Shepherd G G, et al. 2002. Altitude dependence of middle and low-latitude daytime thermospheric disturbance winds measured by WINDⅡ. J. Geophys. Res. , 107 (A12) : SIA 19-1-SIA 19-15. DOI:10.1029/2002JA009646 |
| [] | Emmert J T, Hernandez G, Jarvis M J, et al. 2006. Climatologies of nighttime upper thermospheric winds measured by ground-based Fabry-Perot interferometers during geomagnetically quiet conditions:2. High-latitude circulation and interplanetary magnetic field dependence. J. Geophys. Res. , 111 (A12) . DOI:10.1029/2006JA011949 |
| [] | Fujiwara H, Maeda S, Fukunishi H, et al. 1996. Global variations of thermospheric winds and temperatures caused by substorm energy injection. J. Geophys. Res. , 101 (A1) : 225-239. DOI:10.1029/95JA01157 |
| [] | Gérard J. 2004. The local time propagation of electron and proton shock-induced aurora and the role of the interplanetary magnetic field and solar wind.//AGU Spring Meeting 2004, Abstracts SM53A-01. |
| [] | Grocott A, Wild J A, Milan S E, et al. 2009. Superposed epoch analysis of the ionospheric convection evolution during substorms:Onset latitude dependence. Ann. Geophys. , 27 (2) : 591-600. DOI:10.5194/angeo-27-591-2009 |
| [] | Hairston M R, Heelis R A. 1993. High-latitude electric field studies using DMSP data[Ph. D. thesis]. Texas:Texas University. |
| [] | Heelis R A, Hairston M R. 1990. Studies of ionospheric dynamics utilizing data from DMSP[Ph. D. thesis]. Texas:Texas University. |
| [] | Kamide Y, Richmond A D, Emery B A, et al. 1994. Ground-based studies of ionospheric convection associated with substorm expansion. J. Geophys. Res. , 99 (A10) : 19451-19466. DOI:10.1029/94JA01625 |
| [] | Kamide Y, Chian A C L. 2007. Handbook of the Solar-terrestrial Environment. Berlin Heidelberg:Springer. |
| [] | Kullen A, Karlsson T. 2004. On the relation between solar wind, pseudobreakups, and substorms. J. Geophys. Res. , 109 (A12) . DOI:10.1029/2004JA010488 |
| [] | Lühr H, Park J, Ritter P, et al. 2012. In-Situ CHAMP observation of ionosphere-thermosphere coupling. Space Sci. Rev. , 168 (1-4) : 237-260. DOI:10.1007/s11214-011-9798-4 |
| [] | Maltsev Y P, Arykov A A, Belova E G, et al. 1996. Magnetic flux redistribution in the storm time magnetosphere. J. Geophys. Res. , 101 (A4) : 7697-7704. DOI:10.1029/95JA03709 |
| [] | Mcpherron R L. 1970. Growth phase of magnetospheric substorms. J. Geophys. Res. , 75 (28) : 5592-5599. DOI:10.1029/JA075i028p05592 |
| [] | Newell P T, Gjerloev J W. 2011. Evaluation of SuperMAG auroral electrojet indices as indicators of substorms and auroral power. J. Geophys. Res. , 116 (A12) . DOI:10.1029/2011JA016779 |
| [] | Reigber C, Lühr H, Schwintzer P. 2002. CHAMP mission status. Adv. Space Res. , 30 (2) : 129-134. DOI:10.1016/S0273-1177(02)00276-4 |
| [] | Rentz S, Lühr H. 2008. Climatology of the cusp-related thermospheric mass density anomaly, as derived from CHAMP observations. Ann. Geophys. , 26 (9) : 2807-2823. DOI:10.5194/angeo-26-2807-2008 |
| [] | Rich F J, Hairston M. 1994. Large-scale convection patterns observed by DMSP. J. Geophys. Res. , 99 (A3) : 3827-3844. DOI:10.1029/93JA03296 |
| [] | Ritter P, Lühr H, Doornbos E. 2010. Substorm-related thermospheric density and wind disturbances derived from CHAMP observations. Ann. Geophys. , 28 (6) : 1207-1220. DOI:10.5194/angeo-28-1207-2010 |
| [] | Sandholt P E, Andalsvik Y L, Farrugia C J. 2012. The pulsed nature of the nightside contribution to polar cap convection:Repetitive substorm activity under steady interplanetary driving. Ann. Geophys. , 30 (10) : 1539-1553. DOI:10.5194/angeo-30-1539-2012 |
| [] | Schindler K, Birn J. 1978. Magnetospheric physics. Phys. Rep. , 47 (2) : 109-165. DOI:10.1016/0370-1573(78)90016-9 |
| [] | Schlegel K, Lühr H, St.-Maurice J P, et al. 2005. Thermospheric density structures over the polar regions observed with CHAMP. Ann. Geophys. , 23 (5) : 1659-1672. DOI:10.5194/angeo-23-1659-2005 |
| [] | Schulz M. 1997. Direct influence of ring current on auroral oval diameter. J. Geophys. Res. , 102 (A7) : 14149-14154. DOI:10.1029/97JA00827 |
| [] | Wang H, Lühr H. 2011. The efficiency of mechanisms driving Subauroral Polarization Streams (SAPS). Ann. Geophy. , 29 (7) : 1277-1286. DOI:10.5194/angeo-29-1277-2011 |
| [] | Wang H, Lühr H, Häusler K, et al. 2011. Effect of subauroral polarization streams on the thermosphere:A statistical study. J. Geophys. Res. , 116 (A3) . DOI:10.1029/2010JA016236 |
| [] | Wang H, Lühr H, Ritter P, et al. 2012. Temporal and spatial effects of subauroral polarization streams on the thermospheric dynamics. J. Geophys. Res. , 117 (A11) : A11307. |
| [] | Xing X, Lyons L R, Angelopoulos V, et al. 2010. Plasma sheet pressure evolution related to substorms. J. Geophys. Res. , 115 (A1) : A01212.. |