 2016, Vol. 59


2 Center of Development and Research, China Geological Surveys, Beijing 100037, China;
3 Technical Guidance Center for Mineral Exploration, Ministry of Land and Resources, Beijing 100037, China;
4 Second Institute of Oceanography, State Oceanic Administration, Hangzhou 310012, China;
5 Key Laboratory of Submarine Geoscience, State Oceanic Administration, Hangzhou 310012, China
Edge detection is an important part of the interpretation of potential field data, which has been widely used as a tool in exploration technologies for mineral resources, energy resources and regional structure. There are many filters employed to detect and enhance edges. Most of them are based on the horizontal derivatives and vertical derivative of potential field data. The maximum values of total horizontal derivative detect the edges (Cordell, 1979; Cordell and Grauch, 1985). Nabighian (1984) and Roest et al. (1992) have proved that the maximum values of analytic signal can directly outline the edges of the density and magnetism. Hsu et al. (1996) proposed the enhanced analytic signal method, which uses the high order derivatives to enhance the resolution. Cooper et al. (2004) used the different order vertical derivatives to enhance the identified edges, which can effectively enhance the details of edges. However, all of them cannot equalize the amplitude of the edges of shallow and deep geological bodies simultaneously.
Recently, many different balanced filters have been developed, which can equalize the edge amplitude of different anomaly magnitude of the sources. Miller and Singh (1994) use the ratio of vertical derivative and total horizontal derivative to detect the edge, called as TDR. The expression is

|
(1) |
This was the first published balanced edge detector which can balance the amplitude of large and small anomalies. Based on this method, many scholars have proposed different balanced filters, such as Theta map, TDX, and total horizontal derivatives of the TDR (Wijns et al., 2005; Cooper and Cowan, 2006; Verduzco and Fairhead, 2004). However, all these methods may bring some additional false edges besides the real true edges, especially when the anomalies include both positive and negative anomalies simultaneously. According to this disadvantage, some authors have made an improvement on them. Most of them use a positive constant p in the normalization factors to remove the additional false edge information (Cooper, 2013; Li et al., 2014; Yuan et al., 2014; Yuan et al., 2015). However, the value of p is selected by experience, which is a subjective method. The bigger value of p can remove the additional false edges better, but it can reduce the resolution of the identified edges. The smaller value of p will reduce the ability of removing the false edge. Therefore, this method is not practical in real data processing.
On account of the potential field anomalies including both positive and negative anomaly simultaneously, this paper proposed a new method using the analytic signal amplitude and its first order vertical derivatives to define the tilt angle to identify the edges of the source, called the enhanced analytic signal tilt angle, which can effectively overcome the shortcoming of the traditional methods.
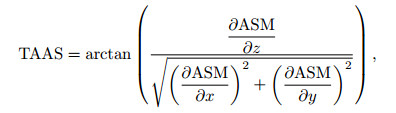
2 ENHANCED ANALYTIC SIGNAL TILT ANGLEThis paper uses the analytic signal amplitude to define the tilt angle to delineate the edges of potential field data. The expression is
|
(2) |
where the ASM is the analytic signal amplitude,
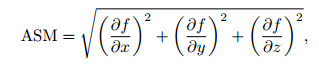
|
(3) |
f is the measured potential field data.
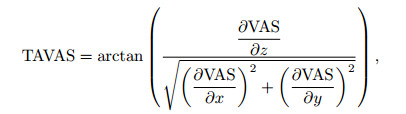
In order to improve the resolution of the edge results, we use the first order vertical derivatives of analytic signal amplitude to define the edge detector, the expression is
|
(4) |
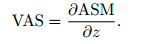
where, VAS is the first order vertical derivative of the ASM,
|
(5) |
However, Florio et al. (2006) pointed out that the analytic signal amplitude of potential field data is a nonharmonic function. Therefore, there is a big difference of the first order vertical derivatives of analytic signal amplitude calculated by direct expression and calculated by the vertical derivative operator in frequency domain, which can enhance the high frequency component. Therefore, all the vertical derivatives in the paper are calculated by the vertical derivative operator. In the expression of TAVAS, we need to calculate the first order vertical derivative of VAS, which can be treated as the second order vertical derivative of the analytic signal amplitude,
|
(6) |
We can use the Eq.(6) to replace the derivative in Eq.(4).
The horizontal derivatives of TAAS and TAVAS in x and y directions are calculated by the center difference method. The expression of the center difference in x direction is
|
(7) |
Where T represents f, ASM and VAS. Also, the expression of the center difference in y direction is
|
(8) |
Both these equations can be obtained by the MATLAB build-in function gradient.m.
The implementation of the enhanced analytic signal tilt angle is mainly divided into three steps:
(1) Calculate the derivatives of potential field data in x, y and z directions, and then use Eq.(3) to calculate the analytic signal amplitude.
(2) Calculate the derivatives of the analytic signal amplitude ASM in x, y and z directions, and then use Eq.(2) to define the edge detector TAAS.
(3) Calculate the first order vertical derivative of the ASM to get the VAS, and then calculate the derivatives of VAS in x, y and z directions, finally define the edge detector TAVAS.
In order to validate the feasibility of the enhanced analytic signal tilt angle, we select traditional edge detectors analytic signal amplitude ASM, total horizontal derivatives THD, tilt angle TDR, Theta map and TDX to compare the results.
3 SYNTHETIC MODEL EXPERIMENTSIn this section, we construct a gravity gradient anomaly model, which includes three identical verticalsided prisms with top depths of 4 km (labeled 1), 1 km (labeled 2), and 2.5 km (labeled 3), respectively. The thicknesses of all prisms are 1 km. The contrasted densities of prisms are 0.2×10³ kg·cm−3. Fig. 1 displays the plan view and 3D view of the model. Fig. 2a shows the synthetic gravity anomaly. Figs. 2(b-h) show the edge results of the model delineated by ASM, THD, TDR, Theta map, TDX, TAAS and TAVAS. Compared with the results, we can get that ASM cannot display the edges of shallow and deep geological bodies simultaneously. The edge amplitude of shallow body is large, and the edge amplitude of the deep source is small. The large edge amplitude will blur the small edge amplitude. Therefore, the ASM will not outline the edges of deep source clearly. Compared with the ASM, THD can extract the edges with higher resolution. Also, the edge amplitude of the deep source is blurred. However, methods TDR, Theta map, TDX, TAAS and TAVAS all can balance the edge amplitude size of geological bodies with different buried depth, and display the edges of shallow and deep sources simultaneously. Compared with TDR, Theta map and TDX, our new proposed methods TAAS and TAVAS can outline the edges more precisely, especial for the deep source. Also, the edge resolution identified by TAAS and TAVAS is higher than the results of Theta map and TDX.

|
Fig. 1 (a) Plan view of the model; (b) 3D view of the model |

|
Fig. 2 (a) Synthetic gravity anomaly of model 1; (b) ASM of the data; (c) THD of the data; (d) TDR of the data; (e) Theta of the data; (f) TDX of the data; (g) TAAS of the data; (h) TAVAS of the data |
In order to validate the effectiveness of the enhanced analytic signal tilt angle method, we construct a more complex model, which includes both positive and negative anomalies simultaneously. The new model is same with the model 1, but the contrast density of prism 3 is –0.3×10³ kg·cm−3. Fig. 3a shows the gravity anomaly of model 2. Figs. 3(b-h) show the edge results of ASM, THD, TDR, Theta map, TDX, TAAS and TAVAS. We can see that, traditional edge detectors TDR, Theta map and TDX may bring some additional false edge information when the gravity anomalies contain both positive and negative anomaly simultaneously. Also, the edge amplitude of deep source identified by ASM and THD is small. However, our new methods TAAS and TAVAS can not only delineate the edges clearly and precisely, also do not bring any false information. And, the edge resolution of TAAS and TAVAS is higher than others, especially the TAVAS.

|
Fig. 3 (a) Synthetic gravity anomaly of model 2; (b) ASM of the data; (c) THDR of the data; (d) TDR of the data; (e) Theta of the data; (f) TDX of the data; (g) TAAS of the data; (h) TAVAS of the data |
In order to test the stability in the presence of random noise, we added Gaussian random noise with amplitude equal to 10% of the maximum amplitude of the gravity data in Fig. 3a to the gravity anomaly, shown in Fig. 4a. Figs. 4(b-h) display the edge results of ASM, THD, TDR, Theta map, TDX, TAAS and TAVAS. Compared with Fig. 3, we can get that traditional methods ASM and THD are less affected by noise. Methods TDR, Theta map and TDX can still extract the edges clearly. However, our new proposed methods TAAS and TAVAS are greatly influenced by noise. The main reason is that these two methods are defined by the second and third order derivatives of the gravity anomaly. As we known, high order derivatives will magnify the noise. Therefore, we must reduce the noise influence before using TAAS and TAVAS to detect the edges. According to this noisy model data, we design a Gaussian low-pass filter with cutoff wavelength as 300 m to filter the noisy data. The filtered data is shown in Fig. 5a. Figs. 5(b-h) display the edge results of ASM, THD, TDR, Theta map, TDX, TAAS and TAVAS. Comparing the results, the edge resolution of traditional detectors all have been decreased. Also, the traditional balanced detectors TDR, Theta map and TDX have introduced an amount of false edge information. However, new methods TAAS and TAVAS can outline the edges of geological bodies precisely, and without any false edge information.

|
Fig. 4 (a) Synthetic gravity anomaly of model 2 corrupted with 10% Gaussian noise; (b) ASM of the noisy data; (c) THD of the noisy data; (d) TDR of the noisy data; (e) Theta of the noisy data; (f) TDX of the noisy data; (g) TAAS of the noisy data; (h) TAVAS of the noisy data |

|
Fig. 5 (a) Filtered gravity anomaly; (b) ASM of the filtered data; (c) THD of the filtered data; (d) TDR of the filtered data; (e) Theta of the filtered data; (f) TDX of the filtered data; (g) TAAS of the filtered data; (h) TAVAS of the filtered data |
In order to test the application in real case, we use the method to process the Bouguer gravity anomaly data of Sichuan Basin, Southwest China, on a scale of 1:1000000, provided by the National Administration of Surveying, Mapping, and Geoinformation, China. Fig. 6a shows the gravity anomaly. The black solid lines in Fig. 6 are the horizontal position of the known structures (Ma et al., 2012; Yuan and Yu, 2015). We use the methods proposed above to process this data to delineate the line structures. The results are shown in Figs. 6(b-h).

|
Fig. 6 (a) Measured gravity anomaly in Sichuan basin, China; (b) ASM of the data; (c) THD of the data; (d) TDR of the data; (e) Theta of the data; (f) TDX of the data; (g) TAAS of the data; (h) TAVAS of the data |
We can see that the identification ability of ASM and THD is bad, which can only identify part of the known structures. Also, the identified edges are not clear, shown in Figs. 6(b-c). Compared with ASM and THD, TDR, Theta map and TDX have a higher identification ability. However, they also can identify parts of the known structures, shown in Figs. 6(d-f). Our new proposed edge detectors TAAS and TAVAS can not only highlight all the known structures, also reveal more details.
5 CONCLUSIONSThis paper used the analytic signal amplitude and tilt angle to define two edge detectors TAAS and TAVAS. The higher order derivatives of potential field data used in these two methods enhance the noise influence. Therefore, when we use the new proposed methods, we must reduce the noise firstly. The methods are tested with synthetic model data. The extracted edges of TAAS and TAVAS have a higher accuracy and resolution. When the model is complex, especial containing both positive and negative anomalies simultaneously, traditional balanced edge detectors TDR, Theta and TDX will bring some additional false edges, however, enhanced analytic signal tilt angle can effectively avoid it. Also, compared with the traditional detectors, the enhanced analytic signal tilt angle can identify the edges more clearly and precisely, and reveal more details, which is conducive to find the small structure.
ACKNOWLEDGMENTSThis work was financially supported by State Key Laboratory of Marine Geology, Tongji University (MGK1610); Basic Scientific Research Special Fund Project of Second Institute of Oceanography, State Oceanic Administration (14275-10); Global change and air-sea interaction (GASI-GEOGE-05).
| [] | Cooper G R J, Cowan D R. 2004. Filtering using variable order vertical derivatives. Computers & Geosciences , 30 (5) : 455-459. |
| [] | Cooper G R J, Cowan D R. 2006. Enhancing potential field data using filters based on the local phase. Computers & Geosciences , 32 (10) : 1585-1591. |
| [] | Cooper G R J. 2013. Reply to a discussion about the "Hyperbolic tilt angle method" by Zhou et al. Computers & Geosciences , 52 : 496-497. |
| [] | Cordell L. 1979. Gravimetric expression of graben faulting in Santa Fe Country and the Espanola Basin, New Mexico.//New Mexico Geological Society, Guidebook, 30th Field Conference, 59-64. |
| [] | Cordell L, Grauch V J S. 1985. Mapping basement magnetization zones from aeromagnetic data in the San Juan basin, New Mexico.//Hinzc W J ed. The Utility of Regional Gravity and Magnetic Anomaly Maps. Society of Exploration Geophysics, 181-197. |
| [] | Florio G, Fedi M, Pasteka R. 2006. On the application of Euler deconvolution to the analytic signal. Geophysics , 71 (6) : L87-L93. DOI:10.1190/1.2360204 |
| [] | Hsu S H, Sibuet J C, Shyu C T. 1996. High-resolution detection of geologic boundaries from potential-field anomalies:An enhanced analytic signal technique. Geophysics , 61 (2) : 373-386. DOI:10.1190/1.1443966 |
| [] | Li L L, Huang D N, Han L G, et al. 2014. Optimised edge detection filters in the interpretation of potential field data. Exploration Geophysics , 45 (3) : 171-176. DOI:10.1071/EG13059 |
| [] | Ma G Q, Huang D N, Yu P, et al. 2012. Application of improved balancing filters to edge identification of potential field data. Chinese J. Geophys. (in Chinese) , 55 (12) : 4288-4295. DOI:10.6038/j.issn.0001-5733.2012.12.040 |
| [] | Miller H G, Singh V. 1994. Potential field tilta new concept for location of potential field sources. Journal of Applied Geophysics , 32 (2-3) : 213-217. DOI:10.1016/0926-9851(94)90022-1 |
| [] | Nabighian M N. 1984. Toward a three-dimensional automatic interpretation of potential field data via generalized Hilbert transforms:Fundamental relations. Geophysics , 49 (6) : 780-786. DOI:10.1190/1.1441706 |
| [] | Roest W R, Verhoef J, Pilkington M. 1992. Magnetic interpretation using the 3-D analytic signal. Geophysics , 57 (1) : 116-125. DOI:10.1190/1.1443174 |
| [] | Verduzco B, Fairhead J D, Green C M, et al. 2004. New insights into magnetic derivatives for structural mapping. The Leading Edge , 23 (2) : 116-119. DOI:10.1190/1.1651454 |
| [] | Wijns C, Perez C, Kowalczyk P. 2005. Theta map:Edge detection in magnetic data. Geophysics , 70 (4) : L39-L43. DOI:10.1190/1.1988184 |
| [] | Yuan Y, Huang D N, Yu Q L, et al. 2014. Edge detection of potential field data with improved structure tensor methods. Journal of Applied Geophysics , 108 : 35-42. DOI:10.1016/j.jappgeo.2014.06.013 |
| [] | Yuan Y, Yu Q L. 2015. Edge detection in potential-field gradient tensor data by use of improved horizontal analytical signal methods. Pure and Applied Geophysics , 172 (2) : 461-472. DOI:10.1007/s00024-014-0880-1 |
| [] | Yuan Y, Huang D N, Yu Q L. 2015. Using enhanced directional total horizontal derivatives to detect the edges of potential-field full tensor data. Chinese J. Geophys. (in Chinese) , 58 (7) : 2556-2565. DOI:10.6038/cjg20150730 |