 2016, Vol. 59


2 Laboratory for Marine Mineral Resources, Qingdao National Laboratory for Marine Science and Technology, Qingdao 266061, China;
3 Institute of Deep-sea Science and Engineering, Chinese Academy of Sciences, Sanya 572000, China;
4 CSIR-National Geophysical Research Institute, Hyderabad 500007, India;
5 Hangzhou Research Institute of Geology, PetroChina, Hangzhou 310023, China
Gas hydrates are naturally occurring ice-like substances composed of water and natural gas, and can be found in the deep water basin and permafrost around the world (Kvenvolden, 1993; Chen et al., 2005). Bottomsimulating reflectors (BSRs) on the seismic reflection profiles are the important indicator for most oceanic occurrences of gas hydrates (Liu et al., 2005; Ruan et al., 2006; Zhang et al., 2011). The BSR coincides with the base of the gas hydrate stability zone on the seismic profiles and is generated by the impedance interface between gas hydrate-bearing sediment above with high P-wave velocity and free gas-bearing sediment below with low P-wave velocity. So the BSR intensity of reflection is related to the saturation and distribution pattern of both gas hydrate and free gas. To estimate the saturation of gas hydrate or free gas, one widely used direct approach is using theoretical or empirical formula to calculate the logging data (Wang et al., 2006; Wang et al., 2011; Wang et al., 2013). The other indirect method is analyzing the reflection coefficients of the BSR versus offset or angle (AVO) (Hyndman and Spence, 1992; Müller et al., 2007). However, it is still unclear about the contribution of gas hydrate and free gas as well as their distribution pattern to the impedance contrast at BSR.
A clear BSR exists on the seismic profile in the Krishna-Godavari (K-G) basin (Fig. 1) eastern offshore India (Jaiswal et al., 2012). To investigate the geological setting and controls on gas hydrate occurrences in K-G basin, 15 sites were drilled by the Indian National Gas Hydrate Program Expedition 01 (NGHP-01) in 2006 and gas hydrate filled in veins/fractures was discovered at site NGHP-01-10. The gas hydrate saturations estimated from P-wave velocity based on the anisotropic model were about 25%, which agrees with the calculation of pressure cores (Collett et al., 2008; Wang et al., 2013). The BSR is characterized by weak amplitude and discontinuous reflection in K-G basin. Bright spots, present below the BSR (Fig. 2), were indicated to be caused by the presence of free gas (Müller et al., 2007). The diapirs are well developed in K-G basin and can provide the pathways for upward migration of free gas. And a lot of fractures near BSR were considered to be the reason that BSR shows weak amplitude (Collett et al., 2008; Wu et al., 2009; Fohrmann and Pecher, 2012; Jaiswal et al., 2012; Wang et al., 2014). Seismic amplitude analysis can qualitatively indicate that there is free gas below BSR, but cannot determine the saturation and distribution pattern of free gas. Many researchers have focused on the seismic survey and interpretation, logging evaluation, rock physics model and reservoir system of gas hydrate in Shenhu area, South China Sea (Wu et al., 2007; Zhang et al., 2007; He et al., 2009; Yan and Chen et al., 2009; Luan et al., 2010; Zhang et al., 2011; Wang et al., 2011; Ning et al., 2013; Yu et al., 2014), whereas few studied the saturation and distribution pattern of free gas. So in this paper, we intend to use AVO analysis to quantitatively assess the saturation and distribution pattern of free gas based on the prestack seismic data acquired in K-G basin, and the rock physics model of gas hydrate and gas hydrate saturation estimated from logging data. We expect this work could be referential to estimate methane resources in South China Sea.

|
Fig. 1 Location map of K-G basin (left). The relative positions of hole NGHP01-10A and seismic profile gdsw16 are shown in the right chart |

|
Fig. 2 The seismic profile gdsw16 through Hole 10A |
Due to the rifting between India and Australia/Antarctica during Late Jurassic-Early Cretaceous (Powell et al., 1988), many petroliferous basins such as K-G basin were formed in the eastern continental margin of India. K-G basin occupies an area of 28000 km2 onland and 145000 km2 offshore and both Krishna and Godavari rivers brought large detrital sediments into the basin from Cretaceous to nowadays. So the thickness of the sediment in K-G basin can vary from 3 to 5 km in the onshore region and may exceed 8 km in the offshore region (Rao, 2001; Prabhakar and Zutshi, 1993). The sedimentation rate was changing all the time, but was dramatically increased during Neogene period because of the initial collision between the Indian and Eurasian plate, and subsequent uplift of Himalaya (Subrahmanyam and Chand, 2006).
The study area of this paper lies in the continental slope region of K-G basin (Fig. 1), which is a part of the eastern continental margin of India. A mound exists on the sub-bottom and multiple channel seismic (MCS) profiles, might be formed by the frontal thrust fault or the mud diapir (Fig. 2). Near the mound, a well-developed network of fractures acts as permeable pathways for the deep fluid. So the mound may be the potential sites of gas hydrate and cold seep accumulation areas (Dewangan et al., 2010). Faults also developed well near site NGHP01-10 and there exists a clear BSR on the MCS profiles (Fig. 2). The drilling, coring, logging and X-ray imaging data all indicate the presence of gas hydrate and the gas hydrate saturations estimated from pressure coring were between 17.6%~25.4% (Collett et al., 2008).
3 DATA AND METHODS 3.1 Seismic Data and ProcessingMCS data were acquired by Oil and Natural Gas Commission Ltd. (ONGC) using the airgun array with the volume of 0.016387 m3 and the interval of 12.5 m. The other acquisition parameters were set as follows: 120 channels with interval of 12.5 having a minimum offset of 75 m, 1 ms sampling rate and 5 s record length.
At site NGHP01-10, water depth and the base of gas hydrate stability zone are about 1038 m and 156 meter below seafloor (mbsf), respectively. The maximum incident angle is about 35° from the MCS reflection data in this area and the data can be used to analyze the detailed variations of amplitudes versus incident angles at BSRs. The prestack data were processed with preserved amplitudes at BSRs and the AVO processing sequence (Fig. 3) mainly includes trace editing, bandpass filter, velocity analysis, spherical divergence correction, normal moveout correction, dip moveout correction, source directivity correction (Sheriff and Geldart, 1995) and receiver directivity correction (Hyndman and Spence, 1992). Velocity analysis has been carried out at 62.5 m of 10-CDP intervals and refined to be 5-CDP intervals at BSRs. Since AVO modeling curves are in angle domain, we also need to use smoothed NMO interval velocities to transfer offset gathers into angle domain gathers using ray theory after NMO correction, which can make the practical and modeling AVO curves match.

|
Fig. 3 Workflow for true amplitude processing |
P-wave, S-wave velocity and density are the mandatory parameters for AVO modeling. The hole NGHP01-10A, completion depth of 188 mbsf, has penetrated the BSR and P-wave velocity and density logging without S-wave velocity was conducted. For the unconsolidated gas hydrate sediments with high porosity, there are different filling models to describe the microstructure between gas hydrate and sediments (Dai et al., 2008), while EMT model is relatively suitable for the prediction of P-wave and S-wave velocities of gas hydrate section (Ecker et al., 2000). The rock physics model of EMT uses effective pressure, porosity, saturation, mineralogy and fluid property to calculate the velocities of sediments. The model assumes a critical porosity exists between 36% and 40% for the sediments and the elasticity module calculation of rock frame is different for different porosities. The method involves five steps including the moduli calculation of the mineral phase using Hill’s average, the Hertz-Mindlin (H-M) moduli calculation using H-M theory, the moduli calculation of dry frame using Hashin-Shtrikman theory, the saturated moduli calculation using Gassmann equation, and P-wave and S-wave velocities calculation (Ecker et al., 2000; Dewangan et al., 2009). The elastic parameters and mineralogy of calculation are shown in Table 1.
|
|
Table 1 Elastic parameters and mineralogy(Ghosh et al., 2010) |

The depth variations of P-wave and S-wave velocities (Fig. 4c), calculated from density, porosity and saturation of logging data using EMT (Figs. 4a and 4b) at hole NGHP01-10A and 10D, are similar to the measured velocities with the mean error of 2.5% and 4.3%, respectively, which illustrates the rock physics model of EMT works well for the prediction of P-wave and S-wave velocities of the shallow sediments in the study area. For the gas hydrate-bearing sediments, P-wave and S-wave velocities are directly proportional to the gas hydrate saturation and the higher the saturation is, the more rapidly velocity increases (red and green lines in Fig. 5a), while the density decreases slightly (blue line in Fig. 5a). Poisson’s ratio remains about the same at low saturation and slightly reduces at high saturation (magenta line in Fig. 5a). For free gas-bearing sediments, the velocities are obviously different from those of gas hydrate-bearing sediments. P-wave velocities of homogeneous distribution decrease rapidly at low gas saturation, and slightly increase at saturation of 20% (red solid line in Fig. 5b), while P-wave velocities of patchy distribution have been trending down and the lower the saturation is, the more rapidly the velocity decreases. When gas saturation reaches up to 40%, P-wave velocities are tending towards stability (red dotted line in Fig. 5b). Since S-wave travels only through solid, both S-wave velocities of free gas-bearing sediments in two distributions are consistent and increase with the increment of free gas saturation (green line in Fig. 5b). The density of free gas-bearing sediments is in decline (blue line in Fig. 5b) and the rate of the decline is more than that of gas hydrate-bearing sediments. Both Poisson’s ratios in two distributions also decrease evidently and their shapes are almost consistent with that of P-wave velocity. The analysis illustrates that elastic properties of sediments will change due to gas hydrate and free gas which lead the sediments to be high impendence above the BSR and low impendence below the BSR, respectively. So the AVO responses of BSR are different in the conditions of the same hydrate saturation but different gas saturation, which is the basis for AVO to quantitatively estimate the free gas saturation.

|
Fig. 4 Wireline logs at hole NGHP01-10A and 10D |

|
Fig. 5 Curves of velocity and density with saturation changes from 0 to 1 |
AVO can be used to determine the lithology and rock physic parameters across the reflection interface by transforming the amplitude versus offset or angle into the reflection coefficient versus offset or angle (Ostrander, 1084). There exists impendence difference between the gas hydrate-bearing sediments above BSR and the free gas-bearing sediments below BSR. So the AVO of BSR is useful to analyze the elastic properties of the gas hydrate-bearing and free gas-bearing sediments. The reflection coefficient versus angle, depends on the density, P-wave and S-wave velocities across the interface, is fully described by the Knott and Zoeppritz equations at an interface separating two semi-infinite isotropic elastic media. In the AVO modeling, we use the exact solution to calculate the reflection coefficient given in concise matrix form by Aki and Richards (2002).
4 QUANTITATIVE SEISMIC ESTIMATION OF FREE GAS 4.1 Horizon CalibrationThe accurate BSR depth is identified by reflection coefficients calculation, wavelet extraction, synthetic seismogram, and horizon calibration using the logging and seismic data of hole NGHP01-10A (Fig. 6). Reflection coefficients are calculated by density and velocity logging data. In order to achieve high resolution, a Ricker wavelet with dominant frequency of 50 Hz and duration of 200 ms is used because of the shallow gas hydrate-sediments and high frequency of the seismic data. The correlation coefficient between blue synthetic seismogram and red borehole-side trace in Fig. 6 can reach up to 0.8. At hole NGHP01-10A, BSR depth is at 156 mbsf where P-wave velocity, density, porosity and gas hydrate saturation are 1.57 km·s−1, 1.54 g·cm−3, 70%, 12%, respectively, which are the rock physic parameters for AVO modeling.

|
Fig. 6 Seismogram synthesis |
In order to obtain the common midpoint (CMP) gathers as shown in Fig. 7, the original seismic data were processed to preserve true amplitude information by the processing flow in Fig. 3. Red and green dotted lines represent the seafloor and BSR calibrated in Fig. 6, respectively. CMP gathers show that a strong BSR reflection is characterized by reversed polarity compared to the seafloor and the amplitudes above the BSR are weaker than those of seafloor and BSR.

|
Fig. 7 Common midpoint gather after normal moveout correction |
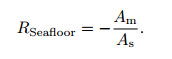
Since the actual values of seismic data are amplitude, the amplitude information need to be transformed into reflection coefficient at the BSR using the reflection amplitudes of seafloor, BSR and seafloor multiple (Warner, 1990). Assuming the seafloor is horizontal and smooth, the vertical incidence seafloor reflection coefficient RSeafloor was firstly calculated from the amplitudes of primary seafloor reflection As and the first seafloor multiple Am using Eq.(1):
|
(1) |
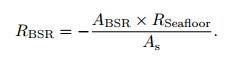
According to the velocity model, the offset gather of CMP was transformed into angle gather. Receiver directivity (Hyndman and Spence, 1992) and source directivity (Sheriff and Geldart, 1995) correction were then used to correct the BSR amplitude response (ABSR). And reflection coefficient of BSR (RBSR) can be derived from
|
(2) |
The calculated reflection coefficients versus angle of BSR were shown in Fig. 8 with blue dotted line. The absolute value of normal reflection coefficient is about 0.1 in the normal incidence with 0° and increases with increasing angle. As the angle increases to 35°, the value is close to 0.15. According to the classification of AVO curves (Castagna and Swan, 1997), Class Ⅰ underlying sediments are of higher impendence than the overlying unit. The normal incidence reflection coefficient is positive and can decrease to negative with increasing angle. Class Ⅱ underlying sediments have about the same impendence as the overlying unit. The normal incidence reflection coefficient may be positive or negative and the absolute value increases with increasing angle. Class Ⅲ underlying sediments are of lower impendence than overlying unit. The normal incidence reflection coefficient is negative and the absolute value increases with increasing angle. Class Ⅳ underlying sediments have much lower impendence than overlying unit. The normal incidence reflection coefficient is negative and the absolute value decreases with increasing angle. In Fig. 8, the reflection coefficient of BSR at hole NGHP01-10A obviously belongs to Class Ⅲ with the negative reflection coefficient and the increasing absolute value versus angle because of impendence difference between high impendence gas hydrate-bearing sediments above and low impendence free gas-bearing sediments below (Fig. 5). However, the reflection coefficient is significantly different from that of Class Ⅳ in the anisotropic sediments with fracture-filled gas hydrate (Sriram et al., 2013). Comparative analysis reveals that the data are from different locations, which indicates the BSR reflection coefficient of the anisotropic fracture-filled gas hydrate layer may be Class Ⅲ or Ⅳ AVO.

|
Fig. 8 Reflection coefficient of the BSRs versus incidence angles at NGHP01-10A |
After horizon calibration in Fig. 6, BSR depth at hole NGHP01-10A was accurately recognized at 156 mbsf as well as P-wave velocity, density, porosity and gas hydrate saturation from logging data. Assuming gas hydrate saturation remains constant, we use EMT to calculate S-wave velocity of gas hydrate-bearing sediments and elastic parameters of free gas-bearing sediments with different saturations from which theoretical reflection coefficients of BSR versus angle were gained. The results of AVO modeling were plotted in Fig. 8 with red lines using the gas hydrate saturation of 12% and porosity of 70%. For the synthetic AVO curves, free gas saturations of homogeneous and patchy distribution are from 0% to 1% and 0% to 10%, respectively and the other elastic parameters are given in Table 1. Comparing the actual AVO curves with the synthetic curves, free gas saturation was estimated to be 0.3% to 0.4% in homogeneous distribution while 3% to 4% in patchy distribution, the difference is up to 10 times.
Poisson’s ratio is an important rock physics parameter to describe the shallow submarine sediments (Dvorkin and Nur, 1998; Dvorkin et al., 1999; Tinivella, 2002). In order to judge the correctness of above estimation, Poisson’s ratios versus gas saturation of free gas-bearing sediments were fitted by the density, Pwave and S-wave velocities (Fig. 5b) of hole NGHP01-10A using EMT in both gas distribution. Since P-wave and S-wave velocities were measured in hole NGHP01-10D (Wang et al., 2013), the average Poisson’s ratio could be also calculated (green line in Fig. 9). By crossplot analysis, free gas saturation was estimated to be 0.4% in homogeneous distribution while 3.6% in patchy distribution, which is very comparable to quantitative seismic estimation. From Fig. 9, we found that although Poisson’s ratios versus gas saturation in patchy distribution were larger than those in homogeneous distribution, it is not enough to differentiate the distribution pattern by crossplot analysis of the theoretical and average Poisson’s ratio. However, the unconsolidated sands from the Gulf of Mexico and North Sea always have dry-rock Poisson’s ratios between 0 and 0.2 (Dvorkin and Nur, 1998). Because the calculating formula of bulk modulus in homogeneous distribution is different from that in patchy distribution, dry-rock Poisson’s ratio can be inversed to predict the free gas distribution using bulk modulus. The detailed flows are described as follows. (1) From the measured velocities and density to calculate the bulk and shear moduli in the saturated rock. (2) Assuming the free gas is homogeneous distribution and using those moduli, saturation, and the properties of the gas and fluid to calculate the dryframe moduli. (3) From bulk and shear moduli and Poisson’s ratio to determine the dry-rock Poisson’s ratio in both free gas distributions. (4) If the homogeneous inversion gives reasonable values for the dry-frame Poisson’s ratio, free gas is homogeneous. If the patchy inversion gives reasonable values, then free gas is patchy.The dry-rock Poisson’s ratios under BSR from 150 to 170 m, shown in Fig. 10, were inversed using the above flow. The inversed Poisson’s ratios were around 0.4 and greater than 0.2 in the patchy distribution, while the ratios near BSR from 156 to 162 m and 168 to 170 m were between 0 and 0.2 in the homogeneous distribution, which indicates that the homogeneous distribution is probably the case. But homogeneous distribution is not the case from 150 to 156 m and 162 to 168 m, we speculate it may be caused by the gas hydrate and brine filling. And the free gas was further predicted to be homogeneous distribution with the saturation of 0.3% to 0.4%. The analysis illustrate that it is feasible to quantitatively estimate the free gas saturation using prestack seismic data and Poisson’s ratio can be used to check the accuracy of the estimation as well as the distribution pattern.

|
Fig. 9 Poisson’s ratio curves versus free gas saturations from 0 to 1 |

|
Fig. 10 Poisson’s ratio inversion of dry matrix |
Free gas saturation below gas hydrate stability zones has been quantitatively estimated by amplitude preserved processing of prestack seismic data, rock physics and AVO analysis.
(1) The calculated velocities and density of rock physics model using EMT were very consistent with those of logging data in hole NGHP01-10A and 10D, in K-G basin of India, for the gas hydrate-bearing and free gas-bearing sediments, which indicates that EMT model is suitable for the elastic parameters construction of AVO curves.
(2) The AVO curve of BSR, extracted from prestack seismic data, obviously belongs to Class Ⅲ with the negative reflection coefficient between –0.1 and –0.15 and the absolute value increases with the increasing incidence angle.
(3) Comparing the actual AVO curve of BSR in hole NGHP01-10A with the theoretical curves in different distribution patterns and saturations, free gas saturation was estimated to be 0.3% to 0.4% in homogeneous distribution while 3% to 4% in patchy distribution, which agrees well with the crossplot results of NGHP01-10D.
(4) The free gas was finally predicted to be homogeneous distribution with the saturation of 0.3% to 0.4% using the inversion of dry-rock Poisson’s ratio.
ACKNOWLEDGMENTSWe thank the science team of the expedition NGHP01 acquiring the logging data used in the paper and CSIR-National Geophysical Research Institute, India providing the seismic data. We would also like to thank two anonymous reviewers for providing constructive comments to improve the paper. This study was supported by Chinese Academy of Sciences’ Strategic Priority Research Program (XDA11030102), National Project of Exploration and Test Production for Gas Hydrate (GZH201100305) of GMGS, National Natural Science Foundation of China (41676040, 41504105), and International Science & Technology Cooperation Program of China (2010DFA21740).
| [] | Aki K, Richards P G. 2002. Quantitative Seismology[M].2nd ed. Sausalito: University Science Books . |
| [] | Castagna J P, Swan H W. 1997. Principles of AVO crossplotting. The Leading Edge , 16 (4) : 337-344. DOI:10.1190/1.1437626 |
| [] | Chen D F, Wang M C, Xia B. 2005. Formation condition and distribution prediction of gas hydrate in Qinghai-Tibet Plateau permafrost. Chinese J. Geophys. (in Chinese) , 48 (1) : 165-172. |
| [] | Collett T S, Riedel M, Cochran J, et al. 2008. Geologic Controls on the Occurrence of Gas Hydrates in the Indian Continental Margin:Results of the Indian. National Gas Hydrate Program (NGHP) Expedition 01 Initial Reports, 1-135. |
| [] | Dai J C, Snyder F, Gillespie D, et al. 2008. Exploration for gas hydrates in the deepwater, northern Gulf of Mexico:Part I. A seismic approach based on geologic model, inversion, and rock physics principles. Mar. Petrol. Geol. , 25 (9) : 830-844. |
| [] | Dewangan P, Sriram G, Ramprasad T. 2009. Rock physics modeling of shallow marine sediments in the eastern continental margin of India.//Proceedings of the Eighth (2009) ISOPE Ocean Mining Symposium, 34-36. |
| [] | Dewangan P, Ramprasad T, Ramana M V, et al. 2010. Seabed morphology and gas venting features in the continental slope region of Krishna-Godavari basin, Bay of Bengal:Implications in gas-hydrate exploration. Mar. Petrol. Geol. , 27 (7) : 1628-1641. DOI:10.1016/j.marpetgeo.2010.03.015 |
| [] | Dvorkin J, Nur A. 1998. Acoustic signatures of patchy saturation. International Journal of Solids and Structures , 35 (34-35) : 4803-4810. DOI:10.1016/S0020-7683(98)00095-X |
| [] | Dvorkin J, Moos D, Packwood J L, et al. 1999. Identifying patchy saturation from well logs. Geophysics , 64 (6) : 1756-1759. DOI:10.1190/1.1444681 |
| [] | Ecker C, Dvorkin J, Nur A M. 2000. Estimating the amount of gas hydrate and free gas from marine seismic data. Geophysics , 65 (2) : 565-573. DOI:10.1190/1.1444752 |
| [] | Fohrmann M, Pecher I A. 2012. Analysing sand-dominated channel systems for potential gas-hydrate-reservoirs using an AVO seismic inversion technique on the Southern Hikurangi Margin, New Zealand. Mar. Petrol. Geol. , 38 (1) : 19-34. DOI:10.1016/j.marpetgeo.2012.08.001 |
| [] | Ghosh R, Sain K, Ojha M. 2010. Effective medium modeling of gas hydrate-filled fractures using the sonic log in the Krishna-Godavari basin, offshore eastern India. J. Geophys. Res. , 115 : B06101. |
| [] | He J X, Zhu Y H, Chen S H, et al. 2009. Genetic types and mineralization characteristics of gas hydrate and resources potential of northern South China Sea. Natural Gas Geoscience (in Chinese) , 20 (2) : 237-243. |
| [] | Hyndman R D, Spence G D. 1992. A seismic study of methane hydrate marine bottom simulating reflectors. J. Geophys. Res. , 97 (B5) : 6683-6698. DOI:10.1029/92JB00234 |
| [] | Jaiswal P, Dewangan P, Ramprasad T, et al. 2012. Seismic characterization of hydrates in faulted, fine-grained sediments of Krishna-Godavari basin:unified imaging. J. Geophys. Res. , 117 : B04306. |
| [] | Kvenvolden K A. 1993. Gas hydrates-geological perspective and global change. Rev. Geophys. , 31 (2) : 173-187. DOI:10.1029/93RG00268 |
| [] | Liu X W, Li M F, Zhang Y W, et al. 2005. Studies of seismic characteristics about gas hydrate:a case study of line HD152 in the South China Sea. Geoscience (in Chinese) , 19 (1) : 33-38. |
| [] | Luan X W, Zhang L, Yue B J. 2010. Influence on gas hydrates formation produced by volcanic activity on northern South China Sea slope. Geoscience (in Chinese) , 24 (3) : 424-432. |
| [] | Müller C, Bnnemann C, Neben S. 2007. AVO study of a gas-hydrate deposit, offshore Costa Rica. Geophys. Prospect. , 55 (5) : 719-735. DOI:10.1111/gpr.2007.55.issue-5 |
| [] | Ning F L, Liu L, Li S, et al. 2013. Well logging assessment of natural gas hydrate reservoirs and relevant influential factors. Acta Petrolei Sinica (in Chinese) , 34 (3) : 591-606. |
| [] | Ojha M, Sain K. 2007. Seismic velocities and quantification of gas-hydrates from AVA modeling in the western continental margin of India. Mar. Geophys. Res. , 28 (2) : 101-107. DOI:10.1007/s11001-007-9017-6 |
| [] | Ostrander W J. 1984. Plane-wave reflection coefficients for gas sands at nonnormal angles of incidence. Geophysics , 49 (10) : 1637-1648. DOI:10.1190/1.1441571 |
| [] | Powell C M, Roots S R, Veevers J J. 1988. Pre-breakup continental extension in east Gondwanaland and the early opening of the eastern Indian-Ocean. Tectonophysics , 155 (1-4) : 261-283. DOI:10.1016/0040-1951(88)90269-7 |
| [] | Prabhakar K N, Zutshi P L. 1993. Evolution of southern part of Indian east coast basins. Journal of Geological Society of India , 41 (3) : 215-230. |
| [] | Rao G N. 2001. Sedimentation, stratigraphy, and petroleum potential of Krishna-Godavari basin, east coast of India. AAPG Bulletin , 85 (9) : 1623-1643. |
| [] | Ran A G, Li J B, Chu F Y, et al. 2006. AVO numerical simulation of gas hydrates reflectors beneath seafloor. Chinese J. Geophys. (in Chinese) , 49 (6) : 1826-1835. |
| [] | Sheriff R E, Geldart L P. 1995. Exploration Seismology[M].2nd ed. Cambridge: Cambridge University Press . |
| [] | Sriram G, Dewangan P, Ramprasad T, et al. 2013. Anisotropic amplitude variation of the bottom-simulating reflector beneath fracture-filled gas hydrate deposit. J. Geophys. Res.:Solid Earth , 118 (5) : 2258-2274. DOI:10.1002/jgrb.50176 |
| [] | Subrahmanyam C, Chand S. 2006. Evolution of the passive continental margins of India-a geophysical appraisal. Gondwana Research , 10 (1-2) : 167-178. DOI:10.1016/j.gr.2005.11.024 |
| [] | Tinivella U. 2002. The seismic response to overpressure versus gas hydrate and free gas concentration. J. Seism. Explor. , 11 : 283-305. |
| [] | Wang J L, Wang X J, Qian J, et al. 2013. Anisotropic analysis and saturation estimation of gas hydrate filled in fractures:a case of site NGHP01-10D, offshore eastern India. Chinese J. Geophys. (in Chinese) , 56 (4) : 1312-1320. DOI:10.6038/cjg20130425 |
| [] | Wang J L, Sain K, Wang X J, et al. 2014. Characteristics of bottom-simulating reflectors for hydrate-filled fractured sediments in Krishna-Godavari basin, eastern Indian margin. Journal of Petroleum Science and Engineering , 122 : 515-523. DOI:10.1016/j.petrol.2014.08.014 |
| [] | Wang X J, Wu S G, Liu X W. 2006. Factors affecting the estimation of gas hydrate and free gas saturation. Chinese J. Geophys. (in Chinese) , 49 (2) : 504-511. |
| [] | Wang X J, Hutchinson D R, Wu S G, et al. 2011. Elevated gas hydrate saturation within silt and silty clay sediments in the Shenhu area, South China Sea. J. Geophys. Res. , 116 : B05102. |
| [] | Warner M. 1990. Absolute reflection coefficients from deep seismic reflections. Tectonophysics , 173 (1-4) : 15-23. DOI:10.1016/0040-1951(90)90199-I |
| [] | Wu N Y, Zhang H Q, Yang S X, et al. 2007. Preliminary discussion on natural gas hydrate (NGH) reservoir system of Shenhu Area, North Slope of South China Sea. Natural Gas Industry (in Chinese) , 27 (9) : 1-6. |
| [] | Wu N Y, Yang S X, Wang H B, et al. 2009. Gas-bearing fluid influx sub-system for gas hydrate geological system in Shenhu area, northern South China Sea. Chinese J. Geophys. (in Chinese) , 52 (6) : 1641-1650. DOI:10.3969/j.issn.0001-5733.2009.06.027 |
| [] | Yan P, Chen D F. 2009. New geophysical evidence for gas hydrates in Baiyun Sag in the northern margin of the South China Sea. Journal of Tropical Oceanography (in Chinese) , 28 (3) : 85. |
| [] | Yu X H, Wang J Z, Liang J Q, et al. 2014. Depositional accumulation characteristics of gas hydrate in the northern continental slope of South China Sea. Acta Petrolei Sinica (in Chinese) , 35 (2) : 253-264. |
| [] | Zhang G X, Zhang M, Yang S X, et al. 2011. Application of seismic detecting technique to marine gas hydrate survey. Marine Geology & Quaternary Geology (in Chinese) , 31 (4) : 51-58. |
| [] | Zhang H Q, Yang S X, Wu N Y, et al. 2007. Successful and surprising results for China's first gas hydrate drilling expedition. Fire in the Ice:Methane Hydrate Newsletter, National Energy Technology Laboratory, US Department of Energy, 6-9. |