2 College of Earth Science, University of Chinese Academy of Sciences, Beijing 100049, China
Subduction slab transports the water in the Earth’s surface into the deep mantle, having a significant effect on the geodynamics of the Earth’s interior (Wang, 2009; Faccenda, 2014). Under the high-temperature and high-pressure in the lower mantle, water may be dehydrated from the subducted or the collapsed slab fragments (Ohtani, 2005). At the top of the lower mantle, water can be released from the decomposition of superhydrous phase B (Mg10Si3O14(OH)4); in the deep lower mantle, water can be released from the decomposition of phase D (MgSi2O4(OH)2) in the slabs or stagnant fragments (Ohtani et al., 1997; Yuen et al., 2007; Faccenda, 2014). Previous studies mainly focus on the dehydration at the top side of the slab, which is considered to be associated with the cause of the big mantle wedge (BMW)(e.g., Stern, 2002; Zhao et al., 2012; Lei et al., 2013), but the study on the dehydration at the bottom side and its effect is relatively less recognized.
The subducted oceanic lithosphere subhorizontally deflects near the 660 km discontinuity (hereafter as 660) in the bottom of the mantle transition zone (MTZ) beneath the northwestern Pacific region, and accumulates there as the stagnant slab (Fukao et al., 1992, 2009). Seismic attenuation tomography reported the low-Qu anomaly (660∼1400 km) in eastern Asia area, and the anomaly was explained to be caused by the water released from the decomposition of phase D in the slab (Lawrence and Wysession, 2006). Regional seismic tomography has revealed that the stagnant slab is commonly distributed in the MTZ beneath eastern China and surrounding areas (e.g., Li and van der Hilst, 2010), with some slab fragments collapsed into the lower mantle because of the gravity instability (Zhao et al., 2011); slow velocity anomalies have been also detected under the stagnant slab in some regions (Huang and Zhao, 2006; Li et al., 2008). Tang et al.(2014) found that Changbaishan volcano may originate from the entrained asthenosphere materials below the subducted and stagnant slabs. Seismic detections of the low velocity zone corresponding to the slab dehydration are significant to understand the related geodynamic processes.
Triplicated waveforms from dense seismic networks have been successfully used to detect the fine structure of the Earth’s interior (e.g., Tajima and Grand, 1995; Song et al., 2004; Chen and Tseng, 2007; Chu et al., 2012). Previous researchers have obtained the velocity structures of the MTZ in northeastern Asia using P-and/or S-wave triplications. Tajima and Grand (1995, 1998) reported the M3.11 model for northwestern Pacific region, showing the 30 km depression of the 660 and the high-velocity layer associated with the subduction slab above the 660. Wang et al.(2006) found the 70 km depression of the 660 in northeastern Asia. Wang and Chen (2009) reported the high-velocity layer above the 660 in Japan sea subduction zone, and the low-velocity anomaly between 660 and 760 km beneath south Kuril, which is possibly related to the upwelling from the lower mantle. Zhang et al.(2012) reported the 15∼20 km depression of the 660 beneath Korean Peninsular and the high S-wave velocity layer in the lower part of the MTZ. Wang and Niu (2010) reported that the 660 in northeast China was a 30∼70 km gradient layer, which may be caused by multi-phase transitions associated with the dissolutions of olivine and garnet components. More recently, P- and SH-wave triplications have revealed the 35 km gradient layer for the 660 in northeast China (NEChina-P, NEChina-S models), and about 0.2∼0.3 wt% water in the MTZ (Ye et al., 2011; Ye and Li, 2012; Li et al., 2013). The velocity models derived from the aforementioned studies show some differences in velocity or discontinuity variations, which may result from the ray paths of different earthquake events to stations.
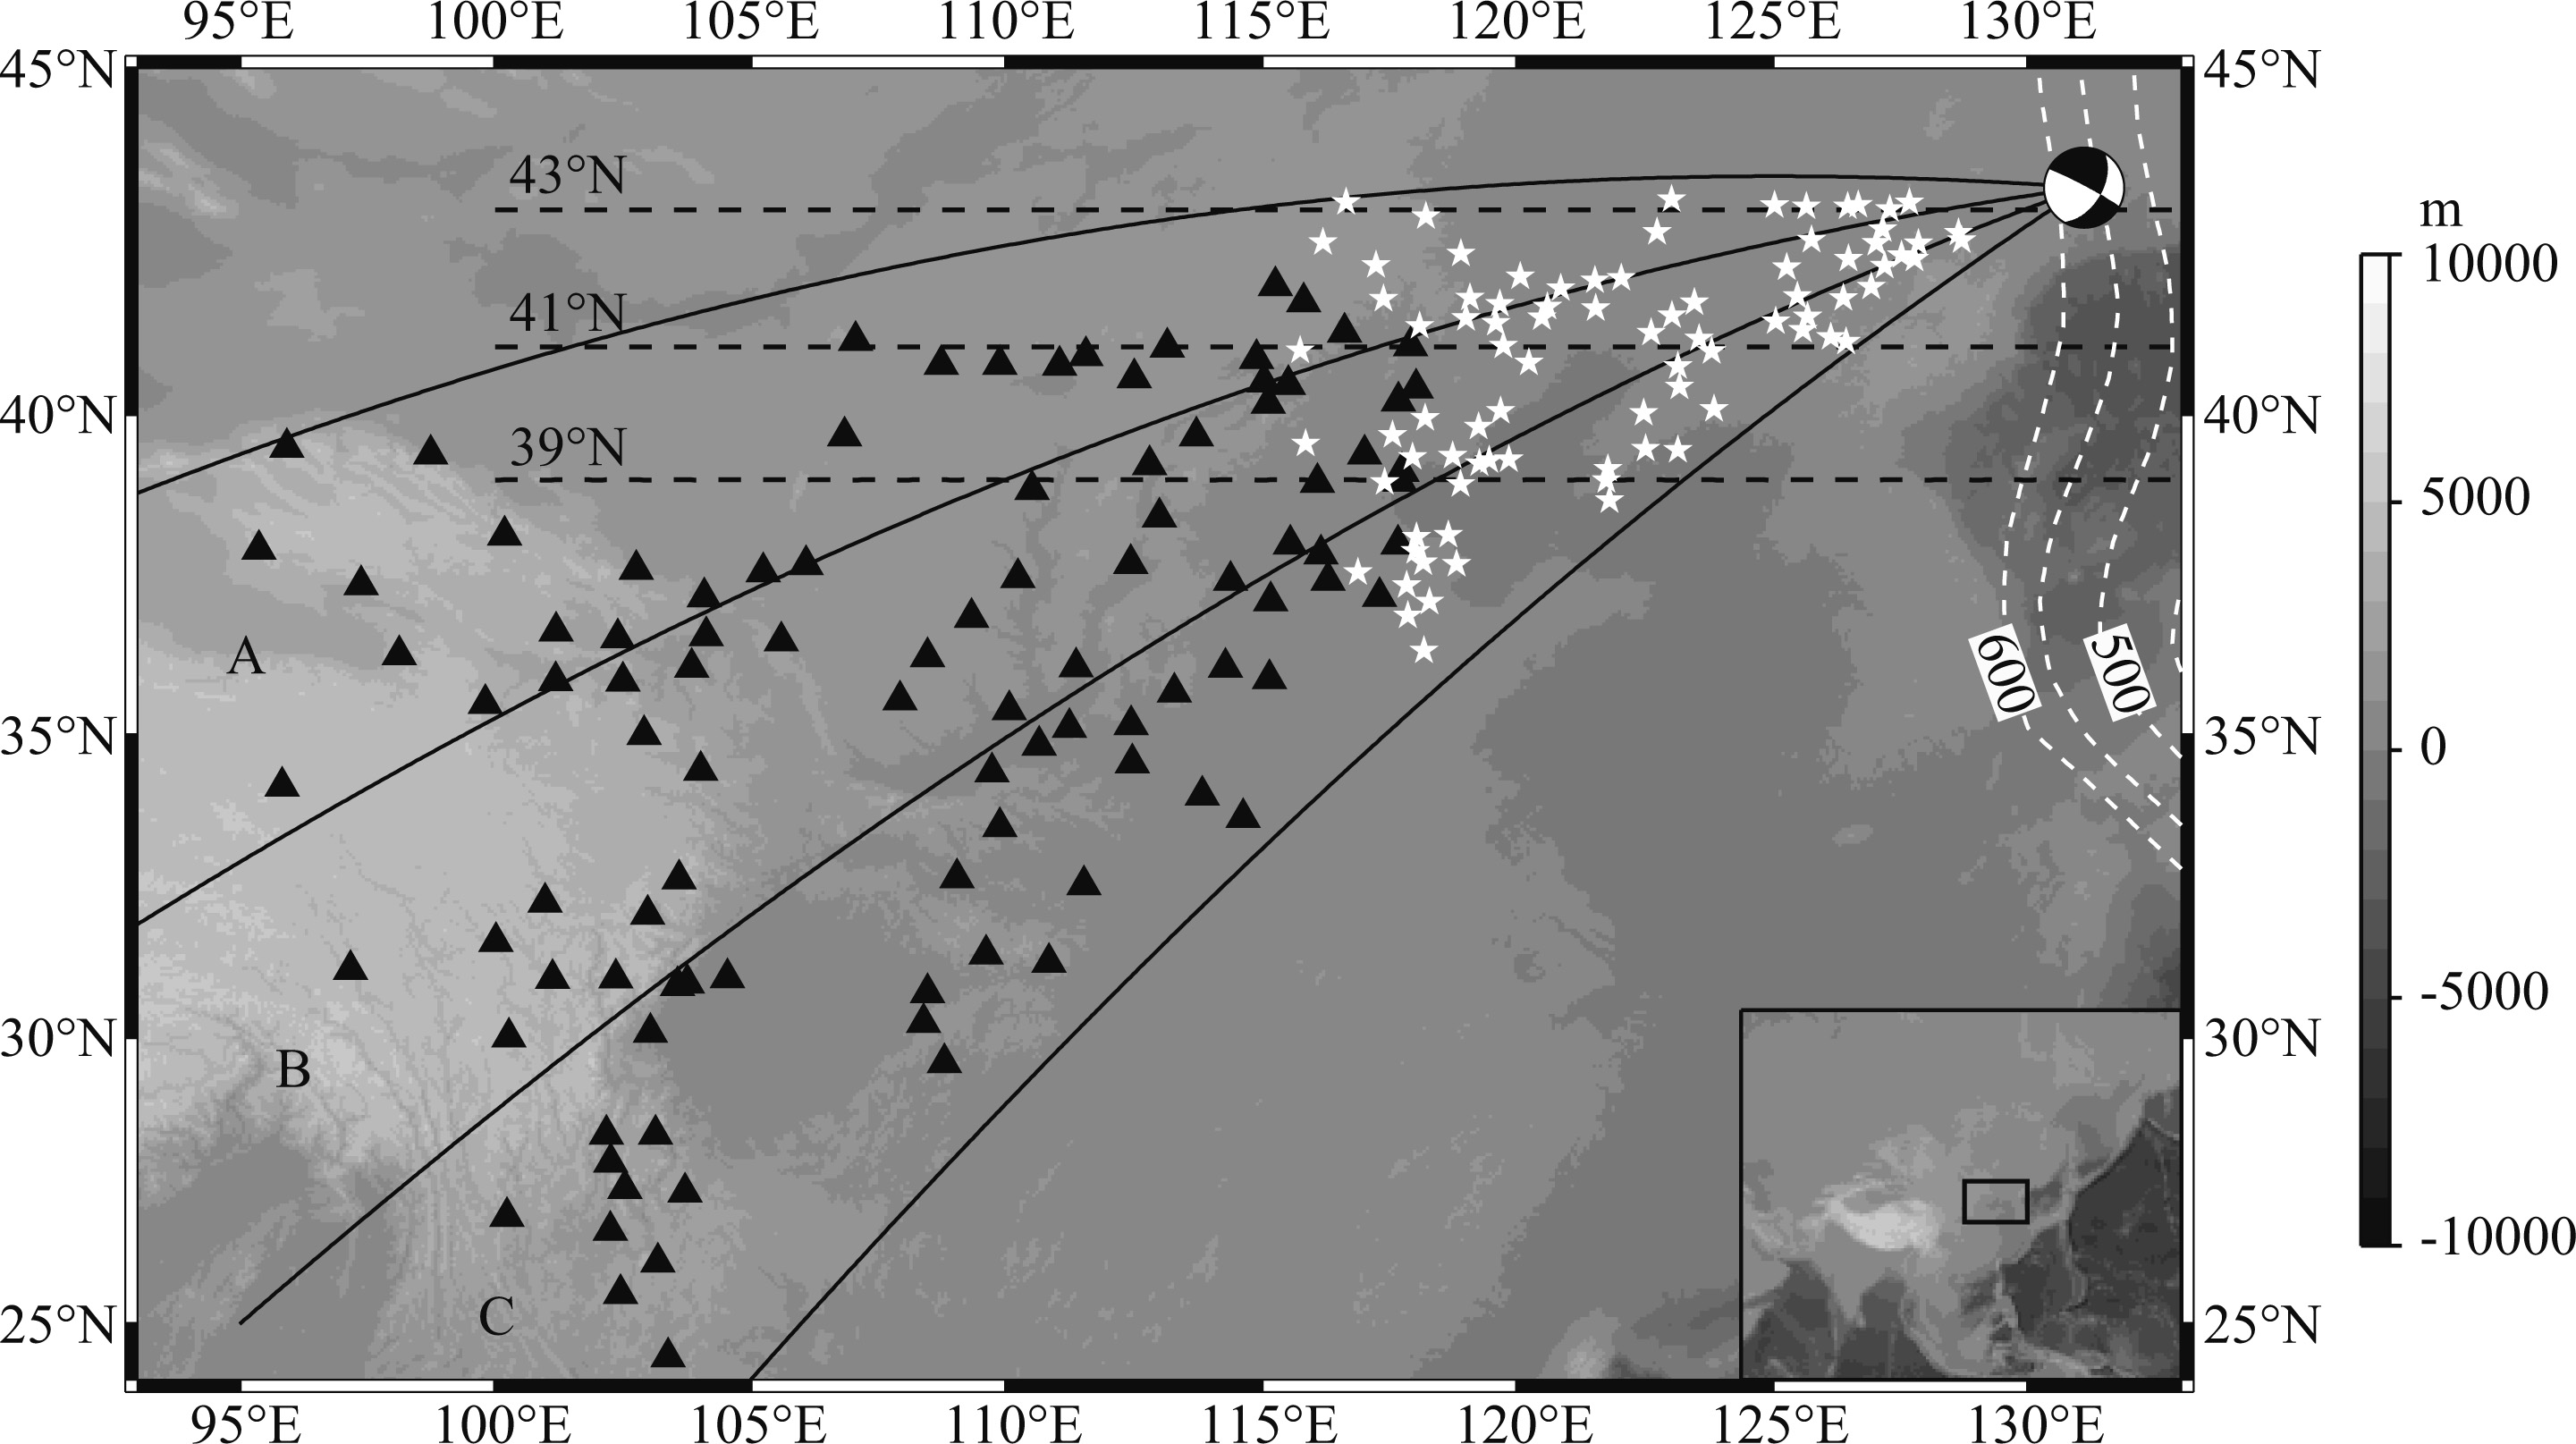
The earthquake events with suitable magnitude can provide the simple source time functions and high signal-to-noise ratio (SNR) waveforms; dense and uniformly distributed stations can provide the complete triplications to map the fine structure. In this study, broadband P waveforms from the deep earthquake of 10 May 2011(Mb 5.4) occurred at the border of northeast China and Russia, recorded by the China Digital Seismograph Network (CDSN, Fig. 1)(Zheng et al., 2009), are used to study the velocity structure around the 660 beneath the eastern North China Craton (NCC). Additionally, the related geodynamic processes are also discussed based on our seismic results.
|
Fig. 1 Map showing locations of earthquake (beach ball) and stations (black triangles) used in the study |
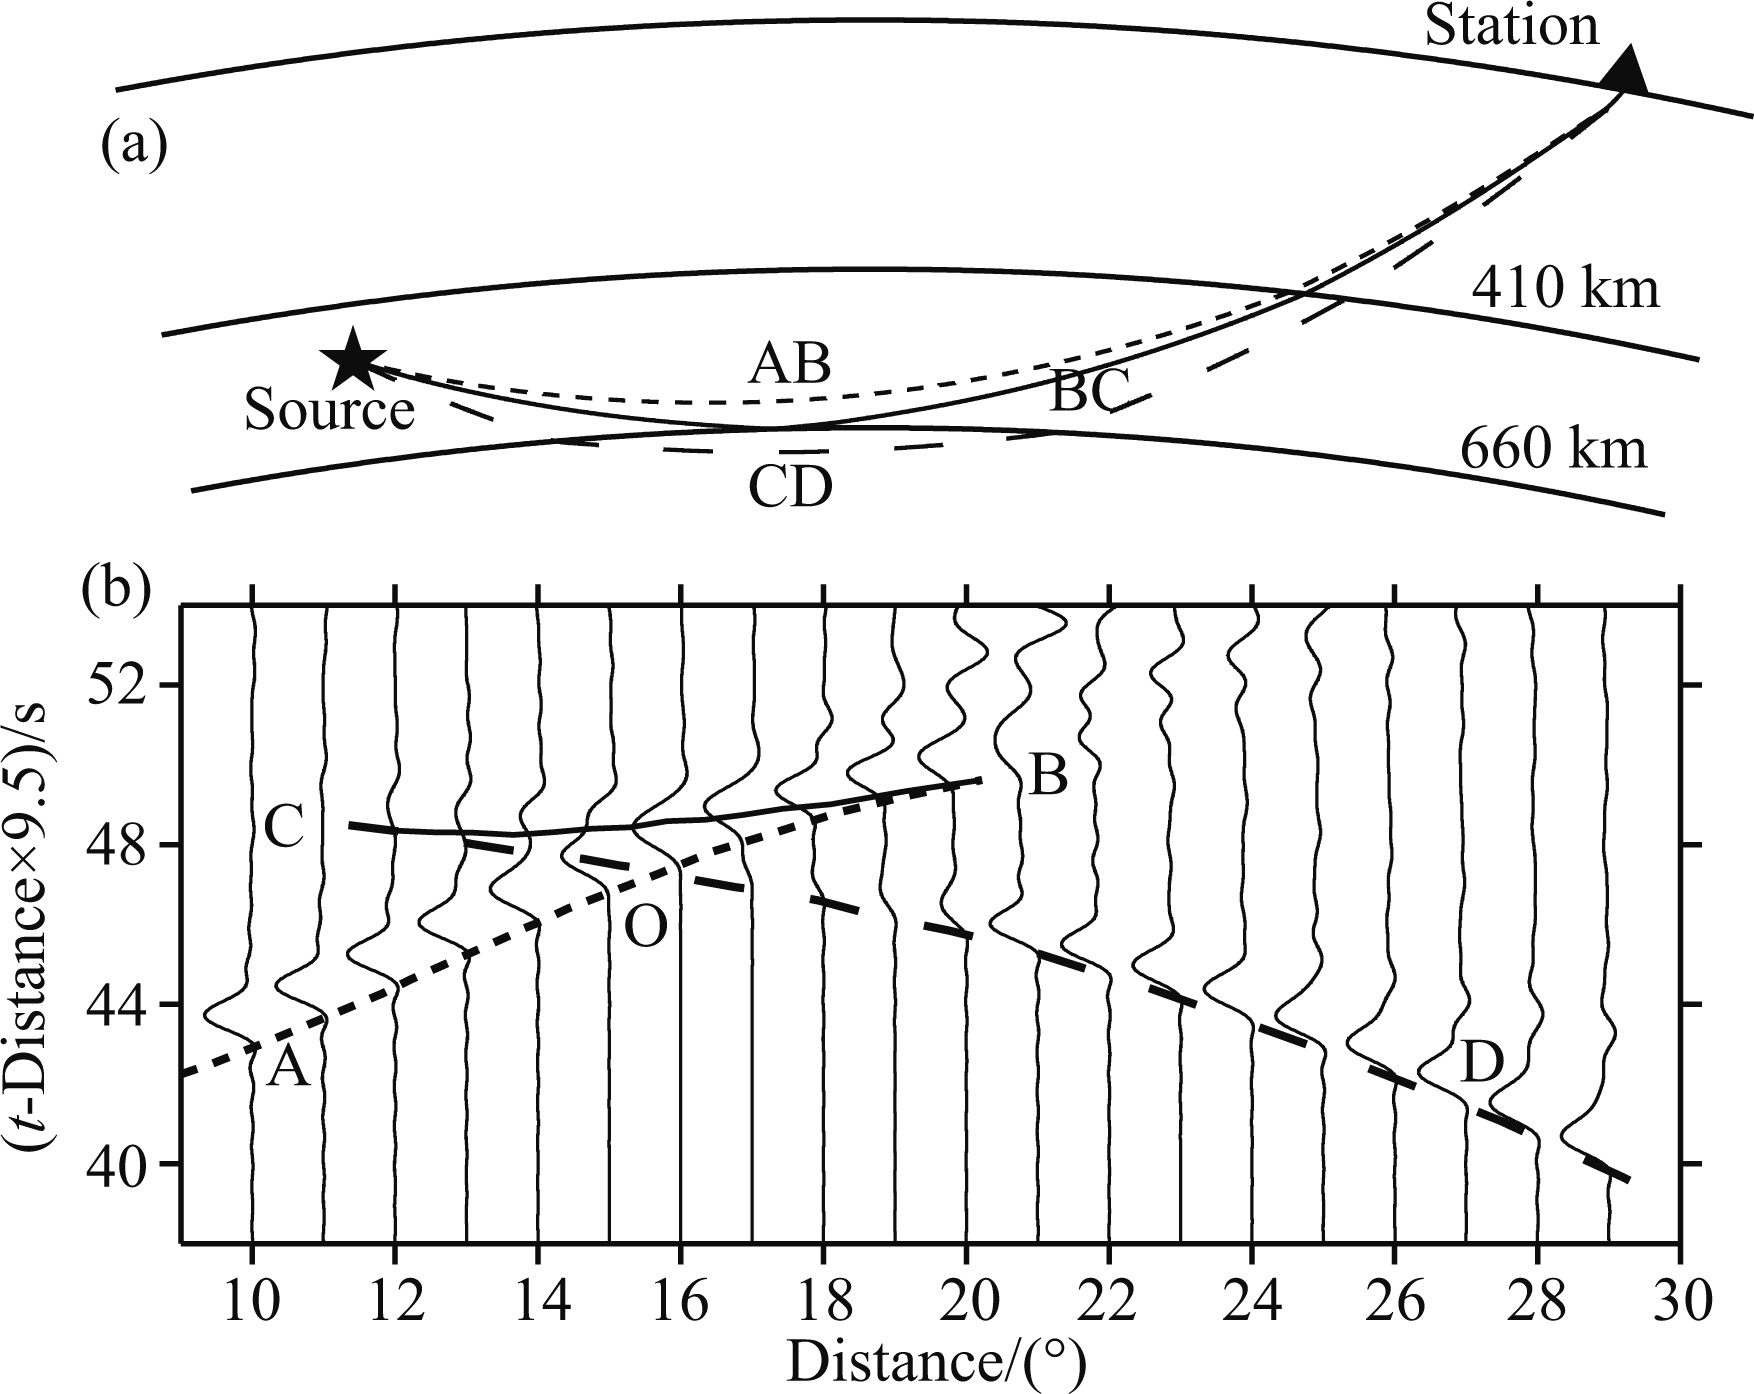
Triplicated arrivals would occur while seismic waves propagate across the discontinuity of the Earth’s interior (Fig. 2a). The P-wave triplications across the 660 include the turning wave above the 660(AB), the reflection wave on the 660(BC) and the turning wave below the 660(CD). Seismic triplications can provide the dense samplings to the radial structure by turning points1) of seismic waves; the sampling areas and turn-ing depths depend on the variations of focal depths and epicentral distances (Tajima et al., 2009; Sui and Zhou, 2015). Ray paths of a single station for the triplications are similar in the crust and lithosphere mantle, and the main differences of them come from the structure near the discontinuity. Multiple P-waves are not subjected to potential distortions from heterogeneities below the station (Wang and Niu, 2010). To some extents, wave- forms recorded by dense networks or arrays can reduce the interferences of lateral heterogeneities in shallower part (Tseng and Chen, 2007; Zhang et al., 2012). As illustrated in Fig. 2b, waveform triplications have the folding travel-time curves (AB, BC and CD). The rel- ative travel-time and amplitude variations can provide the constraints on the structures across the discontinu- ity (Ye and Li, 2012; Li et al., 2014).
1) The turning point is defined as the lowermost point on the ray path, where the ray direction is horizontal and the incidence angle is 90° (Shearer, 2009).
|
Fig. 2 Ray paths (a) and travel-times, synthetic wave- forms (b) of the P-wave triplications across the 660 A deep earthquake with the focal depth of 552.0 km and the IASP91 model are used in the calculations. AB, BC and CD branches are shown in dotted, solid and dashed lines, respectively. |
In the study, we calculate the theoretical travel-times with the dynamic raytracing method (Tian et al., 2007), and the synthetic seismograms with the reflectivity method (Wang, 1999). Best-fitting velocity models for three sub-regions are obtained with the travel-time and waveform comparisons based on the trial-and-error method.
2.2 Data Collection and ProcessingWe select the earthquake event with the focal depth greater than 410 km, to avoid the interferences of triplicated arrivals across the 410 km discontinuity (Table 1). The source parameters are taken from the International Seismological Centre (ISC) on-line Bulletin (ISC, 2012). The focal depths provided by the ISC range between 545∼560 km, and the latest one is 554.9 km. Focal mechanism solutions are taken from the global Centroid-Moment-Tensor project2) (Dziewonski et al., 1981; Ekström et al., 2012).
|
|
Table 1 Source parameters of the earthquake event |
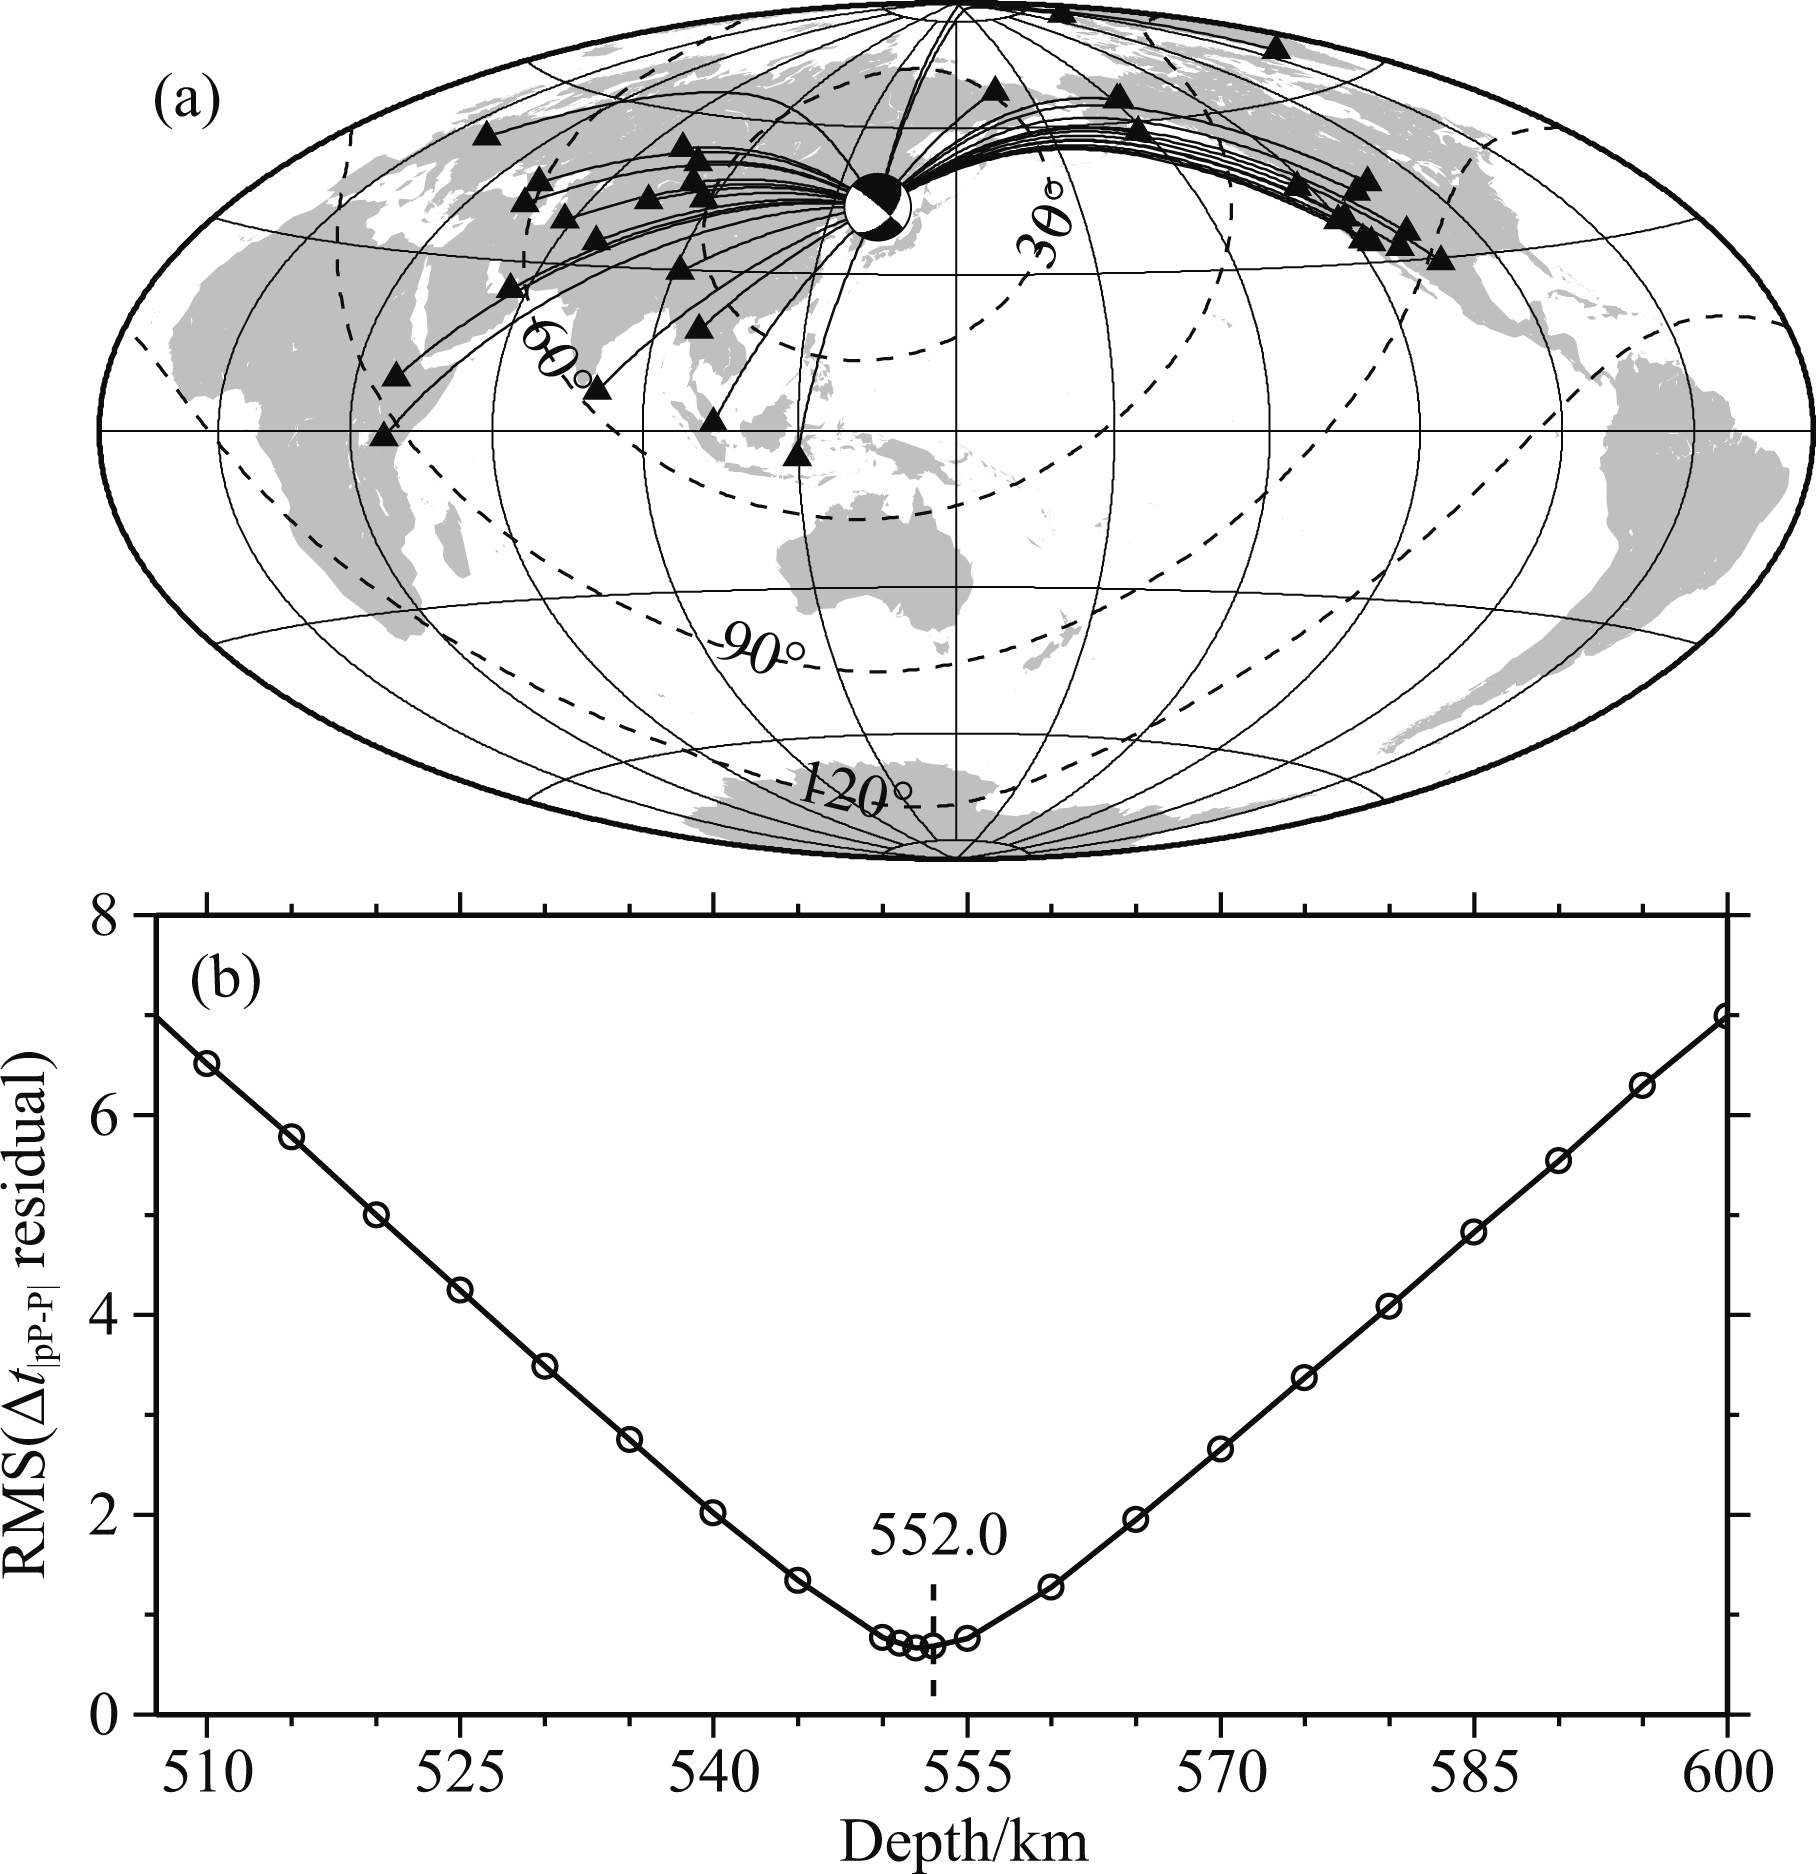
The focal depth uncertainty has an effect on the travel-time characteristics of seismic triplications (e.g., Wang and Niu, 2010), and it should be relocated or checked. We retrieve the waveform data (30°∼95°) of Global Seismographic Network (GSN) from Incorporated Research Institutions for Seismology (IRIS)3) (Fig. 3a), and then read the P and pP arrivals to get the relative travel-times of two phases; based on the IASP91(Kennett and Engdahl, 1991) and CRUST2.0 model (Bassin et al., 2000), the residuals between the observed and theoretical pP-P relative travel-times would reach its minimum root mean square (RMS) with the focal depth perturbations (Fig. 3b). The relocated focal depth is 552.0 km. The earthquake event used show clear arrivals and high SNR waveforms of P-wave, but low SNR of S-wave. Therefore only the P-wave triplications are applied in this study.
|
Fig. 3 Focal depth relocation of the earthquake (a) Beach ball represents the epicenter location, black triangles represent the stations used in the relocation, and the black lines are the surface projection of P-wave ray paths; (b) The horizontal axis is the perturbation of the focal depth; the vertical axis is the RMS of the time residuals of pP-P relative intervals relative to the IASP91 model. |
We firstly remove the means, trends and instru- ment responses of original records, then filter them with the frequency band of 0.05∼1.0 Hz, and finally integrate the velocity records into displacements. The triplica-tions across the 660 appear in the epicentral distance range of 10°∼30°. Turning points mainly distribute be-neath the eastern NCC, and the triplicated waveforms can provide constrains on the structure in this area. To analyze the possible lateral variations, stations are di- vided into three sub-regions (A, B and C) by the az-imuthal interval of 12°(Fig. 1). The observed waveforms of three sub-regions are shown in Fig. 4.

|
Fig. 4 Observed waveforms for sub-regions A, B and C The horizontal axis is the reduced travel-time, and the vertical axis is the epicentral distance; The travel-times of P-wave triplication calculated with the IASP91 are shown in black lines, and the phases are marked with the symbols A, B, C, D and O. |
We firstly analyze the characteristics of observed seismic triplications (Fig. 4), and then construct three modified models based on the IASP91 model, includ- ing a high-velocity layer above the 660(model Ⅰ), a 15 km depression of the 660(model Ⅱ) and a low-velocity anomaly below the 660(model Ⅲ) for the forward mod- eling of seismograms (Fig. 5). The focal depth is set as 552.0 km in the calculations. The triplication variations can be obtained by the travel-time and waveform com- parisons, to see whether they appear in the observed waveforms or not.

|
Fig. 5 Travel-times and synthetic seismograms for different velocity models |
Figure 5 shows the travel-times and synthetic P-wave triplications for the IASP91 model and three modified models. For the IASP91 model, the AB branch terminates at 20.5°(cusp B), the CD branch begins at 11.4°(cusp C), and AB and CD branches cross at ∼15.7°(point O).
The high-velocity layer (100 km) in the model Ⅰ has the peak anomaly of 1.0%. The cusp B'(27.6°) terminates later than the cusp B, and the AB' branch has a larger slope than the AB branch at 15.0°∼27.6°. The cusp C' appears at a larger epicentral distance (11.6°) than the cusp C, and the B'C' branch is obviously longer than the BC branch. The C'D' branch shows a 0.2 s advance relative to the CD branch, and the differential travel-times between AB' and C'D' branches are smaller than that between AB and CD branches.
The 660 in model Ⅱ has a 15 km depression. The cross point O'(16.5°) appears later than the cross point O (15.7°). The cusp C'(12.1°) appears later than the cusp C, the cusp B'(21.5°) terminates later than the cusp B, and the B'C' branch is longer than the BC branch. Compared with the CD branch, the C'D' branch has a 0.6 s delay. The differential travel-times between the AB' and C'D' branches are larger than that between the AB and CD branches.
The low-velocity anomaly in model Ⅲ shows the velocity drop of 1.0%. The C'D' branch has a smaller slope than the CD branch, and the differential travel-times between C'D' and CD branches increase with the epicentral distances. The AB' branch coincides with the AB branch. The cusp C'(12.0°) appears later than the cusp C. The cross point O'(16.1°) appears later than the cross point O. The differential travel-times between the AB' and AB branches are smaller than that between the AB and CD branches.
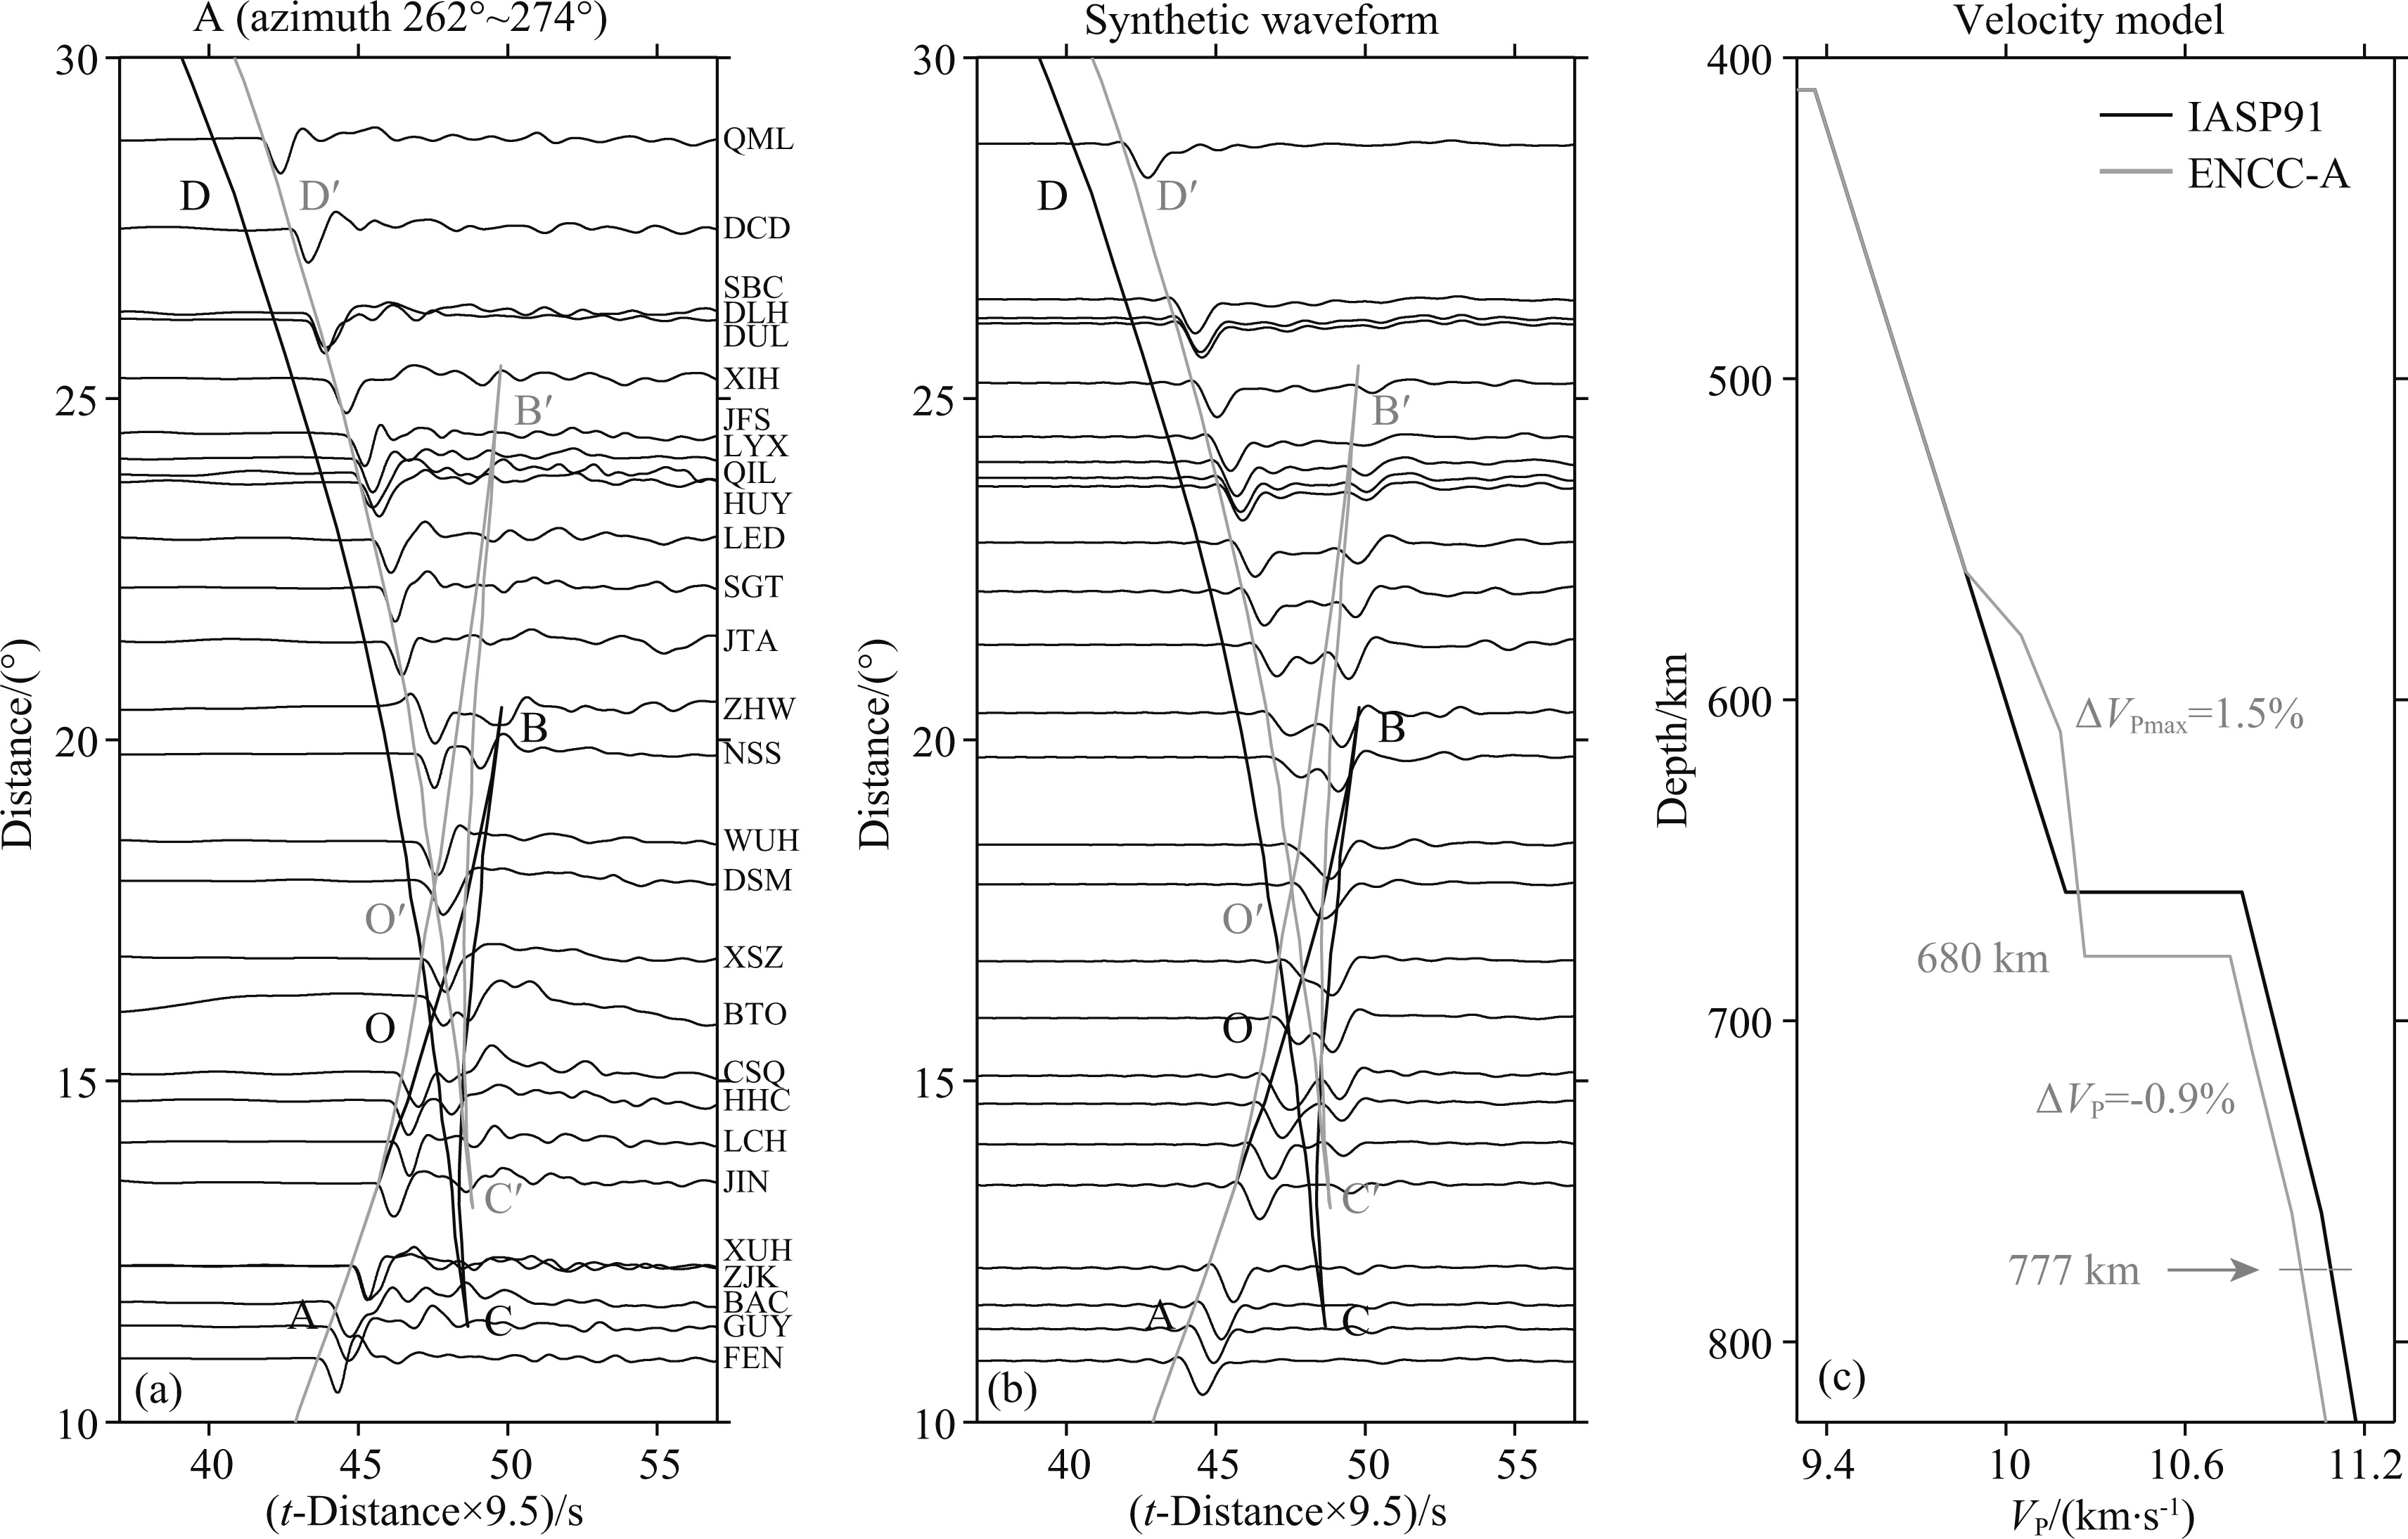
3 RESULTSWe don’t find the systematic travel-time deviations between the observed P-wave triplications and the theoretical travel-times from the IASP91 model (Fig. 6a). The AB' branch shows a larger slope than the AB branch at 13°∼20°, and the cusp B'(25.5°) terminates at a larger epicentral distance than the cusp B (20.5°), indicating the presence of a high-velocity layer above the 660. The cross point O'(18.0°) appears at a larger epicentral distance than the cross point O (15.7°), the cusp C'(13.0°) appears at a larger epicentral distance than the cusp C (11.4°) and the AOC' zone is broader than the AOC zone, indicating the depression of the 660. The gradient discontinuity would relate to a much larger epicentral distance of the cusp C', but the differential distance between the cusp C' and cusp C is small in observed P-wave triplications, which implies that the 660 tends to be a sharp interface. The differential travel-times between the C'D' and CD branches increase with the epicentral distances, and the slope of the C'D' branch is smaller than that of the CD branch, implying the presence of a low-velocity anomaly below the 660.
The velocity model for the sub-region A (ENCC-A) is obtained through forward tests (Figs. 6b and 6c). The ENCC-A model has a high-velocity layer (120 km) with the peak anomaly of 1.5%, a 20 km depression of the 660, a low-velocity anomaly with the velocity drop of 0.9% below the 660. The model has the velocity contrast of 4.73% across the 660, which is smaller than that of the IASP91 model (5.8%).
|
Fig. 6 Observed waveforms (a), synthetic waveforms (b) and velocity models (c) for sub-region A |
The P-wave triplication characteristics of the sub-region B are similar with that of the sub-region A (Fig. 7a), but the differential travel-times between the C'D' and CD branches are smaller than those of the sub-region A. The ENCC-B model for the sub-region B is obtained with similar methods (Figs. 7b and 7c). This model has a high-velocity layer (115 km) with the peak anomaly of 2.0% above the 660, a 15 km depression of the 660 and the low-velocity anomaly of 0.6% below the 660.

|
Fig. 7 Observed waveforms (a), synthetic waveforms (b) and velocity models (c) for the sub-region B |
The predicted OD branch is consistent with P-wave arrivals (Fig. 8a). The ENCC-C model for the sub- region C has a high-velocity layer (120 km) with the peak anomaly of 2.0% above the 660, a 20 km depression of the 660, but no velocity anomaly below the 660(Figs. 8b and 8c).
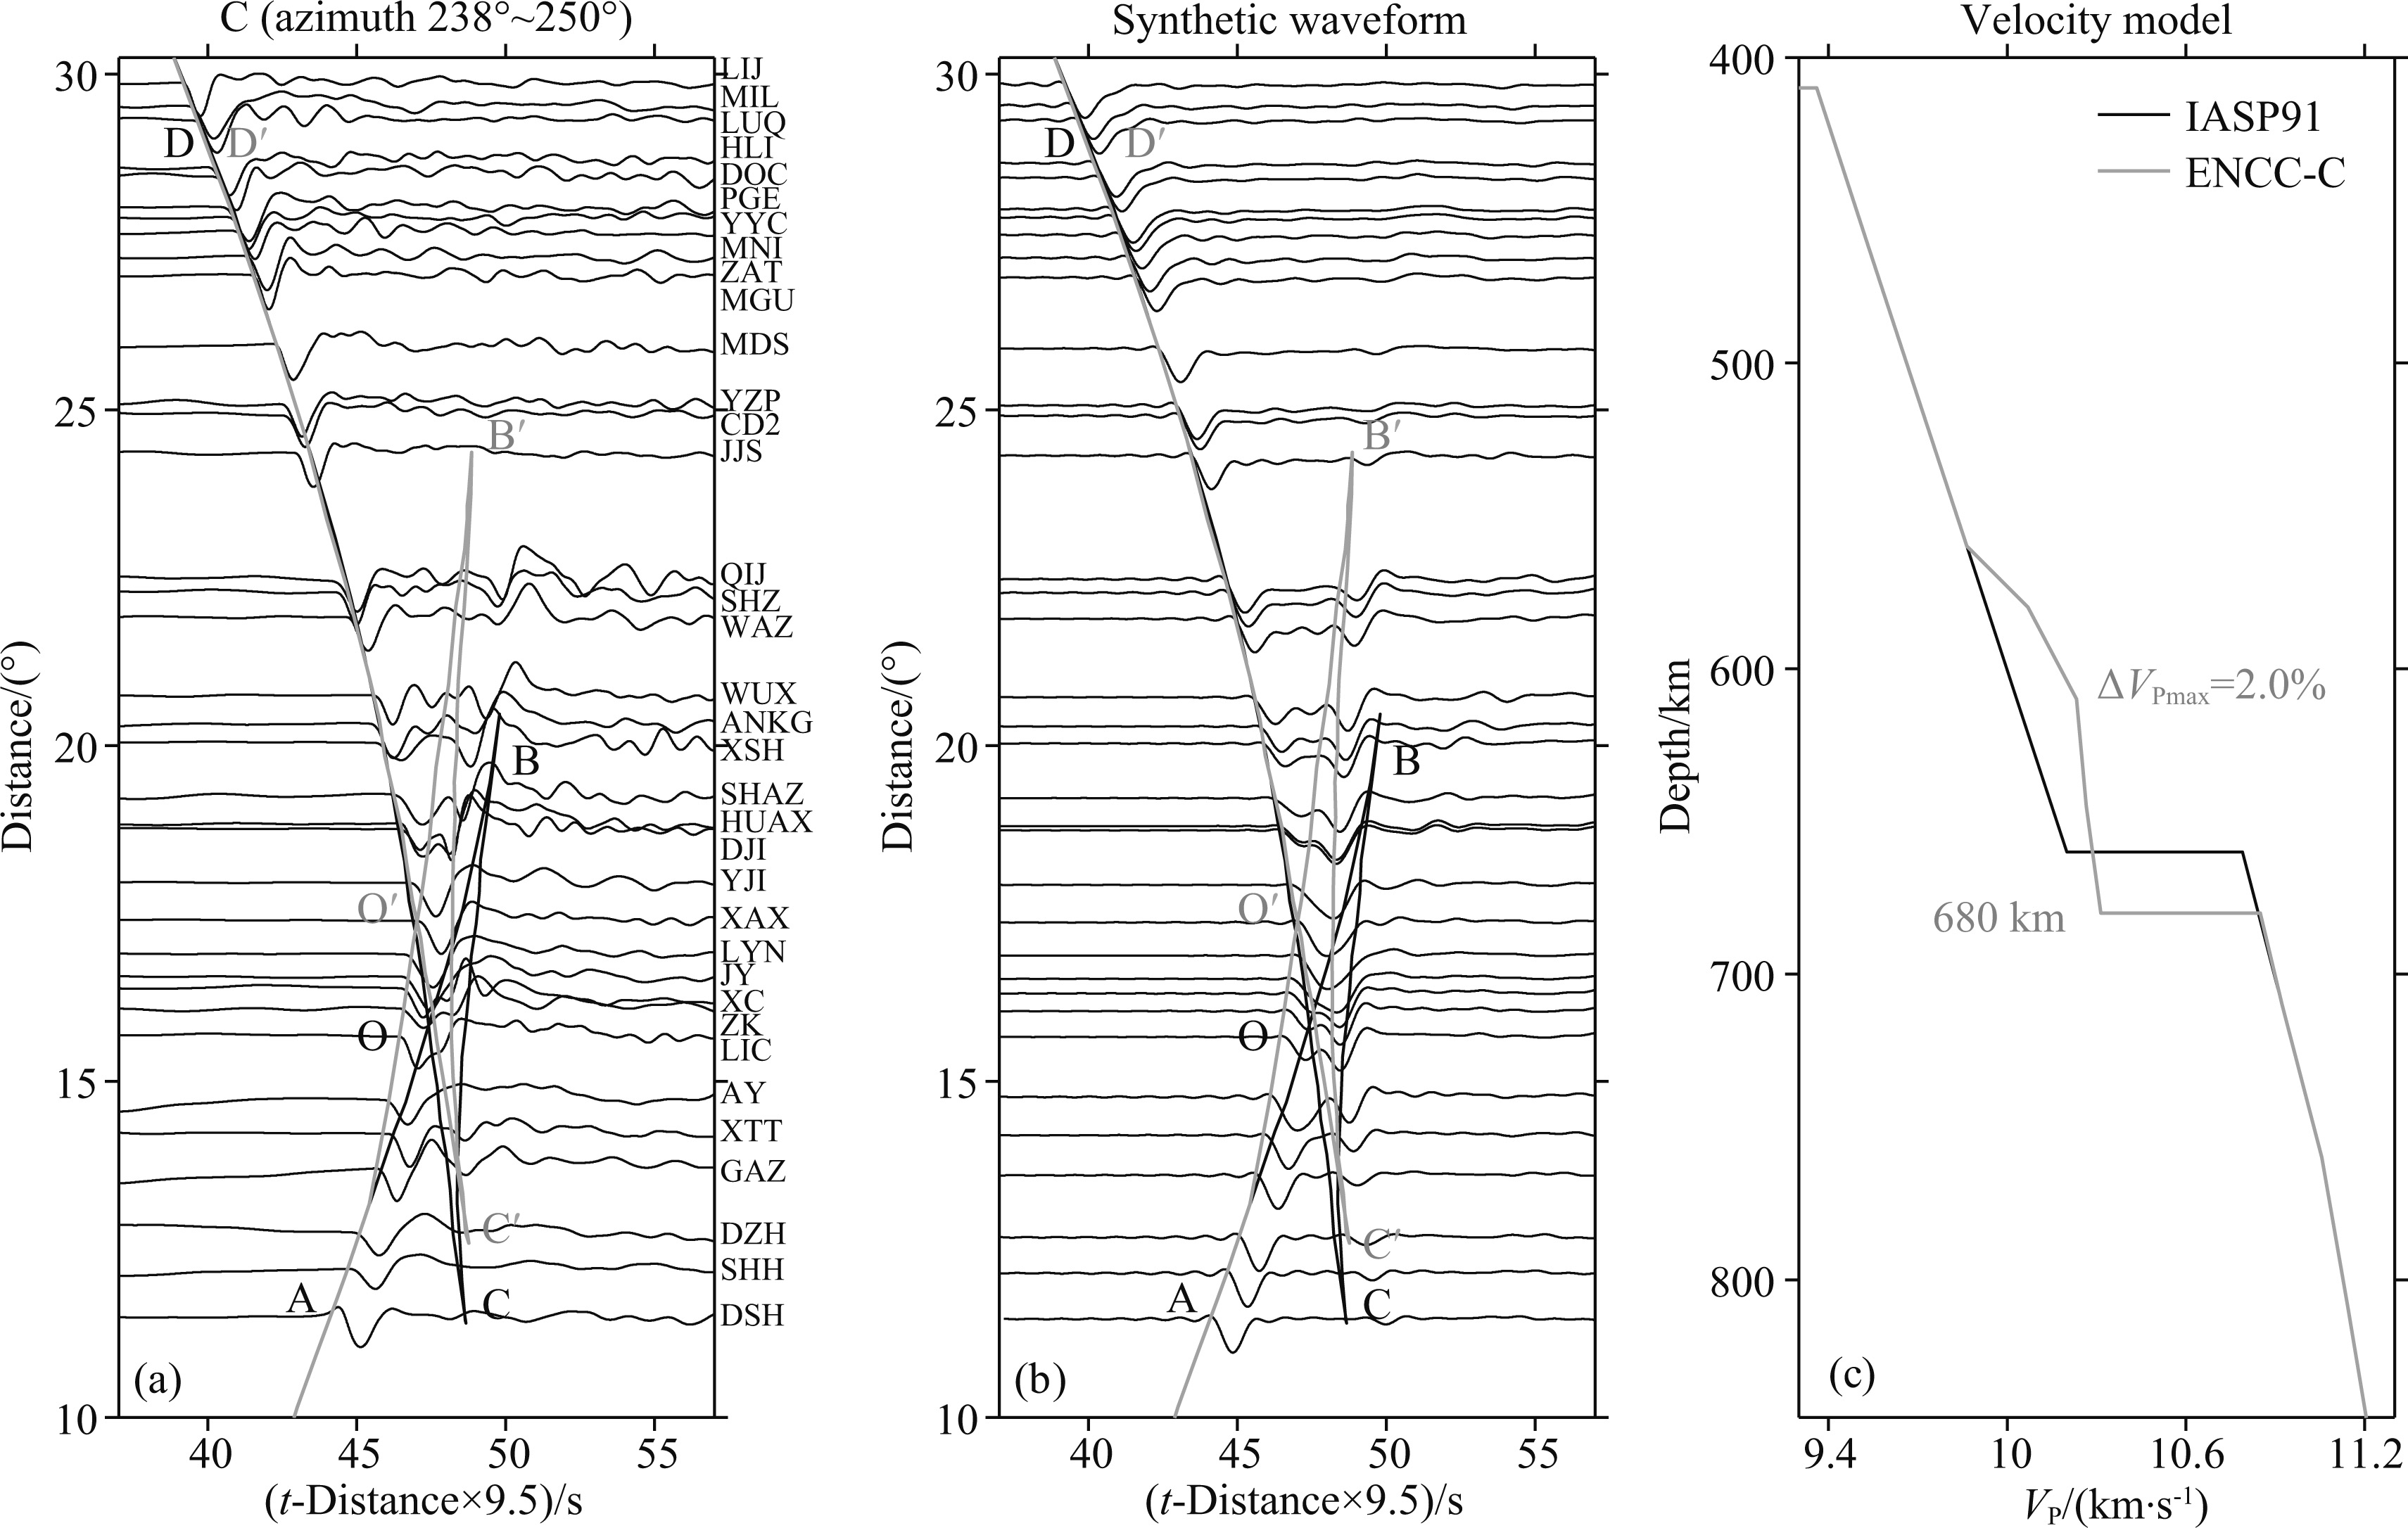
|
Fig. 8 Observed waveforms (a), synthetic waveforms (b) and velocity models (c) for the sub-region C |
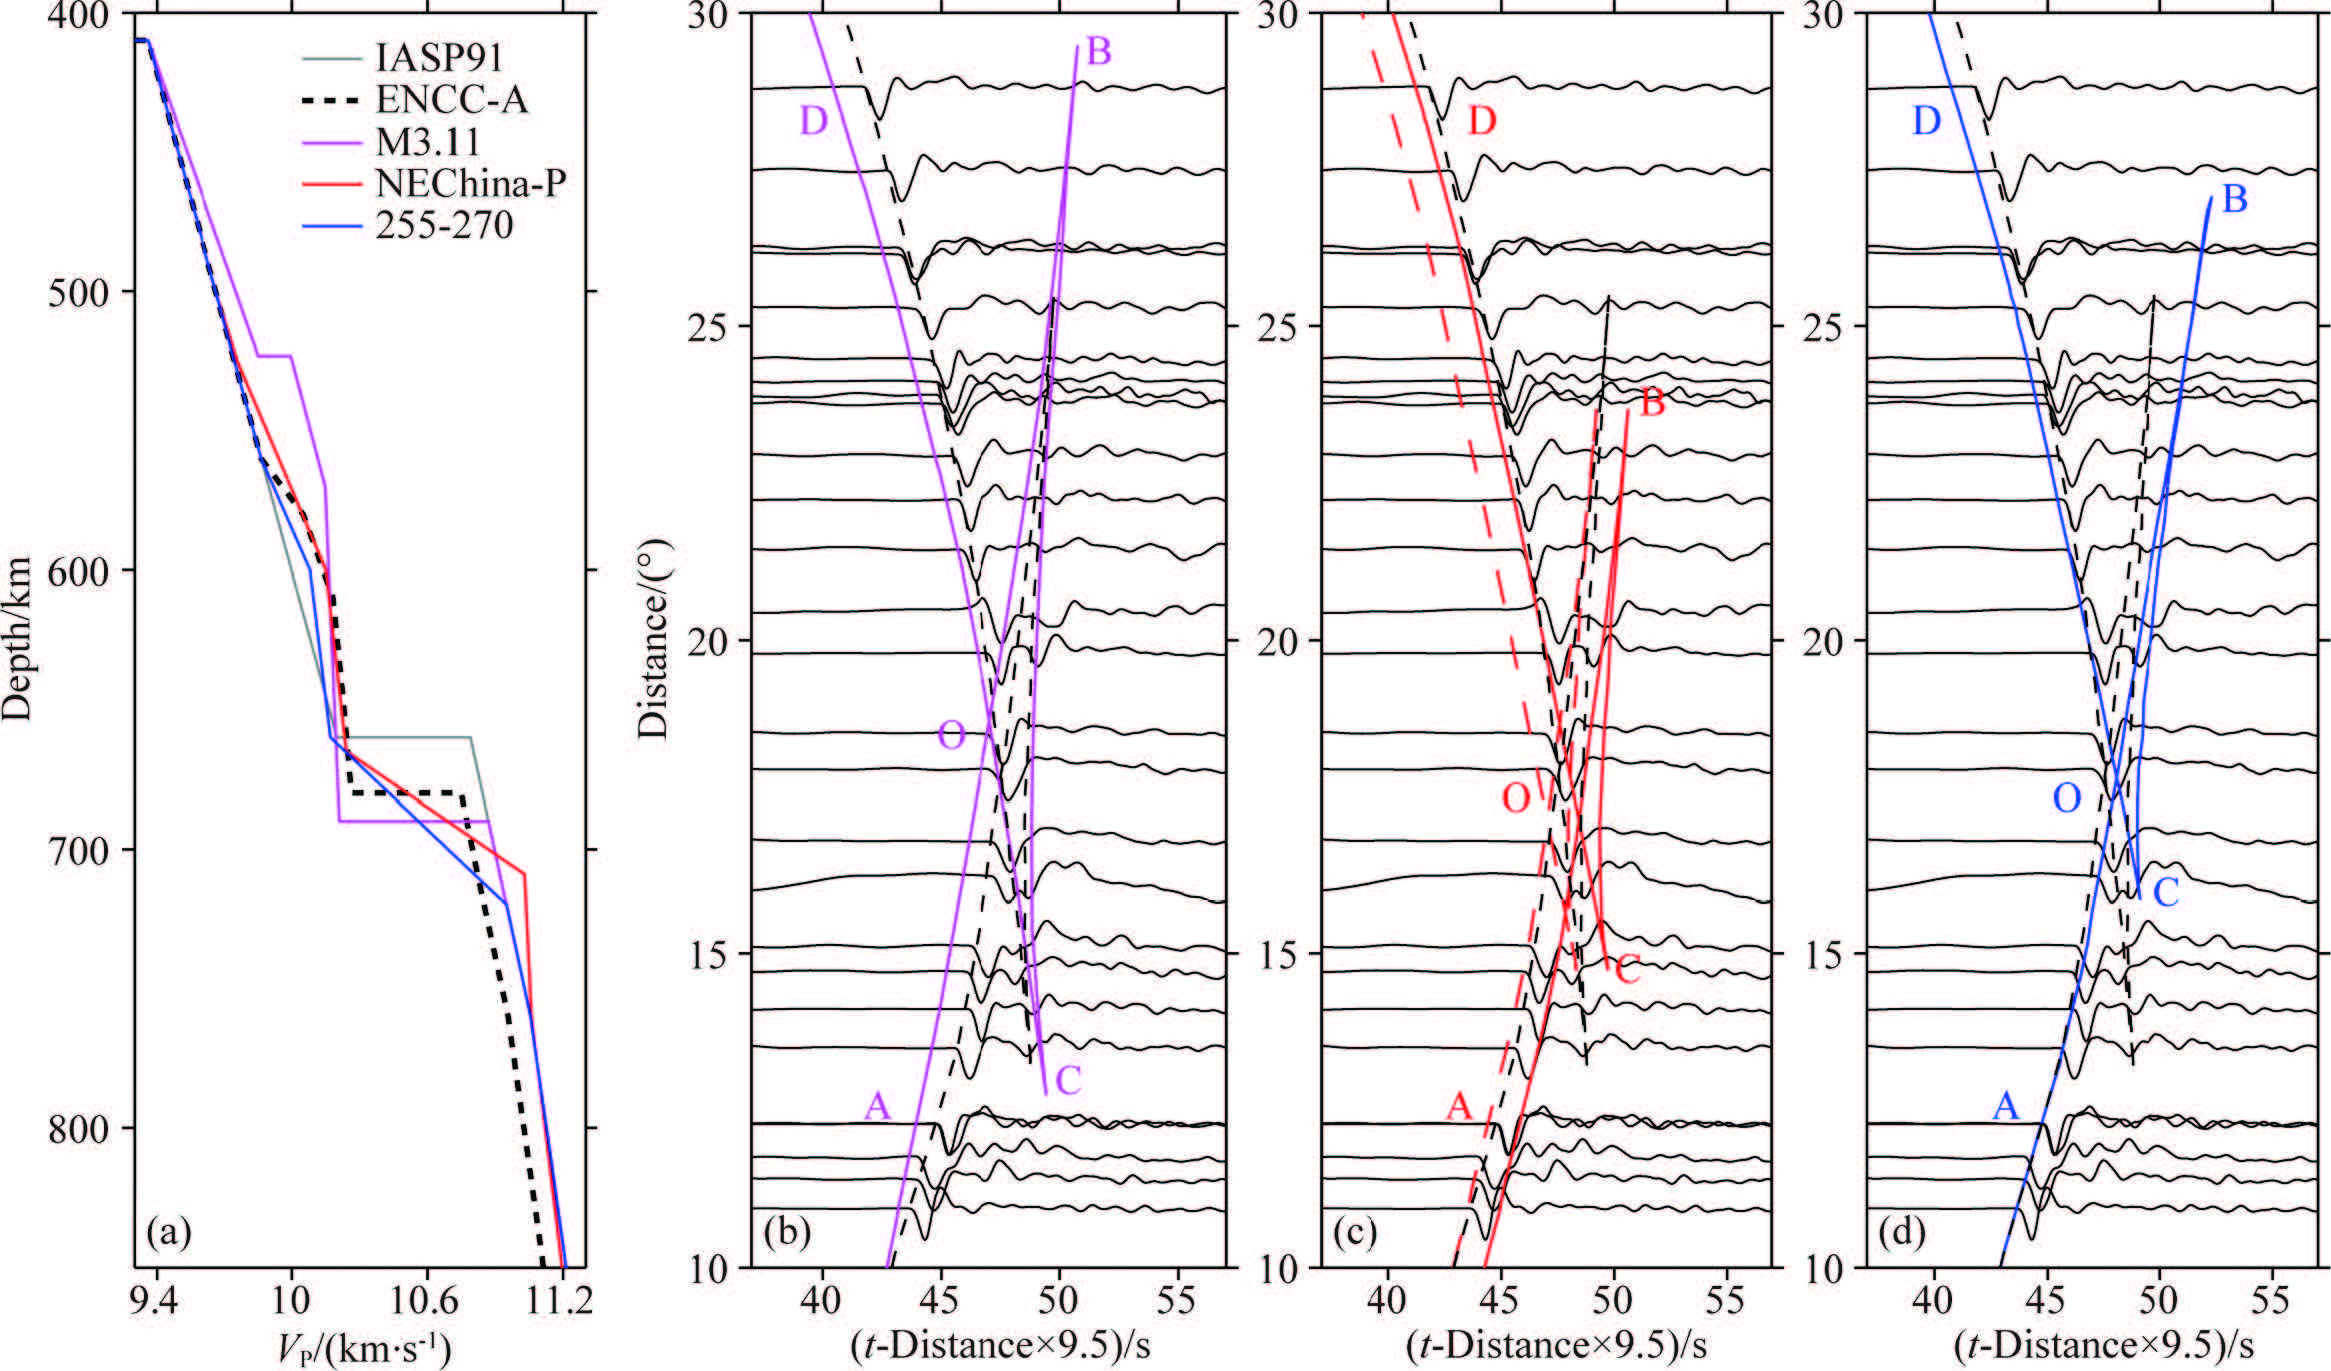
The ENCC-A model is selected to compare with the previous results, which include the M3.11 model (Tajima and Grand, 1995, 1998), the NEChina-P model (Ye et al., 2011; Ye and Li, 2012; Li et al., 2013) and the 255-270 model (the velocity model for azimuthal angle of 255°∼270° in Wang and Niu (2010)). Fig. 9a shows that all the models have the high-velocity layers above the 660, but the thicknesses and velocities of the layers are different. Only the ENCC-A model has a low-velocity anomaly below the 660.
|
Fig. 9 Travel-time comparison of ENCC-A model and velocity models in previous work |
The AB branch for the M3.11 model obviously appears earlier than the P-wave arrivals, and the epicentral distance of the cusp B is up to 29.4°(Fig. 9b), which is possibly caused by the high-velocity layer above the 660. The OC branch appears later than the P-wave arrivals, indicating the excess depression of the 660 in the M3.11 model. Li et al.(2013) found the systematic travel-time deviations, and modified the shallow structure of the NEChina-P model with the velocity structure of Fukao (1977) to eliminate the deviations. In this study, no systematic deviations (Fig. 4) are observed, and we apply the similar practice (Tajima and Grand, 1998) to make the shift (-1.4 s) on the travel-times of the NEChina-P model (Fig. 9c). The shifted AB branch consists with the P-wave arrivals; the 660 in NEChina-P model is a gradient layer, and then the cusp C (14.7°) has a larger epicentral distance. Comparing with the P-wave arrivals, the AB branch for the 255-270 model delays a little (Fig. 9d), indicating that the high-velocity anomaly above the 660 is not high enough. The cusp C appears from the epicentral distance 15.9°, which is related with the gradient layer of the 660. The travel-time differences between P-wave arrivals and the OD branches of the M3.11, the NEChina-P and the 255-270 models become larger while the epicentral distances increase. The ENCC-A model has a low-velocity anomaly (0.9%) below the 660, and the related OD branch can fit the P-wave arrivals well.
Our results reveal the high-velocity layer (115∼120 km) with the velocity increase of 1.5%∼2.0%. According to previous triplication results (140±20 km)(e.g., Tajima and Grand, 1995; Wang and Niu, 2010; Zhang et al., 2012; Li et al., 2013), the high-velocity layer could be related to the stagnant slab of the subducted Pacific plate. The stagnant slab has larger thickness than the normal oceanic plate (76∼77 km)(Zhou et al., 2010), possibly induced by the factors of slab piling (Zou et al., 2008; Tang et al., 2014) and deformation (Schmid et al., 2002; Fukao et al., 2009). Taking -6.5×10⁻⁵ K-1 as the temperature dependence of P-wave velocity near 660 km (Cammarano et al., 2003), the corresponding low temperature anomaly is 230∼300 K. Using the Clapeyron slope of -2.8 MPa/K (Hirose, 2002) and the mantle pressure gradient parameter of 35 MPa/km (Fossen, 2010), the theoretical depression of the 660 corresponding to the low temperature anomaly is about 18∼24 km, which is basically consistent with the depression detected (15∼20 km). The cold stagnant slab may induce the low-temperature environment in the MTZ and cause the depressed 660(Lebedev et al., 2002; Tang et al., 2014).
Both the ENCC-A and ENCC-B models have the low-velocity anomaly (0.6%∼0.9%) below the 660, but the ENCC-C model doesn’t have the anomaly, so the anomaly is distributed locally. For reference, three tomography profiles at 43°N, 41°N and 39°N in Huang and Zhao (2006) are selected to locate the anomaly. The 43°N and 41°N profiles mainly cross the turning points of the sub-regions A and B (Fig. 1), respectively, and both show the presence of the low-velocity anomaly (0.5%∼1.0%) under the stagnant slab (660∼1000 km), with the longitude range of 120°E-130°E, while the 39°N profile mainly cross the turning points of the sub-region C (Fig. 1), and no low-velocity anomaly can be observed. The low-velocity anomalies in the sub-regions A and B (115°E-128°E) are similar to the seismic tomography results, but deviate 2°∼5° west. Based on the cusp B/ in the sub-regions A and B, the maximum detection depths are up to 777 km and 772 km, respectively (Figs. 6c and 7c). Only the C/D/ branch is present after the cusp B/, so the P-wave triplications can not provide enough constraints on the low-velocity anomaly in deeper depths up to 821∼833 km. Considering the observed P-wave arrivals at 25°∼35° and the seismic tomography images (Huang and Zhao, 2006), the low-velocity anomaly may exist in deeper depths.
Comparing with the MTZ with high water capacity (Bercovici and Karato, 2003), the lower mantle has a much lower water solubility (Murakami et al., 2002; Ohtani, 2005). The sink slab of the lithosphere often undergoes the pressure-induced phase transitions and becomes denser in the lower part of the MTZ (van Mierlo et al., 2013), where water may be released from the decomposition of superhydrous phase B and expelled into the lower mantle (Ohtani et al., 2001; Yuen et al., 2007; Fukao et al., 2009). For the generally distributed stagnant slab in the area, a local closed region may appear under the slab, where the dehydrated water from the slab bottom can be stored. Meanwhile, the water decomposed from the phase D in the collapsed fragments in the lower mantle may also contribute to the low-velocity anomaly.
Wang and Chen (2009) proposed that the low-velocity anomaly below the 660 beneath the south Kurile may be related to the hot upwelling from the lower mantle. Seismic tomography images about the eastern NCC (Huang and Zhao, 2006; Li et al., 2008) show that the low-velocity anomaly is not rooted in the deep lower mantle. Zhao et al.(2012) reported that the low-velocity anomalies in the western Pacific area may be related to the hot material upwelling induced by the subducted slab and the collapsed slab fragments. If the low-velocity anomaly we detected indicates the hot upwelling from the shallow lower mantle, the corresponding high temperature anomaly is about 251∼323 K, while taking -2.8×10⁻⁵ K-1 as the temperature dependence of P-wave velocity near 700 km (Cammarano et al., 2003). The detailed origins of the low-velocity anomaly we detected are worth further studying.
AcknowledgeThanks to the DMC of China National Seismic Network at the Institute of Geophysics, China Earthquake Administration (doi:10.7914/SN/CB) and Incorporated Research Institute for Seismology (IRIS). We would like to thank Professor Li Juan and Wang Bao-Shan for kindly providing their results of the MTZ in the northeast China. We also thank two anonymous reviewers for their constructive comments that help to improve the manuscript. This work is supported by the National Natural Science Foundation of China (41274092, 41474040).
| [1] | Bassin C, Laske G, Masters G. 2000. The current limits of resolution for surface wave tomography in North America[J]. EOS Trans AGU, 81 : F897. |
| [2] | Bercovici D, Karato S-I. 2003. Whole-mantle convection and the transition-zone water filter[J]. Nature, 425 (6953): 39–44. |
| [3] | Cammarano F, Goes S, Vacher P, et al. 2003. Inferring upper-mantle temperatures from seismic velocities[J]. Physics of the Earth and Planetary Interiors, 138 (3-4): 197–222. DOI: 10.1016/S0031-9201(03)00156-0 |
| [4] | Chen W P, Tseng T L. 2007. Small 660-km seismic discontinuity beneath Tibet implies resting ground for detached lithosphere[J]. Journal of Geophysical Research, 112 (B5): B05309. DOI: 10.1029/2006JB004607 |
| [5] | Chu R S, Schmandt B, Helmberger D V. 2012. Upper mantle P velocity structure beneath the Midwestern United States derived from triplicated waveforms[J]. Geochemistry Geophysics Geosystems, 13 (1): Q0AK04. DOI: 10.1029/2011GC003818 |
| [6] | Dziewonski A M, Chou T A, Woodhouse J H. 1981. Determination of earthquake source parameters from waveform data for studies of global and regional seismicity[J]. Journal of Geophysical Research, 86 (B4): 2825–2852. DOI: 10.1029/JB086iB04p02825 |
| [7] | Ekström G, Nettles M, Dziewónski A M. 2012. The global CMT project 2004-2010:Centroid-moment tensors for 13, 017 earthquakes[J]. Physics of the Earth and Planetary Interiors, 200-201 : 1–9. DOI: 10.1016/j.pepi.2012.04.002 |
| [8] | Faccenda M. 2014. Water in the slab:A trilogy[J]. Tectonophysics, 614 : 1–30. DOI: 10.1016/j.tecto.2013.12.020 |
| [9] | Fossen H. 2010. Structural Geology[M]. New York: Cambridge University Press . |
| [10] | Fukao Y. 1977. Upper mantle P structure on the ocean side of the Japan-Kurile Arc[J]. Geophysical Journal International, 50 (3): 621–642. DOI: 10.1111/j.1365-246X.1977.tb01338.x |
| [11] | Fukao Y, Obayashi M, Inoue H, et al. 1992. Subducting slabs stagnant in the mantle transition zone[J]. Journal of Geophysical Research, 97 (B4): 4809–4822. DOI: 10.1029/91jb02749 |
| [12] | Fukao Y, Obayashi M, Nakakuki T, et al. 2009. Stagnant slab:a review[J]. Annual Review of Earth and Planetary Sciences, 37 : 19–46. DOI: 10.1146/annurev.earth.36.031207.124224 |
| [13] | Gudmundsson Ó, Sambridge M. 1998. A regionalized upper mantle (RUM) seismic model[J]. Journal of Geophysical Research, 103 (B4): 7121–7136. DOI: 10.1029/97jb02488 |
| [14] | Hirose K. 2002. Phase transitions in pyrolitic mantle around 670-km depth:Implications for upwelling of plumes from the lower mantle[J]. Journal of Geophysical Research, 107 (B4): ECV 3-1–ECV 3-13. DOI: 10.1029/2001JB000597 |
| [15] | Huang J L, Zhao D P. 2006. High-resolution mantle tomography of China and surrounding regions[J]. Journal of Geophysical Research, 111 (B9): B09305. DOI: 10.1029/2005JB004066 |
| [16] | ISC. 2012. On-line Bulletin. http://www.isc.ac.uk,Internatl.Seis.Cent.,Thatcham,UnitedKingdom. |
| [17] | Kennett B L N, Engdahl E R. 1991. Traveltimes for global earthquake location and phase identification[J]. Geophysical Journal International, 105 (2): 429–465. DOI: 10.1111/j.1365-246X.1991.tb06724.x |
| [18] | Lawrence J F, Wysession M E. 2006. Seismic evidence for subduction-transported water in the lower mantle.//Earth's Deep Water Cycle. American Geophysical Union, 251-261. |
| [19] | Lebedev S, Chevrot S, van der Hilst R D. 2002. Seismic evidence for olivine phase changes at the 410-and 660-kilometer discontinuities[J]. Science, 296 (5571): 1300–1302. DOI: 10.1126/science.1069407 |
| [20] | Lei J S, Xie F R, Fan Q C, et al. 2013. Seismic imaging of the deep structure under the Chinese volcanoes:An overview. |
| [21] | Physics of the Earth and Planetary Interiors, 224:104-123, doi:10.1016/j.pepi.2013.08.008. |
| [22] | Li C, van der Hilst R D, Engdahl E R, et al. 2008. A new global model for P wave speed variations in Earth's mantle[J]. Geochemistry Geophysics Geosystems, 9 (5): Q05018. DOI: 10.1029/2007GC001806 |
| [23] | Li C, van der Hilst R D. 2010. Structure of the upper mantle and transition zone beneath Southeast Asia from traveltime tomography[J]. Journal of Geophysical Research, 115 (B7): B07308. DOI: 10.1029/2009JB006882 |
| [24] | Li G H, Sui Y, Zhou Y Z. 2014. Low-velocity layer atop the mantle transition zone in the lower Yangtze Craton from P waveform triplication[J]. Chinese J. Geophys. , 57 (7): 2362–2371. DOI: 10.6038/cig20140730 |
| [25] | Li J, Wang X, Wang X J, et al. 2013. P and SH velocity structure in the upper mantle beneath Northeast China:Evidence for a stagnant slab in hydrous mantle transition zone[J]. Earth and Planetary Science Letters, 367 : 71–81. DOI: 10.1016/j.epsl.2013.02.026 |
| [26] | Murakami M, Hirose K, Yurimoto H, et al. 2002. Water in Earth's lower mantle[J]. Science, 295 (5561): 1885–1887. DOI: 10.1126/science.1065998 |
| [27] | Ohtani E, Mizobata H, Kudoh Y, et al. 1997. A new hydrous silicate, a water reservoir, in the upper part of the lower mantle[J]. Geophysical Research Letters, 24 (9): 1047–1050. DOI: 10.1029/97gl00874 |
| [28] | Ohtani E, Toma M, Litasov K, et al. 2001. Stability of dense hydrous magnesium silicate phases and water storage capacity in the transition zone and lower mantle[J]. Physics of the Earth and Planetary Interiors, 124 (1-2): 105–117. DOI: 10.1016/S0031-9201(01)00192-3 |
| [29] | Ohtani E. 2005. Water in the mantle[J]. Elements, 1 (1): 25–30. DOI: 10.2113/gselements.1.1.25 |
| [30] | Schmid C, Goes S, van der Lee S, et al. 2002. Fate of the Cenozoic Farallon slab from a comparison of kinematic thermal modeling with tomographic images[J]. Earth and Planetary Science Letters, 204 (1-2): 17–32. DOI: 10.1016/S0012-821X (02)00985-8 |
| [31] | Shearer P M. 2009. Introduction to Seismology[M]. 2nd ed. Cambridge: Cambridge University Press . |
| [32] | Song T-R A, Helmberger D V, Grand S P. 2004. Low-velocity zone atop the 410-km seismic discontinuity in the northwestern United States[J]. Nature, 427 (6974): 530–533. |
| [33] | Stern R J. 2002. Subduction zones[J]. Reviews of Geophysics, 40 (4): 3–1. DOI: 10.1029/2001RG000108 |
| [34] | Sui Y, Zhou Y Z. 2015. Low-velocity anomaly around 410 km beneath the Yellow and East China Seas with P wave triplications[J]. Acta Seismologica Sinica , 37 (1): 1–14. DOI: 10.11939/jass.2015.01.001 |
| [35] | Tajima F, Grand S P. 1995. Evidence of high velocity anomalies in the transition zone associated with Southern Kurile Subduction Zone[J]. Geophysical Research Letters, 22 (23): 3139–3142. DOI: 10.1029/95GL03314 |
| [36] | Tajima F, Grand S P. 1998. Variation of transition zone high-velocity anomalies and depression of 660 km discontinuity associated with subduction zones from the southern Kuriles to Izu-Bonin and Ryukyu[J]. Journal of Geophysical Research, 103 (B7): 15015–15036. DOI: 10.1029/98JB00752 |
| [37] | Tajima F, Katayama I, Nakagawa T. 2009. Variable seismic structure near the 660 km discontinuity associated with stagnant slabs and geochemical implications[J]. Physics of the Earth and Planetary Interiors, 172 (3-4): 183–198. DOI: 10.1016/j.pepi.2008.09.013 |
| [38] | Tang Y C, Obayashi M, Niu F L, et al. 2014. Changbaishan volcanism in northeast China linked to subduction-induced mantle upwelling[J]. Nature Geoscience, 7 (6): 470–475. DOI: 10.1038/ngeo2166 |
| [39] | Tian Y, Hung S-H, Nolet G, et al. 2007. Dynamic ray tracing and traveltime corrections for global seismic tomography. |
| [40] | Journal of Computational Physics, 226(1):672-687, doi:10.1016/j.jcp.2007.04.025. |
| [41] | van Mierlo W L, Langenhorst F, Frost D J, et al. 2013. Stagnation of subducting slabs in the transition zone due to slow diffusion in majoritic garnet[J]. Nature Geoscience, 6 (5): 400–403. DOI: 10.1038/ngeo1772 |
| [42] | Wang B S, Niu F L. 2010. A broad 660 km discontinuity beneath northeast China revealed by dense regional seismic networks in China[J]. Journal of Geophysical Research, 115 (B6): B06308. DOI: 10.1029/2009JB006608 |
| [43] | Wang P X. 2009. Interactions between Earth's deep and surface[J]. Advances in Earth Science, 24 (12): 1331–1338. DOI: 10.11867/j.issn.1001-8166.2009.12.1331 |
| [44] | Wang R J. 1999. A simple orthonormalization method for stable and efficient computation of Green's functions[J]. Bulletin of the Seismological Society of America, 89 (3): 733–741. |
| [45] | Wang T, Chen L. 2009. Distinct velocity variations around the base of the upper mantle beneath northeast Asia[J]. Physics of the Earth and Planetary Interiors, 172 (3-4): 241–256. DOI: 10.1016/j.pepi.2008.09.021 |
| [46] | Wang Y, Wen L X, Weidner D, et al. 2006. SH-velocity and compositional models near the 660-km discontinuity beneath South America and northeast Asia[J]. Journal of Geophysical Research, 111 (B7): B07305. DOI: 10.1029/2005JB003849 |
| [47] | Ye L L, Li J, Tseng T L, et al. 2011. A stagnant slab in a water-bearing mantle transition zone beneath northeast China:implications from regional SH waveform modelling[J]. Geophysical Journal International, 186 (2): 706–710. DOI: 10.1111/j.1365-246X.2011.05063.x |
| [48] | Ye L L, Li J. 2012. Detecting velocity structure around 660-km discontinuity beneath Northeastern China[J]. Acta Seismologica Sinica , 34 (2): 137–146. |
| [49] | Yuen D A, Karato S-I, Maruyama S, et al. 2007. Superplumes:Beyond Plate Tectonics. Netherlands:Springer. |
| [50] | Zhang R Q, Wu Q J, Li Y H, et al. 2012. Lateral variations in SH velocity structure of the transition zone beneath Korea and adjacent regions[J]. Journal of Geophysical Research, 117 (B9): B09315. DOI: 10.1029/2011jb008900 |
| [51] | Zhao D P, Yu S, Ohtani E. 2011. East Asia:Seismotectonics, magmatism and mantle dynamics[J]. Journal of Asian Earth Sciences, 40 (3): 689–709. DOI: 10.1016/j.jseaes.2010.11.013 |
| [52] | Zhao D P, Yanada T, Hasegawa A, et al. 2012. Imaging the subducting slabs and mantle upwelling under the Japan Islands[J]. Geophysical Journal International, 190 (2): 816–828. DOI: 10.1111/j.1365-246X.2012.05550.x |
| [53] | Zheng X F, Ouyang B, Zhang D N, et al. 2009. Technical system construction of Data Backup Centre for China Seismograph Network and the data support to researches on the Wenchuan earthquake[J]. Chinese J. Geophys. , 52 (5): 1412–1417. DOI: 10.3969/j.issn.0001-5733.2009.05.031 |
| [54] | Zhou C Y, Jin Z M, Zhang J F. 2010. Mantle transition zone:An important field in the studies of Earth's deep interior[J]. Earth Science Frontiers , 17 (3): 90–113. |
| [55] | Zou H B, Fan Q C, Yao Y P. 2008. U-Th systematics of dispersed young volcanoes in NE China:Asthenosphere upwelling caused by piling up and upward thickening of stagnant Pacific slab[J]. Chemical Geology, 255 (1-2): 134–142. DOI: 10.1016/j.chemgeo.2008.06.022 |
 2016, Vol. 59


