 2016, Vol. 59


2 College of Geoscience and Surveying Engineering, China University of Mining and Technology, Beijing 100083, China;
3 Key Laboratory of Mineral Resources, Institute of Geology and Geophysics, Chinese Academy of Sciences, Beijing 100029, China;
4 Mine Safety Technology Branch of China Coal Research Institute, Beijing 100013, China
In recent years, mine transient electromagnetic method(MTEM)has played an important role in detection of water abundance of roof and floor in roadway and advance detection of roadway(Cheng et al., 2014). MTEM is a kind of volume exploration method, which is restricted by the volume effect, and the resolution is difficult to meet the actual production requirement(Cheng et al., 2015). Furthermore, due to the influence of special field environment and metal objects in roadway, the gathered data usually contains certain noise, which leads to the decrease of the signal-to-noise ratio(SNR). Moreover, the detection results of MTEM are mostly expressed in a form of resistivity contour lines sectional drawing, which could not accurately distinguish the most important electrical interface of the actual geological setting. Because the physical and geometrical parameters of the anomalous body could be relatively highlighted, the TEM pseudo-seismic imaging technique based on Wave Field Transform is attracting increasing attention(Li and Xue, 2013). However, because the direction of the roadway advanced detection could not be very dense and sampling points are relatively sparse, SNR and resolution after the wave field transform imaging need to be further improved. The idea of synthetic aperture imaging(SAI)in Synthetic Aperture Radar(SAR)and Airborne transient electromagnetic(ATEM)provides a new method for MTEM SAI.
SAI technique was first applied in radar. Domestic and foreign scholars conducted a series of studies on SAI, and the research content mainly includes the algorithm, the application and the comparison of the imaging techniques, etc.(Cetin and Karl, 2001; Wang et al., 2004; Samadi et al., 2009), and it has been widely used in many fields. In ultrasonic detection, Jensen et al.(2006)improved the imaging resolution of medical ultrasonic detection image using SAI. Ganguli et al.(2012)studied the synthetic aperture focusing imaging technology of ultrasonic inspection for concrete. In electromagnetic exploration, Mason et al.(2001)studied the use of broadband borehole radar synthetic aperture interference method to plot 3D ore body map, Zhang and Zhou (2004)studied ground penetrating radar SAI based on stolt migration. In whole space transient electromagnetic numerical simulation, Li and Huang(2014)applied the complex frequency perfectly matched layer absorbing boundary condition to the uniform whole space model and the whole space model containing the roadway and the anomalous body. The above research does not concern the localization of the anomalous body boundary.
In the field of transient electromagnetic exploration, domestic scholars applied SAI technology to airborne transient electromagnetic firstly in view of the similarity between SAR and airborne transient electromagnetic. Li et al.(2010)studied SAI of airborne transient electromagnetic data to improve the resolution and increase the depth of exploration. The reason why the method of synthetic aperture radar is introduced into the ground transient electromagnetic data processing is that the secondary field data received at different points, excited by the same emission source, is equivalent to the array data of a single emitter of SAR, and all of the ground transient electromagnetic emission sources constitute dynamic source observation. Because MTEM detection device and data acquisition method are basically similar to the ground TEM, so, like ground transient electromagnetic SAI method, a similar processing of MTEM data is feasible. In this paper, the SAI technique is used to deal with the pseudo-seismic signal after the MTEM wave field transformation. The application effect of SAI was testified with the in-site advanced detection in roadway using the MTEM, which can achieve the purpose of highlighting the weak anomaly and improving the interface resolution.
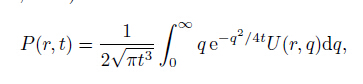
2 PRINCIPLE OF WAVE-FIELD TRANSFORMThe mathematic integral form of transient electromagnetic field and corresponding pseudo-seismic wave field can be expressed as(Lee et al., 1989):
|
(1) |
where P(r, t)is the transient electromagnetic field and U(r, q)is the pseudo-seismic wave field to be solved and q is the variable corresponding to t for the wave field U(r, q)and the unit for q is 
|
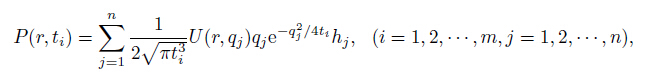
(2) |
where m is the sampling number and n is the amount of numerical integral interval and hj is the integral step size.
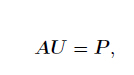
Rewriting Eq.(2)into matrix form:
|
(3) |
where U =(u1, …, … uj,…, un)T is the discrete virtual wavelet and P =(p1, , pi, , pm)T is the discrete transient electromagnetic field and 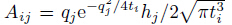
The problem that the coefficient matrix A in Eq.(3)is usually an ill-posed problem needs attention. Then the stable solution of the matrix equations was obtained by the damped least square method(Yang, 1997). We could establish an objective function as follows:
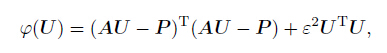
|
(4) |
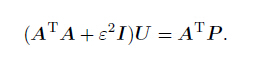
where 2 represents the damping factor. Assigning zero to the gradient of Eq.(4), then
|
(5) |
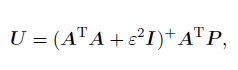
Then, the above equation becomes
|
(6) |
where(ATA + ε2I)+ is the Moore-Penrose(M-P)generalized inverse of(ATA + ε2I). We can achieve the solution of the generalized inverse by IMqrginv method(Ataei, 2014). The damping factor should give a compromise between resolution and variance by experiment(Yang, 1997; Chen et al., 1999). The data of MTEM advanced detection comes from different directions at the same working face. We could use the same damping factor in wave-field transformation for the advanced detection data of the same working face because of same errors during data acquisition.
Errors of transient electromagnetic field would seriously affect pseudo-seismic wave field after wave-field transformation, and it will be more serious when the unit covariance matrix of solution estimation is large (Yang, 1997). Therefore, we need filter the data before wave-field transformation, and the wavelet transform filter method based on the experimental results can achieve a better effect(To et al., 2009).
The gathered signal consists of forward echo and backward echo because MTEM advanced detection is located at mine roadway working face. The whole-space response of MTEM is approximately corrected to be half-space response based on the relationship of TEM field between homogeneous half-space and whole space. Consequently, forward echo signal is obtained in advanced detection. The relation of TEM field between homogeneous half-space and whole-space(Kaufman and Eaton, 2001)is
|
(7) |
where BzW is the whole-space response of transient electromagnetic field and BzH is the half-space response of TEM field and k is the proportional coefficient of components of the whole-space and half-space response of TEM field. The coefficient k in Eq.(7)is equal to 5/2 when τ /r > 15 for in loop and coincident configuration in uniform whole-space medium by Kaufman and Eaton(2001). Here r is the radius of transmitter coil, 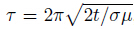
SAR uses the relative motion of the radar-target. The time sampling signal received by the element array in the different relative space position is used to replace the spatial sampling signal of the large size source. The trajectory formed by the relative motion between radar and target constitutes a synthetic aperture which is used to replace the large real aperture. The small real antenna aperture is synthesized to form a large equivalent aperture radar using a data processing method. SAR is characterized by high resolution, and it could effectively identify the target object(Chan and Koo, 2008). The principle of SAI is shown in Fig. 1a.

|
Fig. 1 Schematic diagram of SAI of SAR (a) and ground TEM (b) |
The ground TEM is to lay a rectangle transmission loop on the ground. TEM signal is received inside and outside the loop. The TEM signal is also observed in the moving mode for the ground TEM, and the signals between different emission sources satisfy quasi coherent emission. Therefore SAI can also be applied to the ground TEM(Li Xiu et al., 2012; Guo et al., 2012). The principle of the ground TEM synthetic aperture is shown in Fig. 1b.
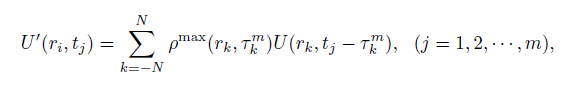
The equation of SAI after wave field for ground TEM is(Li et al., 2012)
|
(8) |
where U(ri, t)is the wave field value of point i and ri is the distance from point i to point −N, τ , N and τ is the relative time shift and 2N + 1 is the length of synthetic aperture and τkm is the time shift corresponding to the maximum normalized cross-correlation coefficient ρmax(rk, τkm )called the best time shift and U'(ri, tj)is the value after synthetic aperture imaging.
From the above radar and ground TEM SAI technology it could be concluded that the nature of the SAI method is the correlation stacking between the signals from different measurement points.
3.2 Principle and Method of Synthetic Aperture Imaging in Advanced Detection of Roadway Using Mine Transient Electromagnetic MethodThe location of MTEM advanced detection is at the roadway working face shown in Fig. 2a, in which smallrectangular loop source is close to the working face. The dotted circles represent the “smoke ring" at different times of transient electromagnetic primary field ahead of the working face. Different detection directions oftenconstitute a sector. That is, small loop source is placed at the working face and the forward direction of the roadway act as the central axis, data is collected when transmitter loop rotates to nΔ left and right, where Δ is an angle constant, and usually 10° or 15°. At last it forms the sector detection section, as shown in Fig. 2b.Arrows indicates different detection directions(normal direction of transmitter loop)in the same section, the dashed box represents anomalous body ahead of working face. Assuming that the Z axis indicates the front of the working face, the direction of Z axis is 0°, the angle θ with the Z axis is used to define the detection direction(the angle on the left side of Z axis is negative and the right positive), namely U(−θi)means the measured signal value on the left side of Z axis and the included angle with Z axis is θi and U(+θi)means the measured signal value on the right side of Z axis and the included angle with Z axis is θi.

|
Fig. 2 Schematic diagram of roadway advanced detection using MTEM |
From the data acquisition way in advanced detection of roadway using MTEM in Fig. 2, it could beconcluded that the geological conditions of the whole space range around the same working face is certainduring the data collection. TEM signal gathered in different detection directions(that is, different source, equivalent to the different stations of ground TEM)have quasi coherent emission. Therefore, there is thecondition of coherent superposition for MTEM data, it could use SAI.
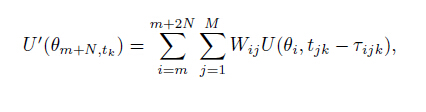
Based on the TEM pseudo-seismic wave field transform and deconvolution and time-depth conversion(Cheng et al., 2013), this paper presents the following SAI equation according to the idea of SAI:
|
(9) |
where U'(θm+N,tk)is the value in the detection direction of θm+N after SAI and θm is the initial detectiondirection, while θm+2N is the terminal detection direction and m is the number of initial detection directionand m + 2N is the number of terminal detection. 2N + 1 means the length of Synthetic Aperture. M refersto the number of repeated measurement on the same detection direction. Wij is a weighting function. U(θi, tj)represents pseudo-seismic wave amplitude value of the jth measurement in the detection direction of θi afterwave field transform of MTEM. τijk is time shift quantity when Wij gets the extreme value. K is the numberof time window in q domain on a certain detection direction after wave field transform.
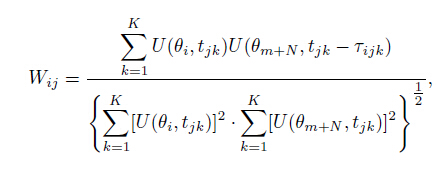
The weight function Wij is the correlation coefficient, which is given by the following equation:
|
(10) |
where i is m, m+1, …, m+2N in turn and j = 1, 2, , M. τijk is the relative time shift quantity when Eq.(10) gets maximum. Synthetic aperture schematic of advanced detection in roadway is shown in Fig. 3.

|
Fig. 3 Synthetic aperture schematic of advanced detection in roadway |
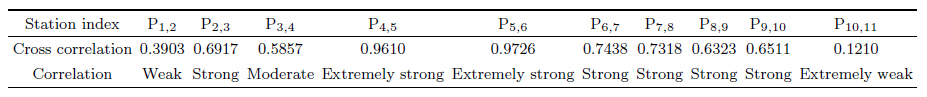
Correlation coefficients represent the correlation degree between two signal values after wave field transform.The correlation coefficient is closer to 1 or -1, the correlation is stronger, otherwise, the correlation coefficient is closer to 0, the correlation is weaker. In the usual case, the correlation between the signals is judged by the following values(see Table 1).
|
|
Table 1 Relation between correlation coefficient and correlation |

When working face reaches to G22+5 m in a certain mine, it's necessary to ascertain whether there are hydrous geologic body in front of the working face, to make clear of conditions of water in sandstones and fault zones, and to interpret the anomaly area in terms of geology. This area is advance detected using in-loop TEM.The current is 1.8 A. Turn-off time is about 110 μs, the length of a side of the loop is 2 m×2 m and the time range is from 116.8 μs to 7088 μs which is greater than the turn-off time of the measured data. The roadway surrounding rock is sandstone, its resistivity exceeds 20 Ωm.
The measured induced electromotive force curve of the station horizontal section's 11 directions at G22+5 m is shown in the Fig. 4, the direction of roadway is 0°, each 10° to left side is a detecting direction until 50°, the same as the right side. The Fig. 4 is the horizontal section of measured induction electromotive force.

|
Fig. 4 The measured induction electromotive force on horizontal section by MTEM at G22+5 m |
After filtering and whole-space correction of the data shown in Fig. 4, a pseudo-seismic signal of 11 detecting directions in the station's horizontal section could be obtained after a series of data processing such as wavefield transform and time-depth conversion(Cheng et al., 2013). Horizontal axis means depth and vertical axis represents detecting directions, just as shown in Fig. 5. From the Fig. 5, it's concluded that there are two apparent but relatively weak lineups in the pseudo-seismic signal. The first reflects the interface features from high resistance to low resistance which is at the range of 30~40 m and its energy is relatively strong, the second reflecting the interface features from low resistance to high resistance is within the range of 65 m to 80 m, its energy is relatively weak(Cheng et al., 2013).

|
Fig. 5 The pseudo-seismic wave-field signal after being transformed on horizontal section by MTEM at G22+5 m |
We can conclude that the minimum correlation coefficient is 0.12 and the maximum correlation coefficient is 0.9726 through calculating the correlation coefficient between two detecting directions of 11 detection directions from Eq.(10).
The length of synthetic aperture is usually obtained by some tests. Choosing data from some detecting directions to stack after determining the direction of the central detection, the effect will be better. According to the feature of MTEM, there are 11 directions' data from horizontal section. After choosing data from three directions and four directions to have a synthetic aperture test, 3 directions' synthetic aperture is confirmed.
Figure 6 represents the pseudo-seismic signal after MTEM SAI at G22+5 m. There is no change in the extreme value of wave-field transform curve's position, and no migration in depth. That is to say synthetic aperture does not affect the relationship between extreme value of wave-field transform curve and depth.

|
Fig. 6 The pseudo-seismic wave-field signal after SAI on horizontal section by MTEM at G22+5 m |
Comparing Fig. 5 and Fig. 6, the waveform of detection direction well related to adjacent directions isstrengthened after SAI. Take the data from –20° to +20°, the amplitude of the two curves is relatively flat196 Chinese J. Geophys. Vol.59, No.2Fig. 4 The measured induction electromotive forceon horizontal section by MTEM at G22+5 mFig. 6 The pseudo-seismic wave-field signal afterSAI on horizontal section by MTEM at G22+5 mFig. 5 The pseudo-seismic wave-field signalafter being transformed on horizontalsection by MTEM at G22+5 m before synthetic aperture, but after synthetic aperture, its amplitude becomes bigger, the signal is strengthenedand the width of waveform is not changed. Whilethe small anomaly resulting from noise in the poor correlationdetection direction was further weakened afterSAI. At the relatively poor correlation directions(−50° and +50°), the amplitude of curve is relativelyflat before SAI. The amplitude of curve is weakenedafter synthetic aperture. While the amplitude of curveof other directions is strengthened in varying degreesafter SAI. On the whole, the significant weak anomalyin each direction is strengthened, the SNR is improvedand the effect of synthetic aperture is significant.
|
|
Table 2 Correlation coefficient and correlation between adjacent data after wave-field transforming on horizontal section at G22+5 m |
From the above analysis, we can see that the synthetic aperture processing does not affect the corresponding relationship between the extreme points and the depth of the pseudo-seismic wave field. In the stronger correlation direction, the extreme points of pseudo-seismic signal are significantly enhanced by synthetic aperture; while in the weak correlation direction, the extreme points of pseudo-seismic signal are weakened by synthetic aperture. This shows that the SAI could improve the resolution through highlighting the weak anomalies and suppressing false anomalies in MTEM.
The pseudo-seismic wave-field curves of the Fig. 6 are normalized to locate electrical interface in combination with the fan-shaped coordinate of actual section; it is conducive to interpretation. Comparing section of SAI with conventional apparent resistivity section at G22+5 m position of advanced detection shown in Fig. 7, it is observed that there is a low resistivity anomaly in conventional apparent resistivity section. It's in the range from about 20 m to 60 m. Its center is located at about 34 m ahead of working face. There are two electrical interfaces in the section of SAI. The first is located at 35 m ahead, the energy of signal is powerful, it should be a discontinuity interface from high resistivity area to low resistivity area. The second is located at 73 m ahead, the signal energy is relatively weak, it should be the discontinuity interface from low resistivity area to high resistivity area. Two interfaces are approximately straight lines and nearly vertical to detection directions. Roadway excavation revealed that rich water area of sandstone is in front of station about 33~70 m, and interpretation results are in good agreement with SAI, but conventional apparent resistivity section with reflection of actual profile has certain deviation. This further illustrates that there is a relatively big error to determine the electrical interface position only by the change of apparent resistivity section diagram and SAI has obvious advantages to determine the electrical interface.

|
Fig. 7 Comparison of conventional resistivity section and SAI section |
The SAI of MTEM is realized in this paper on the basis of transforming MTEM wave field to pseudoseismic wave field. The effectiveness and practicability of the method are discussed and proved combining with engineering application example. The main conclusions are as follows:
(1) The signal of waveform in the good correlation direction is strengthened after SAI through comparing and analyzing the waveform before and after SAI. The width of wave has no change. While the small anomalies resulting from noise in the poor correlation detection direction was further weakened after SAI, it reduces the random noise and improves the SNR.
(2) The effect of SAI is strongly related to the cross-correlation coefficient. The larger cross-correlation between pseudo-seismic wave-field from different detection directions would obtain better effect.
(3) From the actual data processing and analysis we can know :The low-resistant anomalous bodies were presented as an amplified low-resistant area in conventional apparent resistivity contour map, while it was shown as two more precise electrical interfaces after SAI. The resolution of electric interface would be greatly improved using SAI. In general, the amplitude was strengthened after SAI over the discontinuity interface from high resistivity area to low resistivity area. On the contrary, the signal was relatively weak over the discontinuity interface from low resistivity area to high resistivity area after transforming and the amplitude was small after SAI. Further study should be made on the improvement of signal energy after SAI at the discontinuity interface from low resistivity area to high resistivity area.
(4) The SAI could be used to highlight the information of electrical interface from MTEM data, to make up the certain deficiency of abnormal body depth in MTEM and improve SNR, highlight the weak anomaly and to improve resolution and exploration accuracy. Detailed detection of MTEM to abnormal low resistance electrical interface has been developed.
AcknowledgeThis work was supported by the National Natural Science Foundation of China(51574250, 51174210).
| [1] | Ataei A. 2014. Improved Qrginv algorithm for computing moore-penrose inverse matrices. ISRN Applied Mathematics, 2014:Article ID 641706. |
| [2] | Cetin M, Karl W C. 2001. Feature-enhanced synthetic aperture radar image formation based on nonquadratic regularization[J]. IEEE Transactionson Image Processing, 10 (4): 623–631. |
| [3] | Chan Y K, Koo V C. 2008. An introduction to synthetic aperture Radar (SAR)[J]. Progress in Electromagnetics Research B, 2 : 27–60. |
| [4] | Chen B C, Li J M, Zhou F T. 1999. Wave-field conversion method for transient electromagnetic field[J]. OGP (in Chinese), 34 (5): 539–545. |
| [5] | Cheng J L, Li F, Peng S P, et al. 2014. Research progress and development direction on advanced detection in mine roadway working face using geophysical methods[J]. Journal of China Coal Society (in Chinese), 39 (8): 1742–1750. |
| [6] | Cheng J L, Li F, Peng S P, et al. 2015. Joint inversion of TEM and DC in roadway advanced detection based on particle swarm optimization[J]. Journal of Applied Geophysics, 123 : 30–35. |
| [7] | Cheng J L, Qiu H, Ye Y T, et al. 2013. Research on wave-field transformation and data processing of the mine transient electromagnetic method[J]. Journal of China Coal Society (in Chinese), 38 (9): 1646–1650. |
| [8] | Ganguli A, Rappaport C M, Abramo M, et al. 2012. Synthetic aperture imaging for flaw detection in a concrete medium[J]. NDT & E International, 45 (1): 79–90. |
| [9] | Guo W B, Xue G Q, Li X, et al. 2012. Correlation analysis and imaging technique of TEM data[J]. Exploration Geophysics, 43 (3): 137–148. |
| [10] | Jensen J A, Nikolov S I, Gammelmark K L, et al. 2006. Synthetic aperture ultrasound imaging[J]. Ultrasonics, 44 : e5–e16. |
| [11] | Kaufman A A, Eaton P A. 2001. The Theory of Inductive Prospecting[M]. New York: Elsevier: 365 -373. |
| [12] | Lee K H, Liu G, Morrison H F. 1989. A new approach to modeling the electromagnetic response of conductive media[J]. Geophysics, 54 (9): 1180–1192. |
| [13] | Li X, Qi Z P, Liu Y A, et al. 2010. A research of synthetic aperture rapid imaging of ATEM.//26rd CGS, Chinese Geophysics 2010(in Chinese). 639. |
| [14] | Li X, Xue G Q. 2013. Study on Pseudo-Seismic Migration Imaging of Transient Electromagnetic Method. Study on Pseudo-Seismic Migration Imaging of Transient Electromagnetic Method[M]. Beijing: Science Press . |
| [15] | Li X, Xue G Q, LiuY A, et al. 2012. A research on TEM imaging method based on synthetic-aperture technology[J]. Chinese J. Geophys. (in Chinese), 55 (1): 333–340. DOI: 10.6038/j.issn.0001-5733.2012.01.034 |
| [16] | Li Z H, Huang Q H. 2014. Application of the complex frequency shifted perfectly matched layer absorbing boundary conditions in transient electromagnetic method modeling[J]. Chinese J. Geophys. (in Chinese), 57 (4): 1292–1299. DOI: 10.6038/cjg20140426 |
| [17] | Mason I, Osman N, Liu Q, et al. 2001. Broadband synthetic aperture borehole radar interferometry[J]. Journal of Applied Geophysics, 47 (3-4): 299–308. |
| [18] | Qi Z P. 2011. 3D continuation imaging technology with a synthetic aperature based on the transient electromagnetic method (in Chinese). Xi'an:Chang'an University. |
| [19] | Samadi S, Ç etin M, Masnadi-Shirazi M A. 2009. Multiple feature-enhanced synthetic aperture radar imaging.//Proc. SPIE Algorithms Synthetic Aperture Radar Imagery, XVI. Orlando, Florida, USA. |
| [20] | To A C, Moore J R, Glaser S D. 2009. Wavelet denoising techniques with applications to experimental geophysical data[J]. Signal Processing, 89 (1): 144–160. |
| [21] | Wang Z L, Zhou Y P, Zhang W, et al. 2004. Synthetic aperture imaging techniques[J]. Journal of Harbin Institute of Technology (in Chinese), 36 (3): 384–387. |
| [22] | Yang H Y, Deng J Z, Zhang H, et al. 2010. Research on full-space apparent resistivity interpretation technique in mine transient electromagnetic method[J]. Chinese J. Geophys. (in Chinese), 53 (3): 651–656. DOI: 10.3969/j.issn.0001-5733.2010.03.020 |
| [23] | Yang W C. 1997. Theory and Methods of Geophysical Inversion (in Chinese). Theory and Methods of Geophysical Inversion (in Chinese)[M]. Beijing: Geological Publishing House: 45 -67. |
| [24] | Zhang C C, Zhou Z O. 2004. Ground penetrating radar synthetic aperture imaging based on Stolt migration[J]. Chinese Journal of Radio Science (in Chinese), 19 (3): 316–320. |