 2016, Vol. 59


2 Equipment Academy of Rocket Force, Beijing 100085, China;
3 Unit 63889 of PLA, Hunan Mengzhou 454750, China
Spaceborne interferometric synthetic aperture radar(InSAR)is one of the most effective tools for Digital Elevation Model(DEM)data acquisition. Recently, the related technique of distributed spaceborne InSAR has become a popular research topic internationally. After DTED-2 standard DEMs were successfully acquired by the SRTM(Farr et al., 2000; Werner, 2001; Rabus et al., 2003), HRTI-3 standard DEMs acquired by the TerraSAR-X/TanDEM-X satellites(Schattler et al., 2011; López-Dekker et al., 2011)are a milestone for InSAR. Precision in the evaluation of InSAR performance is necessary for experimental verification of systems at the project design stage as well as in calibration and testing of systems during the operational orbit stage. Special attention should be paid to the absolute/relative interferometric phase and height precisions that directly influence the DEM precision. High precision indexes could supply data for system performance analysis, error isolation, troubleshooting and diagnosis. The height precision could be superficially evaluated by comparing the DEM acquired by InSAR with higher precision DEMs acquired by other methods, such as laser measurement(Wang, 2011). However, sub-meter high precision DEMs are usually limited in local area and difficult to obtain. Meanwhile, the precision of publicly available SRTM DEM and ASTER DEM data is too low to fit modern InSAR system criteria. The ideal interferometric measurement performance evaluation method created by researchers(Eineder, 2003; Lu, 2006; Wang, 2009), shows good performance in theory but weak performance in practice for the dependence of whole-scene point calculations, system range error and time synchronization. Thus, this method could not be used to evaluate objectively. To achieve precise, highly efficient and robust performance evaluation in InSAR, this paper describes an improved performance evaluation method based on virtual prominent scatterers(VPS). In the second section, the advantages and disadvantages of using the method based on prominent scatterers(PS)in practice are introduced. In the third section, the definitions of VPS and descriptions of the improved method are introduced. In the fourth section, the quantitative InSAR performance evaluation simulation and the analysis based on VPS are executed. Conclusions are drawn in the last section.
2 INSAR PERFORMANCE EVALUATION METHOD BASED ON PROMINENT SCATTERERSAND ITS SHORTCOMINGS This evaluation method requires selecting prominent scatterers with high signal to clutter ratio in three dimensional natural scenes or setting strong scatterers in land simulations which are used as the samples in performance index calculation. In the orbit test, both corner reflectors at the calibration site and strong scatterers with accurate measurements could act as prominent scatterers. The three-dimensional coordinates Pi(xi, yi, hi)of carefully laid prominent scatterers i(i = 1, 2, · · ·, N)are known. To avoid the influence of side lobe response, the spacing between prominent scatterers should be over 50 cells.
Prominent scatterers were chosen as evaluation samples to obtain pixel positions in SAR images, utilizing the high signal to clutter ratio. First, the position of prominent scatterer i in master and slave coregistrations of the SAR image(a1i, r1i)and(a2i, r2i)can be obtained by selecting the maximum local scattering amplitude from sinc interpolation. Then, the position of master and slave satellites S1i and S2i can be obtained according to the azimuth time of the SAR image. The interferometric phase of ideal prominent scatterer φi can be given by the following equation, where λ is radar wavelength:

|
(1) |
According to the relationship between the SAR image, the interferometric phase and the land target, the absolute interferometric phase ${{\hat{\phi }}_{i}}$ and estimated three-dimensional coordinates 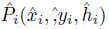
The four main InSAR performance evaluation equations are given in(2)-(5).
(1)Absolute phase precision:

|
(2) |
(2)Relative phase precision:
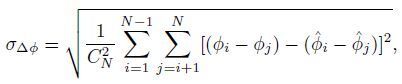
|
(3) |
(3)Absolute height precision:
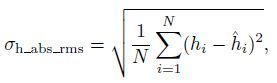
|
(4) |
(4)Relative height precision:

|
(5) |
Because the positions of the prominent scatterers were evaluated precisely, the above evaluations can be accurate. It is important to note that the output result can evaluate the InSAR performance of the prominent scatterers but cannot evaluate the InSAR performance for the natural scenes around prominent scatterers, especially the relative precision associated with phase noise.
Figure 1a and Fig. 2a are prominent scatterers of SAR images with signal to clutter ratios(SCR)of 22 dB and 12 dB, respectively. Figs. 1b, 1c, 2b, and 2c show azimuth profiles and range profiles of prominent scatterers. The position of the peak where the SCR was 22 dB is relatively clear. The position of the peak where the SCR was 12 dB is less easily identified. Fig. 1d and Fig. 2d show the coherences in two situations where it was evident that the higher the SCR of prominent scatterers was, the higher the coherence was. This is similar to permanent scatterers(Ferretti et al., 2001).

|
Fig. 1 Prominent scatterers SAR images and coherence where SCR was 22 dB |

|
Fig. 2 Prominent scatterers of SAR images and coherence where SCR was 12 dB |
Higher coherence of prominent scatterers significantly improves the InSAR measurement accuracy. The corresponding result could not veritably reflect the performance of InSAR height precisions. In next section, the method using VPS is introduced and the advantages and disadvantages in practice are also discussed.
3 PERFORMANCE EVALUATION OF INSAR BASED ON VPSWe chose a land scene scatterer at Piv, △Pi from the position Pi of prominent scatterer i(i = 1, 2, · · ·, N)for a VPS i(Fig. 3).

|
Fig. 3 Relationship between VPS and prominent scatterers |
The VPS is a typical three-dimensional scene scatterer in which the precision of the interferometric phase and DEM measurements can objectively reflect the InSAR performance. According to the second section, the position of prominent scatterer(ai, ri)could be estimated precisely because of higher SCR. For precise InSAR indicator results, it is necessary to obtain the position of VPS(aiv, riv)in the SAR image. However, VPS are not high SCR scatterers, so the coordinates could not be interpolated and detected directly.
As reflected in Fig. 3, if the relative location between VPS and real prominent scatterer(△ai, △ri)can be estimated precisely, then the position of VPS(aiv, riv)is solely defined. Geometric positioning technology using the Range-Doppler equations(Schreier, 1993; Roth et al., 2005)confirms this point.
The Range-Doppler equations of the master, slave image is

|
(6) |
|
(7) |
|
(8) |
|
(9) |
|
(10) |
|
(11) |
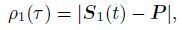
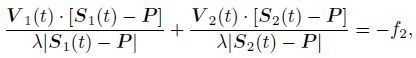
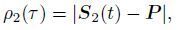
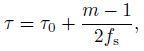
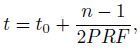
where τ and τ0 are the fast time of the number m pixel and the first pixel in the range respectively, fs is the sampling frequency of the radar, t and t0 are the slow time of the number n pixel and the first pixel in the azimuth respectively, PRF is the pulse repetition frequency of the radar, S1(t), S2(t)and P are the position of the master satellite, slave satellite, and land scatterer respectively, V1(t)and V2(t)are the velocity of the master satellite and slave satellite respectively, ρ1(τ)and ρ2(τ)are the ranges of land scatterer in the two SAR images, and f1 and f2 are the Doppler central frequency of the master and slave pass respectively.
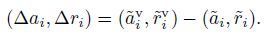
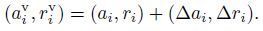
Given the radar parameters, satellite orbit, VPS and corresponding land positions of real prominent scatterers in the above equations, the coordinates of image pixels can be estimated precisely through nonlinear iteration. $(\tilde{a}_{i}^{V}, \tilde{r}_{i}^{V})$ and $({{\tilde{a}}_{i}}, {{\tilde{r}}_{i}})$ are the i(i = 1, 2, · · ·, N)VPSs and the corresponding image coordinates of the real prominent scatterers, respectively. Although $(\tilde{a}_{i}^{V}, \tilde{r}_{i}^{V})$ and $({{\tilde{a}}_{i}}, {{\tilde{r}}_{i}})$ could be estimated less precisely due to the influence of satellite orbit errors, radar range measurement errors and time synchronization errors, the relative image position between them can be obtained precisely in small locations because the system errors make slow progress in space and time.
|
(12) |
The precise image coordinates of the VPS are as shown below:
|
(13) |
Moreover, using the index calculation of Section 2, we chose VPSs as evaluation of sample points. Then, the four performance indexes were calculated using Eqs.(2)-(5).
It is worth noting that the relative distance between VPSs and real prominent scatterers △Pi should be limited to 50~100 cells. Spacing that is too small would be affected by the side lobe energy of the prominent scatterers; conversely, spacing that is too large would deteriorate the relative image location accuracy.
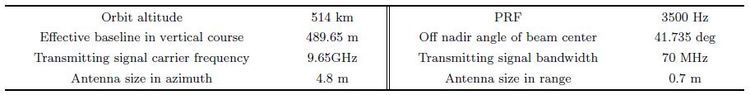
4 SIMULATION EXPERIMENT AND ANALYSISThe simulation experiment was based on one-emission and two-reception distributed spaceborne InSAR. TanDEM-X satellite and radar system parameters are referred and shown in Table 1. The simulated scene is a mountainous region scaling to approximately 3 km×3 km. The average slope was less than 10 degrees, and there were 100 prominent scatterers with spacing greater than 150 m. The back scattering coefficient of all prominent scatterers was 20 dBm2. Two main system errors were considered, interferometric phase error in different coherences and a 10 mm line-of-sight baseline error. The InSAR system ambiguity height was 32.73 m.
|
|
Table 1 System parameters of satellite and radar |
The flow of the simulation experiments is as follows. Simulation of formation satellite Echo Data, SAR imaging and InSAR processes were based on the Spaceborne Radar Advanced Simulator(SBRAS)(Wang et al., 2007; Chen et al., 2012). Three dimensional scattering echo simulation and modelling methods for natural scenes could also be used(Ulaby and Dobson, 1989; Franceschetti et al., 1992; Eineder, 2003).
Figures 5 and 6 show the three dimensional scene and unwrapped interferogram, respectively. Four simulation experiment results in different coherences are shown in Image 7. The plots show the theoretical prediction result for each indicator, prominent scatterer evaluation results, and VPS evaluation results.

|
Fig. 4 Simulation experiment for performance evaluation of InSAR |

|
Fig. 5 3D scene input |

|
Fig. 6 Unwrapped interferogram |
According to the InSAR system parameters and performance evaluation model from previous research(Zhang, 2011), the interferometric phase equivalent number of looks is 16. It could be seen from the evaluation results that PS was far from the theoretical value. Phase estimation accuracy and relative height accuracy were obviously high. And the variation of index with coherence is slow, which could not exactly reflect the relationship between coherence and height precisely. The improved method based on VPS effectively avoids the negative effects of the strong scattering characteristics. The four performance indicator calculation results agreed well with the theoretical curves analysed, illustrating the superiority of new method.
It is important to note that PS methods appeared to be much closer to the theoretical value in Fig. 7c, because the absolute height precision was different from the other three InSAR performance indicators, in which the main source of error was a baseline error of 10 mm in the line of sight. PS was also less affected by signal coherence. The simulation experiments failed to demonstrate significant differences in assessment methods. Three plots were very close to the indicator values in the graph; the other plots showed the subtle differences between the theoretical model and the simulation of randomness and could be disregarded.

|
Fig. 7 Performance evaluation results of InSAR in different coherences |
This paper discussed the performance evaluation of spaceborne InSAR based on prominent scatterers. The high signal to clutter ratio of prominent scatterers contributed to the precise calculation of SAR image position. The analysis also showed that the increased coherence along with high SCR caused the performance index to increase. We described a method of using VPS near real prominent scatterers as sample points. This improved method makes performance indicator calculations highly precise, highly efficient and highly stable. The results can be widely applied to land simulation tests, InSAR performance evaluation in orbit, outdoor calibration, error isolation, and troubleshooting or diagnosis.
ACKNOWLEDGMENTSThis work was supported by the National Natural Science Foundation of China (41271459, 61304231).
| [1] | Chen Q, Yu A X, Sun Z Y, et al. 2012. A multi-mode space-borne SAR simulator based on SBRAS.//2012 IEEE International Geoscience and Remote Sensing Symposium (IGARSS). Munich:IEEE, 4567-4570. |
| [2] | Eineder M. 2003. Efficient simulation of SAR interferograms of large areas and of rugged terrain[J]. IEEE Transactions on Geoscience and Remote Sensing, 41 (6): 1415–1427. |
| [3] | Farr T G, Hensley S, Rodriguez E, et al. 2000. The shuttle radar topography mission.//CEOS SAR Workshop. Paris:European Space Agency, 361-363. |
| [4] | Ferretti A, Prati C, Rocca F. 2001. Permanent scatterers in SAR interferometry[J]. IEEE Transactions on Geoscience and Remote Sensing, 39 (1): 8–20. |
| [5] | Franceschetti G, Migliaccio M, Riccio D, et al. 1992. SARAS:A synthetic aperture radar (SAR) raw signal simulator[J]. IEEE Transactions on Geoscience and Remote Sensing, 30 (1): 110–123. |
| [6] | López-Dekker P, Prats P, De Zan F, et al. 2011. TanDEM-X first DEM acquisition:A crossing orbit experiment[J]. IEEE Geoscience and Remote Sensing Letters, 8 (5): 943–947. |
| [7] | Lu X Q. 2006. Study on modeling and simulation of distributed spaceborne InSAR[Ph. D. thesis][M]. Changsha: National University of Defense Technology . |
| [8] | Rabus B, Eineder M, Roth A, et al. 2003. The shuttle radar topography missio-a new class of digital elevation models acquired by spaceborne radar[J]. ISPRS Journal of Photogrammetry and Remote Sensing, 57 (4): 241–262. |
| [9] | Roth A, Huber M, Kosmann D. 2005. Geocoding of TerraSAR-X data. DLR TerraSAR-X Tech. Report. |
| [10] | Schattler B, Kahle R, Metzig R, et al. 2011. The joint TerraSAR-X/TanDEM-X ground segment.//2011 IEEE International Geoscience and Remote Sensing Symposium (IGARSS). Vancouver, BC:IEEE, 2298-2301. |
| [11] | Schreier G. 1993. SAR Geocoding:Data and Systems[M]. Karlsruhe: Wichmann-Verlag . |
| [12] | Ulaby F T, Dobson M C. 1989. Handbook of Radar Scattering Statistics for Terrain[M]. Norwood: Artech House . |
| [13] | Wang M, Liang D N, Huang H F, et al. 2007. SBRAS:An advanced simulator of spaceborne radar.//2007 IEEE International Geoscience and Remote Sensing Symposium (IGARSS). Barcelona:IEEE, 4942-4944. |
| [14] | Wang Q S, Huang H F, Dong Z, et al. 2009. Fast simulation of InSAR ideal interferometric phase and precision analysis[J]. Journal of System Simulation (in Chinese), 21 (18): 5951–5954. |
| [15] | Wang Q S. 2011. Research on high-efficiency and high-precision processing techniques of spaceborne interferometric synthetic aperture radar[Ph. D. thesis][M]. Changsha: National University of Defense Technology . |
| [16] | Werner M. 2001. Shuttle radar topography mission (SRTM) mission overview[J]. Frequenz, 55 (3-4): 75–79. |
| [17] | Zhang Y J. 2011. Study on error analysis and DEM precision improvement methods of spaceborne distributed InSAR[Ph. D. thesis][M]. Changsha: National University of Defense Technology . |