 2016, Vol. 59

 , LIANG Feng2, LI Xiao-Ting3, ZHAO Jun-Meng1, 4, LIU Hong-Bing1, 4, WANG Xun1, JU Chang-Hui1
 2. MLR Key Laboratory of Metallogeny and Mineral Assessment, Institute of Mineral Resource, Chinese Academy of Geological Sciences, Beijing 100037, China;
3. State Key Laboratory of Coal Resource and Safe Mining, China University of Mining and Technology (Beijing), Beijing 100083, China;
4. CAS Center for Excellence in Tibetan Plateau Earth Sciences, Beijing 100101, China
The spectral decomposition method is based on the discrete Fourier transform, which uses the signal frequency-amplitude spectrum and other information to generate a high-resolution seismic image. Typically, it is used to identify the lateral distribution of medium properties, solve spectrum changes within complex media and local phase instability and other issues, such as locating faults and small-scale complex fractures. S-transform as a new time-frequency analysis method, which is a generalization of STFT developed by Stockwell in 1994, has the ability to automatically adjust the resolution. This method has been widely applied to exploration seismic, MT and other geophysical datasets in recent years. It has become one of the effective methods in noise suppressing during geophysical data processing. Comparing with conventional oil reflection seismic data, in order to probe deep structure, deep seismic reflection employs a large quantity of explosives, long observing systems, leading to a phenomenon that valid signals from the deep and noise are mixed together both in time domain and frequency domain. Considering these characteristics of deep reflection data, this paper combines spectral decomposition with S transform technology. First we design a simple pulse function experimental data to confirm the validity of the S transform method. Then we illustrate the effectiveness of spectral decomposition which is influenced by the choice of frequency analysis methods, especially the transform window function which determines the resolving power of the method. On this basis, S transform spectrum decomposition is applied to a single channel of deep reflection seismic data and the stacked profile, then the application results of traditional transform spectral decomposition and S transform spectral decomposition are compared.
Comparison of single channel data shows that compared with traditional spectral decomposition, the S transform spectral decomposition method is able to automatically adjust the resolution, accurately calibrate frequency component of weak signals at different times in deep reflection seismic data. Application to stacked profile data shows that the results obtained by the S transform spectral decomposition and those from other spectral decomposition method are largely consistent, while the results of S transform spectral decomposition clearly depict the characteristics of low-frequency details which are superimposed by noise in original stacked profile. At the same time, it improves the resolution and enhances the phase axis continuity on the stacked profile. Comparison also clearly indicates that the phase axis on the resultant profile obtained by Gabor transform spectral decomposition is more broken, which is caused by fixed-length window function used by Gabor transform decomposition, the length of the window function parameters can only be selected before the start of processing and is set to a certain value, while the S transform spectral decomposition method chooses the variable length of the window function according to signal change. It can automatically adjust the frequency characteristics of the signal by the local window length to better characterize the details of each frequency range. Such an effect is very obvious in deep reflection seismic imaging.
Our results show that the key of the spectral decomposition technique is to select the transform window function. The S transform spectral decomposition technology used in real deep reflection seismic data processing can effectively protect the weak low-frequency signals. It can effectively improve the signal to noise ratio and the resolution of weak reflection signals from the deep subsurface, while depicting the characteristics of low-frequency details on the stacked section and ultimately obtaining better imaging results.
The difference between conventional oil seismic reflection method and deep seismic reflection method is mainly manifested in the large quantity of explosives,observing systems, and their record lengths which cause lower coverage,low SNR (signal-to-noise ratio) and valid signals from the deep mixed together with noise (Yang,1986; Zhao et al., 1996; Gao et al., 2006) . How to extract weak valid signals from deep seismic reflection data of low SNR becomes an important issue in processing of deep seismic reflection data. Several theoretical and application works about protecting and extraction of weak valid signals have been done (Evans and Zucca, 1988;Coskun et al., 2007; Askari and Siahkoohi, 2008; Chen et al., 2009; Gandhi et al., 2012; Zhang et al., 2014;Liang et al., 2014 Qi et al., 2014; Liang et al., 2014; Di et al., 2014) .
The combination of spectrum decomposition technique and S-transform technology becomes an effective approach for processing deep seismic reflection data in complex media. As an effective method of time-frequency analysis (Mansinha et al., 1997; Gao et al., 2003; Pinnegar and Mansinha, 2003; Li et al., 2008;Leonowicz et al.,2009 ; Man and Gao, 2009; Parolai,2009) ,S-transform technology has a good multi-scale resolution both in time and frequency domains. The spectral decomposition method is based on Fourier transform,which gets frequency information from a seismic profile by time-frequency decomposition algorithm. The S-transform technology is very effective for distinguishing weak valid low-frequency signal from the deep during processing deep seismic reflection data (Bonar and Sacchi, 2013; Braga and Moraes, 2013; Cai et al., 2013; Chen et al., 2013a; Huang et al., 2013; Lu,2013; Han et al., 2014) .
This work combines S-transform technology with traditional spectral decomposition method as S-transform spectral decomposition method. It is applied to a single channel of deep reflection seismic data and the stacked profile. It is confirmed that S-transform spectrum decomposition technology has the ability to extract weak signals based on a large number of test results. Our research is aimed to study the S-transform spectrum decomposition technology and elaborates the reason for its good effect in weak signals extraction. S-transform spectrum decomposition seismic profile of Yuexi-Tanlu is also given in the paper.
2 THEORY AND METHOD 2.1 Spectral Decomposition TechnologyThe spectral decomposition method is based on Fourier transform,which acquires frequency information from the seismic profile by applying time-frequency decomposition algorithm. This method is based on the special spectrum response of thin-bed reflection in frequency domain (Mohebian et al., 2013; Sattari et al., 2013; Song et al., 2013; Tary et al., 2014) . The S-transform technology has a significant effect to extract weak signals. It can show minor events and anomalous points and can provide better resolution as compared with traditional seismic processing techniques (Tang and Yin, 2001; Chen et al., 2009) . The spectrum decomposition can offer quite high resolution provided the data has enough wide spectral range.
The key of the spectral decomposition technology is to select a transform window function which is connected with the spectrum response related to amplitude spectrum. In the signal processing,seismic record s (t) is regard as the synthesis of the deconvolution of source wavelet ω (t) and reflection coefficient series r (t) and noise n (t) ,s (t) = ω (t) x * r (t) + n (t) . The difference between traditional time-frequency analysis method and spectrum decomposition method is mainly manifested in the distinction of the inner function of signal window function. In traditional Fourier transform method,the window length does not change with the signal frequency, and it can only be selected at the start of processing and be set to a certain value. Fourier transform can depict the characteristics of signals in frequency domain,but cannot be applied directly in the spectrum decomposition without the ability to depict seismic signals in both time and frequency domain at the same time or to effectively analyze the characteristics of the details of valid signals.
Window function is introduced in Fourier transform to depict the characteristics of signals in time domain, leading to the window Fourier transforms. Short time Fourier transform (STFT) is frequently used in timedomain analysis which is the product of signal series and moving short time window function,such as Gabor transform (Baraniuk et al., 2001; Margrave et al., 2005; Ma and Margrave, 2008; Margrave et al., 2011;Chen et al., 2013b ) .
2.2 Theory of Gabor Transform and S-TransformA typical method of STFT is Gabor transform. In 1964,Gabor put forward a theory and method to use frequency and time to depict a time function at the same time which was the Gabor transform afterward. Continuous Gabor transform theory can be described as Eq. (1) .

As mentioned above,STFT uses a fixed-length window function. Once the window function is confirmed, the shape of the window is also fixed and the resolution of STFT is confirmed. If we want to change the resolution,we have to reselect the window function (Liao et al., 1990; Jiang et al., 2014) . The resolution of window function in time domain needs to be high if non-stationary seismic signals change dramatically and the resolution in frequency domain needs to be high if waveform changes more gently. As a new method of time-frequency analysis,S-transform technology (Stockwell,1999) is more applicable to time-frequency analysis of seismic signals compared with STFT.
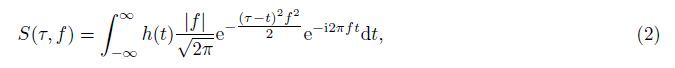
Stockwell et al. introduced S-transform technique to solve the contradiction of resolution in time and frequency domain to achieve a better partial time-frequency analysis in 1996. The formula of Stockwell's transformation can be deduced from the STFT formula. Stockwell et al. (Stockwell et al., 1996; Herman and Stockwell,2006; Letso and Stockwell, 2006; Rose et al., 2006; Stockwell,2006a; Stockwell,2006b; Stockwell,2006) deduced the equation and depicted the relation between S-transform and STFT theoretically. Continuous Stockwell's transform theory can be described as Eq. (2) .
Firstly,we design a set of theoretical data which select two typical wavelets in seismic reflection. First group is pulse function shown in Figs. 1 (a,b) . Fig. 1a represents Dirac δ function which is an unit impulse function and Fig. 1b shows the combination of two unit impulse functions which show two pulse events. The other group is seismic wave function shown in Fig. 1 (c,d) where Fig. 1c represents zero phase wavelet function which is usually acquired by correlation of scanning signals during processing real seismic reflection data and Fig. 1d shows combined function of two wavelet functions which have different amplitudes and polarities.

|
Fig.1 Experimental data (a) Spike 1; (b) Spike 2; (c) Wavelet 1; (d) Wavelet 2. |
Figure 2 shows the time-frequency spectrum of S-transform of data in Figs.1 (a-d) . Fig. 2 (a-d) correspond with (a) - (d) in Fig. 1. Transform spectrum amplitude was depicted by colors,in which red color means high timefrequency spectrum amplitude while blue means low amplitude. Fig. 2a shows wide frequency b and coverage of pulse function at 1 s and evenly distributed frequency b and energy which corresponds with infinite frequency b and of metaphysical pulse function. Fig. 2b shows the characteristic of two pulse signals and distinguishes occurrence times of two pulses,at 0.9 s and 1.1 s respectively. Fig. 2c shows a spectral energy trap which represents the whole signal in Fig. 1c. The red color occurs near 1 s which represents highest amplitude of signal energy that has a frequency b and from 20 to 70 Hz. It corresponds with the experimental data. Fig. 2d shows spectral energy traps near 0.9 s and 1.1 s which indicate two largest partial amplitudes or energies respectively. It is found in Fig. 2d that two different colors show two different amplitudes of signals energy which corresponds with signals shown in Fig. 1d.

|
Fig.2 S-transform spectrum of experimental data (a) S-transform spectrum of spike 1; (b) S-transform spectrum of spike 2; (c) S-transform spectrum of wavelet 1; (d) S-transform spectrum of wavelet 2. |
It's worth noting that time-frequency analysis is different from Fourier transform. Fourier transform is an integration of the signals in the whole time domain and the spectrum amplitude is the group effect of the frequency of signals without the ability to analyze signals partially. As a method of time-frequency analysis, S-transform is a combination of information in time and frequency domain to analyze the changes in frequency with time and it is better for non-stationary signals compared with Fourier transform.
3.2 Comparison of Single Channel Data and Time-Frequency Analysis MethodsThis study extracts low-frequency single channel data of deep seismic reflection using Gabor transform and S-transform for time-frequency analysis to illustrate the particular characteristics of time-frequency recognition of signals. The results show distinction of different time-frequency analysis methods to extract weak signals. Specifically we select a channel from 12 s to 13 s of deep seismic reflection data shown in Fig. 3a and compare the Gabor transform and S-transform of the chosen data.

|
Fig.3 Gabor and S-transform of seismic data (a) Seismic trace; (b) Gabor transform spectrum of seismic data; (c) S-transform spectrum of seismic data. |
From the seismic record shown in Fig. 3a,it's found that seismic waveform changes with time and strong amplitude appears near 12.2 s. Comparing the time-frequency spectrum amplitude of Gabor transform and Stransform shown in Fig. 3 (b,c) ,we can find that these two methods both describe the characteristics of signals in time domain and it's clear that the frequency changes with time. Seismic anomaly is apparently observed on the map of spectrum and it corresponds with the transform result of seismic data,meanwhile 3 extrema of spectrum at 12.3 s,12.6 s and 12.8 s correspond to the frequency from 15 to 28 Hz. Fig. 3b shows the resolution of the two methods,indicating that the resolution of Gabor transform is low in the whole time series but Stransform has a good resolution in the frequency b and corresponding with the whole time series. The comparison indicates that S-transform has a better ability to focus the time-frequency spectrum and depicts the signals more subtly than Gabor transform.
Comparing Fig. 3b with Fig. 3c,the defect of Gabor transform in the analysis of deep low-frequency seismic reflection data is resulted from the fixed-length window function. The resolutions both in time and frequency domain depend on the window function parameters of Gabor transform but the resolution cannot be changed according to the frequency of signals to be analyzed. In the time-frequency analysis of seismic data, the resolution in frequency domain should be high for the low-frequency signals and the resolution in time domain should be high for the high-frequency signals which requires the window function parameters to have the ability to automatically adjust the width of window and frequency b and . STFT,represented by Gabor transform cannot meet the dem and of time-frequency analysis of seismic signals very well. S-transform has good resolution in both time and frequency domain which illustrates the ability of multi-scale resolution. The nature of S-transform is to select long window function to get high resolution in frequency domain when the frequency is low and short window function to get high resolution in time domain when the frequency is high. S-transform could precisely demarcate the spectrum of weak deep seismic reflection data at various times. It not only has the ability of localization analysis in both time and frequency domain but also has the ability to automatically adjust the resolution. S-transform has a stronger ability of time-frequency analysis than Gabor transform and is suitable for the spectrum decomposition of deep seismic reflection data.
3.3 Deep Seismic Stacked Profile and ApplicationIn order to verify the validity of the method used in this paper,seismic data observed along a line in the middle-lower area of Yangtze River by Chinese Academy of Geological Sciences is chosen to process as follows: firstly,select a typical channel of seismic data,compare different spectrum decomposition methods and confirm the suitable spectrum decomposition method and its parameters. Secondly,acquire 2-dimensional time-frequency distribution of stacked profile by analyzing the frequency spectrum and gathers of all seismic data and extract time-frequency profile corresponding with the spectrum range of seismic data.
large explosions,CDP (common depth points) ranges from 500 to 1100 m, and sampling rate of 2 ms. The time is from 13 to 15 s.Lü et al. applied special imaging processing methods for deep seismic reflection data observed near Yangtze River,such as residual static correction and refined velocity gain in order to get the image of refined deep structure (Lü et al., 2014) . Fig. 4a shows the reflection events at 13~13.5 s along time axis and 39~40.5 km in depth which are hard to be found by regular processing methods. The middle part of time Section A shows apparent deep seismic reflection events as highly reflective densely layered continuous reflection. The weak reflection events in Section B result from: firstly,the coinciding of valid low-frequency signals b and and low-frequency noise b and in deep seismic reflection data. The phase axis continuity is weak in Section B and it's hard to distinguish on the stacked profile. Secondly,unlike conventional oil seismic reflection whose r and om noise is distributed in high frequency band ,the random noise of deep seismic reflection contains low-frequency signals. Thirdly,the energies of low-frequency and high-frequency valid signals are weak. To gain low-frequency valid signals from the deep,we apply Gabor transform and S-transform spectrum decomposition method to process the signals from different time,depth, and frequency b and s and apply different parameters to get different time-frequency spectrum decomposition profiles.

|
(a) Seismic stack profile; (b) Gabor transform spectrum decomposition; (c) S-transform spectrum profile. Fig.4 Yuexi-Tanlu deep seismic stack profile with S-transform and Gabor transform spectrum decomposition |
Figure 4b shows the time-frequency spectrum profile of Gabor transform. The comparison of Section A and B with Fig. 4a indicates that the reflection phase axis is more obvious at both ends in Section A but the phase axis continuity in the middle part is weaker than that of Fig. 4a. We can find that the reflection of both ends in section A of Fig. 4b and reflection in the middle part of Fig. 4a shows the same event from the time-frequency spectrum decomposition profile of Gabor transform. The comparison in Section B indicates that the reflection event hard to distinguish in Fig. 4a shows strong reflection phase axis so that it can be confirmed as reflection event in Section B. Comprehensive comparison of Section A and B of Fig. 4a and Fig. 4b indicates that the SNR of weak deep seismic reflection data is improved and partial low-frequency noise is suppressed on the time-frequency spectrum profile of Gabor transform. Meanwhile,Gabor transform spectrum decomposition improves the imaging resolution of deep valid signals but reflection phase axis continuity is broken because of the fixed-length window function in Gabor transform.
Figure 4c shows the time-frequency spectrum profile of S-transform. Firstly comparing with Fig. 4b we can find that the weak reflection of densely layered continuous reflection at both ends is strengthened,phase axis continuity of both sides is improved and the details of reflection events in the middle part of Section A are depicted apparently. Secondly,the imaging quality of section B which shows strong reflection phase axis in Fig. 4b is further improved in Fig. 4c and it's more obvious to compare the phase axis continuity of Section B totally.
Comprehensive comparison of imaging results in Fig. 4 (a,b,c) shows that S-transform is more suitable for deep spectrum decomposition profile imaging. Although the spectrum decomposition based on Gabor transform can strengthen the weak reflection signals but has a poor effect on phase axis continuity of reflection events than S-transform because of the fixed-length window function of Gabor transform in which the window length does not change with the signal frequency and the window function parameters can only be selected from the start of processing and is set to a certain value. S-transform spectrum decomposition method chooses the variable length of window function according to signal change. It can automatically adjust the frequency characteristics of the signal by the local window length to better characterize the details of each frequency range. Such an effect is very obvious in deep reflection seismic imaging.
4 CONCLUSION AND PROSPECTThe research is based on the time-frequency spectrum decomposition method and we have designed experimental data to verify the validity of this method. We compare and analyze the application results of spectrum decomposition by Gabor transform and S-transform for single channel deep seismic reflection data and stacked profile and get some conclusions as follows.
Firstly,the kernel of spectrum decomposition technique is the window length. S-transform is better at extracting valid low-frequency signals of deep seismic reflection data as compared with STFT represented by Gabor transform. S-transform can demarcate spectrum amplitude of weak deep seismic reflection signals at different times and has the ability to automatically adjust the resolution. It's suitable to be the spectrum decomposition method for deep seismic reflection data.
Secondly,application of S-transform spectrum decomposition method on deep seismic stacked profile can improve the SNR of deep seismic reflection signals and the resolution effectively. It can depict the characteristics of low-frequency details which cannot be found on stacked section. S-transform spectrum decomposition technique is an ideal tool during the processing of weak deep seismic reflection signals.
This paper focuses on the application of spectrum decomposition technique on deep seismic reflection data and the spectrum decomposition profile needs further study. Deeper understanding of tectonic evolution and dynamic processing will be interpreted if we combine the regional geology and geophysical data in the area where seismic line covers.
5 ACKNOWLEDGMENTSWe would like to thank Professor Lü Qingtian for valuable advice on the research. Some figures were produced using Seismic Unix software. We would like to thank the two anonymous reviewers for their careful reading and valuable comments on the manuscript. This work was supported by the National Natural Science Foundation of China (40930418) .
| [1] | Askari R, Siahkoohi H R. 2008. Ground roll attenuation using the S and x-f-k transforms. Geophysical Prospecting, 56(1): 105-114. |
| [2] | Baraniuk R G, Coates M, Steeghs P. 2001. Hybrid linear/quadratic time-frequency attributes. IEEE Transactions on Signal Processing, 49(4): 760-766. |
| [3] | Bonar D, Sacchi M. 2013. Spectral decomposition with f-x-y preconditioning. Geophysical Prospecting, 61(S1): 152-165. |
| [4] | Braga I L S, Moraes F S. 2013. High-resolution gathers by inverse Q filtering in the wavelet domain. Geophysics, 78(2): V53-V61. |
| [5] | Cai H P, He Z H, Gao G, et al. 2013. Seismic data matching pursuit using hybrid optimization algorithm and its application. Journal of Central South University (Science and Technology) (in Chinese), 44(2): 687-694. |
| [6] | Chen X H, He Z H, Huang D J, et al. 2009. Low frequency shadow detection of gas reservoirs in time-frequency domain. Chinese J. Geophys. (in Chinese), 52(1): 215-221. |
| [7] | Chen X H, He Z H, Pei X G, et al. 2013a. Numerical simulation of frequency-dependent seismic response and gas reservoir delineation in turbidites: A case study from China. Journal of Applied Geophysics, 94: 22-30. |
| [8] | Chen Y P, Peng Z M, He Z H, et al. 2013b. The optimal fractional Gabor transform based on the adaptive window function and its application. Applied Geophysics, 10(3): 305-313. |
| [9] | Coşkun E, Özder S, Kocahan Ö, et al. 2007. The determination of birefringence dispersion in nematic liquid crystals by using the S-transform.//Cetin S A, Hikmet I. Six International Conference of the Balkan Physical Union. Istanbul, Turkey, 899: 439-440. |
| [10] | Di C L, Yang X H, Wang X C. 2014. A four-stage hybrid model for hydrological time series forecasting. Plos One, 9(8): e104663. |
| [11] | Evans J R, Zucca J J. 1988. Active high-resolution seismic tomography of compressional wave velocity and attenuation structure at Medicine Lake Volcano, Northern California cascade range. Journal of Geophysical Research-Solid Earth, 93(B12): 15016-15036. |
| [12] | Gandhi T, Panigrahi B K, Santhosh J, et al. 2012. Contribution of brain waves for visual differences in animate and inanimate objects in human brain. Journal of Computational and Theoretical Nanoscience, 9(2): 233-242. |
| [13] | Gao J H, Chen W C, Li Y M, et al. 2003. Generalized S transform and seismic response analysis of thin interbeds. Chinese J. Geophys. (in Chinese), 46(4): 526-532. |
| [14] | Gao R, Wang H Y, Ma Y S, et al. 2006. Tectonic relationships between the Zoigê basin of the Song-pan block and the west Qinling orogen at lithosphere scale: results of deep seismic reflection profiling. Acta Geoscientica Sinica (in Chinese), 27(5): 411-418. |
| [15] | Han L, Sacchi M D, Han L G. 2014. Spectral decomposition and de-noising via time-frequency and space-wavenumber reassignment. Geophysical Prospecting, 62(2): 244-257. |
| [16] | Herman A G, Stockwell B R. 2006. Enzyme annotation with chemical tools. Chemistry & Biology, 13(10): 1013-1014. |
| [17] | Huang Y, Xu D, Wen X K. 2013. Optimization of wavelets in multi-wavelet decomposition and reconstruction method.Geophysical Prospecting for Petroleum (in Chinese), 52(1): 17-22. |
| [18] | Jiang G M, Zhang G B, Lü Q T, et al. 2014. Deep geodynamics of mineralization beneath the Middle-Lower Reaches of Yangtze River: Evidence from teleseismic tomography. Acta Petrologica Sinica (in Chinese), 30(4): 907-917. |
| [19] | Jiang T, Xu X C, Jia H Q, et al. 2014. Study on deep seismic reflection profile in Xingcheng area of the western Liaoning Province. Chinese J. Geophys. (in Chinese), 57(9): 2833-2845, doi:10.6038/cjg20140910. |
| [20] | Jing J E, Wei W B, Chen H Y, et al. 2012. Magnetotelluric sounding data processing based on generalized S transformation. Chinese J. Geophys. (in Chinese), 55(12): 4015-4022, doi:10.6038/j.issn.0001-5733.2012.12.013. |
| [21] | Leonowicz Z, Lobos T, Wozniak K. 2009. Analysis of non-stationary electric signals using the S-transform. Compel-the International Journal for Computation and Mathematics in Electrical and Electronic Engineering, 28(1): 204-210. |
| [22] | Leonowicz Z, Lobos T, Wozniak K. 2009. Analysis of non-stationary electric signals using the S-transform. Compel-the International Journal for Computation and Mathematics in Electrical and Electronic Engineering, 28(1): 204-210. |
| [23] | Letso R R, Stockwell B R. 2006. Chemical biology: Renewing embryonic stem cells. Nature, 444(7120): 692-693. |
| [24] | Li M, Gu X K, Shan P W. 2008. Time-frequency distribution of encountered waves using Hilbert-Huang transform. International Journal of Mechanics, 2(1): 27-32. |
| [25] | Li S J, Shi X J, Zheng H M, et al. 2002. The consistent correction of seismic amplitude in complicated surface area. Chinese J. Geophys. (in Chinese), 45(6): 862-869. |
| [26] | Liang F, Lü Q T, Yan J Y, et al. 2014. Deep structure of Ningwu volcanic basin in the Middle and Lower Reaches of Yangtze River: Insights from reflection seismic data. Acta Petrologica Sinica (in Chinese), 30(4): 941-956. |
| [27] | Liao X H, Yan P F, Chang T. 1990. Automatic faults recognition using spetrum decomposition. Acta Geophysica Sinica (in Chinese), 33(2): 220-226. |
| [28] | Lü Q T, Liu Z D, Tang J T, et al. 2014. Upper crustal structure and deformation of Lu Zong ore district: Constraints from integrated geophysical data. Acta Geologica Sinica (in Chinese), 88(4): 447-465. |
| [29] | Lu W K. 2013. An accelerated sparse time-invariant Radon transform in the mixed frequency-time domain based on iterative 2D model shrinkage. Geophysics, 78(4): V147-V155. |
| [30] | Lu W K. 2013. An accelerated sparse time-invariant Radon transform in the mixed frequency-time domain based on iterative 2D model shrinkage. Geophysics, 78(4): V147-V155. |
| [31] | Ma Y W, Margravel G F. 2008. Seismic depth imaging with the Gabor transform. Geophysics, 73(3): S91-S97. |
| [32] | Man W S, Gao J H. 2009. Statistical denoising of signals in the S-transform domain. Computers & Geosciences, 35(6): 1079-1086. |
| [33] | Mansinha L, Stockwell R G, Lowe R P, et al. 1997. Local S-spectrum analysis of 1-D and 2-D data. Physics of the Earth and Planetary Interiors, 103(3-4): 329-336. |
| [34] | Margrave G F, Gibson P C, Grossman J P, et al. 2005. The Gabor transform, pseudodifferential operators, and seismic deconvolution. Integrated Computer Aided Engineering, 12(1): 43-55. |
| [35] | Margrave G F, Lamoureux M P, Henley D C. 2011. Gabor deconvolution: Estimating reflectivity by nonstationary deconvolution of seismic data. Geophysics, 76(3): W15-W30. |
| [36] | Mohebian R, Yari M, Riahi M A, et al. 2013. Channel detection using instantaneous spectral attributes in one of the SW Iran oil fields. Bollettino Di Geofisica Teorica Ed Applicata, 54(3): 271-282. |
| [37] | Parolai S. 2009. Denoising of seismograms using the S transform. Bulletin of the Seismological Society of America, 99(1): 226-234. |
| [38] | Pinnegar C R, Mansinha L. 2003. The S-transform with windows of arbitrary and varying shape. Geophysics, 68(1): 381-385. |
| [39] | Reine C, van der Baan M, Clark R. 2009. The robustness of seismic attenuation measurements using fixed-and variablewindow time-frequency transforms. Geophysics, 74(2): WA123-WA135. |
| [40] | Qi G, Lü Q T, Yan J Y, et al. 2014. 3D geological modeling of Luzong ore district based on priori information constrained. Acta Geologica Sinica (in Chinese), 88(4): 466-477. |
| [41] | Rose S, Jackson M J, Smith L A, et al. 2006. The novel adenosine A2a receptor antagonist ST1535 potentiates the effects of a threshold dose of L-DOPA in MPTP treated common marmosets. European Journal of Pharmacology, 546(1-3): 82-87. |
| [42] | Saravanan N, Siddabattuni V N S K, Ramachandran K I. 2008. A comparative study on classification of features by SVM and PSVM extracted using Morlet wavelet for fault diagnosis of spur bevel gear box. Expert Systems with Applications, 35(3): 1351-1366. |
| [43] | Sattari H, Gholami A, Siahkoohi H R. 2013. Seismic data analysis by adaptive sparse time-frequency decomposition. Geophysics, 78(5): V207-V217. |
| [44] | Song W, Zou S F, Ouyang Y L, et al. 2013. Three parameter time-frequency characteristics filter based on fast matching pursuit. Oil Geophysical Prospecting (in Chinese), 48(4): 519-525. |
| [45] | Stockwell D M. 2006b. PETR 73-Intra-particle mass transfer and contact time effects in FCC. Abstracts of Papers of the American Chemical Society, 232. |
| [46] | Stockwell J W Jr. 1999. The CWP/SU: Seismic Un*x package. Computers & Geosciences, 25(4): 415-419. |
| [47] | Stockwell P J, Wessell N, Reed D R, et al. 2006. A field evaluation of four larval mosquito control methods in urban catch basins. Journal of the American Mosquito Control Association, 22(4): 666-671. |
| [48] | Stockwell P J, Wessell N, Reed D R, et al. 2006. A field evaluation of four larval mosquito control methods in urban catch basins. Journal of the American Mosquito Control Association, 22(4): 666-671. |
| [49] | Stockwell R G, Mansinha L, Lowe R P. 1996. Localization of the complex spectrum: The S transform. IEEE Transactions on Signal Processing, 44(4): 998-1001. |
| [50] | Suvichakorn A, Ratiney H, Bucur A, et al. 2008. Morlet wavelet analysis of magnetic resonance spectroscopic signals with macromolecular contamination.//2008 IEEE International Workshop on Imaging Systems and Techniques. Crete: IEEE, 321-325. |
| [51] | Tang B, Yin C. 2001. Non-minimum phase seismic wavelet reconstruction based on higher order statistics. Chinese Journal of Geophysics (in Chinese), 44(3): 404-410. |
| [52] | Tao L, Gu J J, Zhuang Z Q. 2002. Two-layer parallel lattice structures of time-recursive algorithms for 2D real-valued discrete Gabor transforms.//Electronic Imaging and Multimedia Technology III. Shanghai, China: SPIE, 4925: 280-289. |
| [53] | Tary J B, Herrera R H, Han J J, et al. 2014. Spectral estimation-What is new? What is next?. Reviews of Geophysics, 52(4): 723-749. |
| [54] | Todorovska M I, Trifunac M D. 2007. Earthquake damage detection in the Imperial County Services Building-I: The data and time-frequency analysis. Soil Dynamics and Earthquake Engineering, 27(6): 564-576. |
| [55] | Xu Y Q, Sun M, Guo M S. 2007. Morlet Wavelet chaotic neural networks with random noise. Dynamics of Continuous Discrete and Impulsive Systems-Series B-Applications & Algorithms, 14: 661-666. |
| [56] | Zhang Z, Yin X Y, Hao Q Y. 2014. Frequency-dependent fluid identification method based on avo inversion. Chinese Journal of Geophysics (in Chinese), 57(12): 4171-4184, doi:10.6038/cjg20141228. |
| [57] | Zhao W J, Nelson K D, Che J K, et al. 1996. Deep seismic reflection in himalaya reqion reveals the complexity of the crust and upper mantle structure. Acta Geophysica Sinica (in Chinese), 39(5): 615-628. |
| [58] | Yang W C. 1986. A generalized inversion technique for potential field data processing. Acta Geophysica Sinica (in Chinese), 29(3): 283-291. |
| [59] | Stockwell D M. 2006a. PETR 41-FCC regenerator simulation by Lambda Sweep testing. Abstracts of Papers of the American Chemical Society, 232. |