 2015, Vol. 58


2. State Key Laboratory of Marine Geology, Tongji University, Shanghai 200092, China;
3. Key Laboratory of Computational Geodynamics, Chinese Academy of Science, Beijing 100049, China
Taiwan is located on the convergent boundary of the Eurasian and Philippine Sea plates(Fig. 1). It is aproduct of collision between the Luzon arc and the Chinese continental margin(Ho, 1986; Teng, 1987, 1990, 1996; Huang et al., 2006). The ongoing collision started at least 8 Ma ago(Ho, 1988; Teng, 1990; Kao et al., 1998; Lallem et al., 2001;and Bos et al., 2003). The tectonic setting around Taiwan is very complex: Plateconvergence is accommodated to the northeast of Taiwan by northwestward subduction of the Philippine Seaplate beneath the Eurasian plate along the Ryukyu trench. In contrast, directly south of Taiwan, the Eurasianplate subducts southeastward beneath the Philippine Sea plate along the Manila trench(Wu, 1978; Tsai, 1986;Pezzopane and Wesnousky, 1989). Taiwan is included in a modern trench-arc-basin system and is a rare area inthe world where arc-continent collision is ongoing. Therefore, the Taiwan orogen is a unique natural laboratoryfor studying collision processes(Kao and Chen, 2000; Chiang et al., 2008). Due to the ongoing plate subduction and collision, there are plenty of destructive earthquakes recorded in Taiwan(Bonilla, 1975, 1977; Hsu, 1980; Chi et al., 1981; Chen and Tsai, 2008)such as the 1994 Mw 6.8 Taiwan Strait earthquake, the 1999 Mw 7.6 Chi-Chiearthquake; the 2006 Mw 7.0 Pingtung earthquake(Kao and Wu, 1996; Chang et al., 2000; Wu et al., 2009; Sun et al., 2011). Fig. 2 shows the epicenter distribution in and around Taiwan from 1900-01-01 to 2014-12-31, withmagnitude from 5 to 8 and focal depths less than 40 km(http://earthquake.usgs.gov/earthquakes/search/, lastvisit on Jan. 1, 2015). From this point of view, to investigate the crustal deformation, active faults and their sliding rate and dynamic mechanisms in Taiwan will provide evidence for studying earthquake mechanisms and analyzing seismic risks.

|
Fig. 1 Geological setting in and around Taiwan |

|
Fig. 2 Epicenter distribution in and around Taiwan from 1900 to 2014 (5 ≤ M ≤ 8, with focal depth less than 40 km) and the GPS horizontal velocity field in Taiwan from 1995 to 2005 with respect to station S01R (black solid triangle) in the continental margin of the Penghu Island at the Taiwan Strait. Capital letters (A-E) denote major active structures in Taiwan: deformation front, Chelungpu fault, Chihtsu fault, Lishan fault, and Longitudinal Valley fault |
The GPS system in Taiwan was established in the 1980s which cumulated large number of observation dataabout crustal movement that made it possible to study the crustal deformation in and around the isl and . Yuet al.(1997)calculated the crustal velocity field of Taiwan between 1990 and 1995 using the GPS observationdata. Utilizing these GPS observation results, many researchers studied the deformation field of the Taiwanregion. For example, He et al.(2002)studied the crustal deformation of southern Taiwan and concluded that inthe process of Philippine Sea Plate moving towards the Eurasian plate, about a half of the rate is concentratedon the Longitudinal Valley Fault. In the western Central Range zone, the motion of the blocks accords with theobserved fan-shape distribution of the maximum principal stress. Bos et al.(2003)determined the present-daysurface deformation of Taiwan by computing the velocity gradient field and fault slip from 143 GPS velocityvectors. Hao et al.(2009)obtained the strain rate field and the rotation rates of blocks in Taiwan by GPSvelocity field inversion. Lin et al.(2010)computed the crustal strain field of Taiwan by use of the continuousGPS data from 2003 to 2005. Zhu et al.(2011)calculated the strain rates in Taiwan before and after the 1999Mw 7.6 Chi-Chi earthquake in the periods of 1990–1995 and 2003–2005 based on the corresponding GPS data and obtained the characteristics of the strain rate field. Ching et al.(2011)characterized the kinematics ofmodern crustal deformation in Taiwan and evaluate the potential for large earthquakes by computing tectonicblock motions and fault slip rates from 531 GPS horizontal velocities in the period of 1990–1995.
In order to quantitatively study the mechanisms of the crustal deformation in Taiwan, Huchon et al.(1986)used a finite element technique to compute the stress and strain induced by the push of the plate and explained the general pattern of the stress trajectories. Hu et al.(1996, 1997, 2001)modeled the influencesof typical tectonic settings on the strain field of southern Taiwan and velocity field of the whole isl and . Theypresented the velocity field and the main controlling factors, and studied the relationship of compression, strain and stress distribution in the Taiwan region. In spite of that many predecessors have studied the deformationfield of Taiwan and presented plenty of reasonable results, it is meaningful to further quantitatively study the characteristics of the strain field by using updated and more comprehensive GPS data and taking more factorslike decoupling of faults into account. In this work, wecalculate the strain rate field in and around Taiwan byusing finite element method(FEM), utilizing GPS datafrom 1995 to 2005. The heterogeneity of the medium, slippage of the faults and some other factors are takeninto consideration to quantitatively study the interseismicdeformation in Taiwan, trying to find out the dominantfactors that control the deformation field.
2 GEOLOGICAL SETTINGThe Taiwan mountain belt and its associated highseismicity result from the oblique convergence betweenthe Philippine Sea and Eurasian plates at a rate ofabout 81.5 mm/yr(Suppe, 1984; Yu et al., 1997, 1999).The features of both the crustal velocity structure and earthquake hypocenter distribution are related to twoactive subduction systems, Ryukyu trench-arc systemto the east and Luzon trench-arc system to the southof Taiwan(Hsu, 1990; Rau and Wu, 1995; Ching et al., 2011)(Fig. 1). In the Ryukyu trench-arc system, the Philippine Sea plate subducts northward beneaththe Eurasian plate along the Ryukyu trench east ofTaiwan. On the contrary, in the Luzon trench-arc system, the Philippine Sea plate overrides westward ofthe South China Sea of the Eurasian plate along theManila trench south of Taiwan(Wu, 1978; Tsai, 1986;Pezzopane and Wesnousky, 1989; Ching et al., 2011).The Ryukyu trench-arc system extends from southern Kyushu to the east of Taiwan, where it trends in E-W at 23°N–24°N east of Hualien and is associated withthe back-arc spreading of the Okinawa trough, which ends to the west in the Ilan plain of northeastern Taiwan(Ho, 1986; Tsai, 1986; Hu et al., 1996). The Luzon trench-arc system extends from the Philippines to nearKaohsiung of southwestern Taiwan, where it merges into the mountain ranges of Taiwan(Hu et al., 1996). TheLongitudinal Valley Fault(LVF)zone between the Ryukyu arc and Luzon arc is generally considered as thesuture zone of the ongoing collision between the Luzon arc and Eurasian plate and the main active tectonicbelt(Biq, 1972; Hsu, 1976; Wu, 1978; Barrier and Angelier, 1986; Ho, 1986; Angelier et al., 2000; Lee et al., 2001). The Longitudinal Valley Fault is a left-lateral reverse fault, on which the ratio between the strike-slip and transverse components of active motion is 1:3(Yu and Liu, 1989; Lee and Angelier, 1993a). It absorbsabout 40% of the total horizontal shortening due to Eurasia-Philippine Sea plate convergence in the Taiwanregion so that the relative movement between Coast Range and Central Range reaches 28~31 mm/yr(Yu and Chen, 1994).
The presence of two major basement highs located west of Taiwan appears to be crucially important forthe fault development during mountain building(Fig. 3).They represent the shallow pre-Cretaceous Chinesecontinental basement and are characterized by tectonic stability(Bos et al., 2003). These basement highsrepresent in situ tectonic “backstops” against adjacent mobile belts from moving westward so that the materialsbetween Manila subduction and Peikang High were forced to move southwestward(Lu and Malavieille, 1994; Lu et al., 1998; Lin and Watts, 2002). The interaction between the presence of those two basement highs and the northwestward convergence of the Philippine Sea plate results in an elongate S-shaped and NW-directedgeneral structural trends of the Taiwan mountain belt(Biq, 1972; Lu and Malavieille, 1994; Lu et al., 1998;Chang et al., 2003; Ching et al., 2011).

|
Fig. 3 Map showing finite element structure I (bold black line) is a fault group, in which LVF and north margin of the Luzon arc are included. 1–13 are fault models implied in simulation: 1 Meinung fault; 2 LVF; 3 North margin of the Luzon arc; 4 Lishan fault; 5 Chaochou-Chishan fault; 6 Hengchun fault; 7 Chuchih fault; 8 Youchang fault; 9 Cuochen fault; 10 Choukou fault; 11 Chelungpu fault; 12 Faults at Northern Taiwan; 13 Deformation Front. The study area is divided into several subregions by those faults above, see Fig. 4a. Large open arrow indicates the direction of plate convergence of Philippine Sea plate relative to Eurasia, the number inside it is the convergence rate. Blue solid arrows denote extrusion and tectonic escape to Ilan Plain and Pingtung Plain areas (Angelier et al., 2009). |
As a result of the regional NW-directed tectonic contraction, Taiwan is generally divided into severalNNE-trending geologic provinces, separated by several major faults. These provinces from west to east aregeologically named the Penghu Isl and s, the Western Coastal Plain, the Western Foothills, the HsuehshanRange, the Centra Range, the LVF zone, and the Coast Range(Ho, 1986; Yu et al., 1997)(Fig. 3). The LVFseparates the Coast Range and Centra Range, the Chaochou-Chishan fault is the boundary between CentraRange and Western Coastal Plain, the Lishan fault is the boundary between Centra Range and HsxuehshanRange and the Deformation Front separates the Coastal Plain and Western Foothills(Bos et al., 2003)(Fig. 3).
The Penghu Isl and s in the Taiwan Strait is covered with Pleistocene flood basalt. The Coastal Plainconsists of Quaternary alluvial deposits derived from theWestern Foothills and the Central Range. TheWesternFoothills are composed of a thick sequence of shallow marine to shelf sediments from the Late Oligocene, Mioceneto Early Pleistocene. These sediments are deformed by a combination of folds and thrust faults. The HseuhshanRange is mostly composed of the green schist facies metamorphosed Eocene and Oligocene continental marginmarine sediments. The Central Range is divided into two parts. The axial ridges and the western flank areunderlain by a weakly metamorphosed Cenozoic argillite-slate series, while the eastern flank is composed ofthe pre-Tertiary basement complex which has been affected by Neogene greenschist facies and higher grades ofpolyphase Mesozoic-Cenozoic metamorphism. The LVF is a main shear deformation zone filled by Quaternaryclastic fluvial sediments. The Coast Range and the two offshore islets, Lutao and Lanhsu, are the northernextension of the Neogene Luzon trough. They are mainly composed of Neogene and esitic volcanic rocks(Yu et al., 1997; Hsu et al., 2009; Ching et al., 2011).
In northern Taiwan, a subduction polarity reversal takes place as the Philippine Sea Plate switches froman overriding plate above the eastward subducting Eurasian plate to a northward subducting plate under theRyukyu arc in the Eurasian plate. Therefore northern Taiwan is no longer a collisional boundary and is nowmoving into the regime of the Ryukyu subduction zone(Suppe, 1984; Teng, 1996; Clift et al., 2003; Rau et al., 2008; Ching et al., 2011). Between the Hseuhshan Range and the Central Range in northeastern Taiwan, thetriangular Ilan Plain is considered as the western extremity of the Okinawa trough(Ho, 1986; Tsai, 1986; Hu et al., 1996). Because of the opening of the Okinawa trough, the Ilan plain is in a state of extension so thatmany normal fault earthquakes took place there(Tsai, 1986).
The Pingtung Plain is elongated N-S and bounded by the high mountains of the Centra Range to theEast, the Western Foothills to the west and north, and the Manila accretionary prism to the south, respectively(Angelier et al., 2009). Southern Taiwan is dominated by the onshore extension of the Manila accretionarywedge, representing a weak zone related to the northern part of the Manila subduction system. To the northof this region, the accretionary wedge is terminated by the Chishan fault to the north and deformation frontto the west. Generally, all deformation related to the convergence of the Philippine Sea and Eurasia plates isconsidered to be accommodated east of the deformation front(Bos et al., 2003).
3 FINITE ELEMENT MODELIn order to quantitatively explore the characteristics of crustal deformation in Taiwan and to investigate theinfluences of the factors such as faults on the deformation field, we calculate the strain rate field by using finiteelement method. To better identify the main factors controlling the velocity field and present the prominentcharacteristics, according to Zhu and Shi(2005, 2007) and Zhu and Shi(2006), we choose a plane at 5km depth as the research plane and establish a 2-D finite element model. Based on the geological setting ofTaiwan(Fig. 1), the study area in this paper is between 21.8°N–25.5°N and 119.5°E–122.3°E, which containsthe whole Taiwan isl and . Considering the complex geological structures and numerous faults, we consider the influence of mechanical discontinuities which consist ofactive faults. Based on the fault geometries and theresults of previous work(e.g., Ho, 1986; Zhen, 1995;Hu et al., 2001; He et al., 2002; Bos et al., 2003; Ching et al., 2007; Hao et al., 2009), we use straight lines orsimple curves to approximate the faults in simulation.Fig. 3 and Fig. 4a show major faults used in this study and the distribution of subregions in the finite model.

|
Fig. 4 (a) Subregions of the finite element model. Subregions 19–21 represent the weak zone of LVF. Other subregions are divided by faults and Taiwan Island’s outlines. (b) Model geometry, boundary conditions and finite element mesh. The model is freely meshed and the length of the elements is less than 2 km. The solid triangles on boundaries indicate fixed boundary conditions, the open arrows show the displacement boundary conditions. The displacement on southeast boundaries DE and EF is 81.5 mm/yr with azimuth 306° |
As shown in Fig. 3, we establish the model and divide it into 25 subregions by faults and the outline ofthe isl and . Among the subregions, blocks from No.19to 21 represent the LVF zone which are different fromadjacent regions in materials. As mentioned above, theLVF plays an important role in the formation of Taiwan, but its geometry is not clear yet. Lee et al.(2003) and Huanget al.(2010)believed that the LVF has higha dip angle at the north part. Ching et al.(2011)tookthe dip angle to be 70°~75° at the depth of 20 km.Since our model is two dimensional, we set 4 km as thewidth of the LVF and fill the zone with softer materialin order to better simulate behavior of the faults.
As we know, material properties in the model arevery important model parameters. The material in themodel is regarded as a linear elastic medium due torelatively short time scale in simulation. According toHu et al.(1996) and the results of seismic tomography and inversion of material property in the Taiwanregion(Lin et al., 1998; Hu et al., 2001; Zhu et al., 2006; Wu et al., 2007; Zhu et la, 2009; Kuo-Chen et al., 2012), we assign the value range of Young’s modulusas 1~70 GPa, Possion ratio to be 0.20~0.30 and friction coefficient as 0.05~1.20(for fault group I).
Figure 4b shows the geometry of the model and finite element grid. The model domain is 310.8 km × 410.7 km which consists of 53831 nodes and 106874 elements.
The behaviors of the faults in the model are simulated by contact element technology. The Coulombfriction model is used here to determine the contact status(Zhu and Zhang, 2010, 2013; Dai at al., 2013), whichis


The simulation result is largely determined by the boundary conditions(BC). The BCs of our model areestablished based on the GPS data and previous studies(Hu et al., 1997, 2001). Taiwan is located at the marginof Chinese continent, which is a stable continent at the northwest of Taiwan. The two major basement highs, Peikang and Kuanying highs, which are in west of Taiwan appear to be tectonically stable. Besides, in thecalculation of the GPS data we used, the Paisha station situated at the relatively stable Chinese continentalmargin is chosen as the fixed station. Thus, most of the north and west boundaries of the model(line AB and HA in Fig. 4b)are fixed. And the velocity imposed on the boundaries inside the Philippine Sea plate(lines DE and EF in Fig. 4b)is 81.5 mm/yr in azimuth 306°, which is in line with the method by Hu et al.(2001). Theeast part of the northern boundary of the model(line BC), the north part of the eastern boundary(line CD), the west part of the southern boundary(line FG) and the south part of the western boundary(line GH)areconstrained by interpolated GPS data. In addition, in choosing boundary conditions, we add 10 stations on theLuzon isl and s and Ryukyu isl and s outside the research region to prevent introducing errors while extrapolatingwith the GPS data all inside the Taiwan isl and (Yu et al., 1999). After adjustment, the velocities of all the10 GPS stations are relative to Paisha station. Table 1 shows the locations and velocities of the 10 additionalstations.
|
|
Table 1 Additional GPS station velocities |
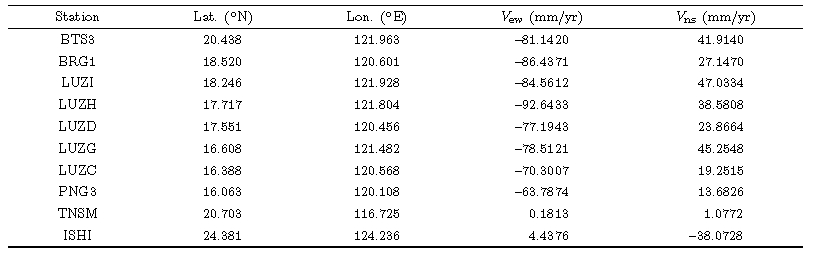
All station velocities are calculated relative to Paisha. Vew and Vns st and for E-W and N-S componentsof station velocity.
We use ANSYS to do the simulateion calculation in this paper. The model is established and meshedthrough APDL script in ANSYS. At last, the post-processing results are exported and displayed in maps byGMT software.
4 SIMULATION RESULTSTo obtain reasonable results in simulation, we make use of the optimal design function of the ANSYS(Design Opt)(similar to the geophysical inversion techniques). Optimal design is a method to find the optimummodel, aiming to satisfy all the requirements and makes some aspects of the design(such as model structure, material parameters, etc.)more reasonable at the meanwhile. To meet the design requirements, some criteriamust be set in which design variables and status variables should follow. To make some aspects of the designmore reasonable means finding a minimum objective function(Zhang, 2008).
Design variables(DV)are independent, the optimization results are achieved by changing the values ofDVs. Each DV has upper and lower limits, which means each DV should be given a range. In ANSYS, we areallowed to set no more than 60 DVs. Status variables(SVs)are dependent variables, which are the values thatconstrain DVs and are the functions of DVs. Objective function is the value to minimize and is the function ofDVs. In the Design Opt process in ANSYS, DV and objective function are necessary, while SV is not(Zhang, 2008).
To minimize the number of DVs, we set the Young’s modulus and Passion’s ratio of No.1, 2, 24 and 25blocks(Fig. 4a)to be 60 GPa and 0.25, respectively, based on Hu et al.(2001). Besides, according to thegeological setting of the research region, we divide the blocks into several groups(Table 2)inside which theblocks share the same Young’s modulus and Passion’s ratio. Furthermore, the faults are divided into two groupsinside which the faults have the same friction coefficient. We set the friction coefficient of the faults except forthose in Group I to be 100. Therefore, after establishing the model structure and BCs, we take the Young’smodulus and Passion ratio of all groups and friction coefficient of Group I as DVs, 15 of which in total(7 groupsof blocks offer 14 DVs and 1 group of fault offers 1 DV). Then we use the ranges that are described before asthe upper and lower limits of DVs and use the differences between the computed velocities and observationalGPS velocities as the objective function. Finally, we obtain the optimal model which has the minimum misfit and the material parameters of all subregions(listed in Table 2)through a large number of numerical experiments. We also present the friction coefficient of Group I, which is 0.5.
|
|
Table 2 Material parameters of all subregions in the optimum model |
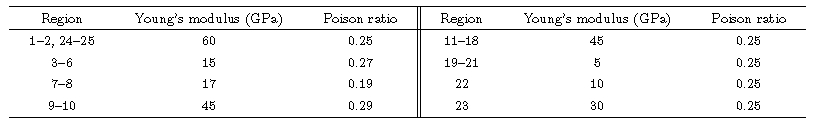
The optimal results show that the Young’s modulus of the No.19-21 blocks which represent the LVF weakzone are the least of all, which is consistent with the actual situation. And the friction coefficient of Group I is0.5, which indicates that the LVF can slip. See below for more details.
4.1 Computed Velocity Field and Slip Features of the LVFThe above ANSYS Design Opt provides not only the model parameters but also the displacement(orvelocity)results of every node in the model. Fig. 5 shows the computed velocity field. We can see from thefigure that the velocity field shows a fan-shaped pattern from north to south. In the mid-east of Taiwan, thevelocities point to northwest, but the direction gradually rotates clockwise to the north and counterclockwise tothe south. This may be explained by the escaping of the materials to northeast and southwest as the indentation and oblique convergence go on in eastern Taiwan, and at the same time, the prominent Peikang and Kuanyinhighs in the west of Taiwan stop the adjacent isl and from moving westward(Lu and Malavieille, 1994; Lu et al., 1998; Lin and Watts, 2002). On the whole, the velocity decreases from southeast to northwest, changing from81.5 mm/yr at Lanyu and Lutao to almost 0 at Taipei Basin(Fig. 5). The velocities of stations in the CoastRange are 37.73~58.86 mm/yr in the directions of 303°~323°. After passing the LVF, the velocities dramaticallydecrease to 19.62~48.30 mm/yr in the west flank of Central Range in the direction of 285°~310°, which isconsistent with the results of Lin et al.(2010). This result implies that the convergence is partly absorbed bythrusting movement of the LVF. The velocities in Western Foothills increase from north to south, which are15.09~31.69 mm/yr in 275°~318°. The velocities in Coastal Plain are 9.06~13.58 mm/yr in 260°~322°.

|
Fig. 5 Calculated results of velocity field and the velocity vectors comparison between two sides of fault group I. Computed velocity vectors as blue, red and yellow arrows, displacements on fault group I as black arrows. The red and yellow arrows indicate the velocities at the corresponding points on both sides of fault group I |
In southern Central Range and Hengchun peninsular, southern Taiwan, the velocities are 49.81~58.86mm/yr in the directions of 275°~280°, which show little change. In the Kaohsiung-Pingtung Plain, the velocitiesare 43.77~49.81 mm/yr, the directions change from west to southwest. As mentioned previously, the rotationof directions in this area may be explained by the escaping of the materials to the weak Manila accretionarywedge offshore southwestern Taiwan as the northwest convergence of Philippine Sea plate is going and Peikang and Kuanyin highs are present west of Taiwan.
In the north of Fengping and Hualien, the velocity field can be divided into two parts by the Lishan fault.In the Hsuehshan Range, west of the Lishan fault, the azimuths of velocities are larger than 315°, which areconsistent with that of the convergence between Philippine Sea and Eurasia plates. In the north of HsuehshanRange, the orientations of the velocities are almost to the north. The directions of velocities gradually changefrom north to east and finally to northeast in the Taipei Basin, with rates 0.2~7.55 mm/yr. The rates in thewest and north of Taipei Basin are marginally significant or insignificant, the results are close to the those of Rau et al.(2008), which is 0.2~11.5 mm/yr. The Kuanyin high situated in west to the northern Taiwan stopsthe adjacent block from moving westward and the relative stable Chinese continent prevents the block frommoving northward, so the velocities in the Hsuehshan Range and Taipei Basin are insignificant. The orientationsdramatically rotate in north Central Range and Ilan Plain, west of the Lishan fault, change from about 320°to the north, northeast, east and finally to about 140° in Ilan Plain, nearly reverse to an opposite direction.The velocity rates change from about 15 mm/yr to 0 in the north and to 16.68 mm/yr in the east and to ahigh value of 34.71 mm/yr offshore eastern Ilan Plain. The dramatic orientation shift of the velocity field inthis area is obviously related to the back-arc extension of the Okinawa trough. Because of the presence of thestable blocks, Kuanyin high and Chinese continent, the materials have a tendency to escape to the east. Alongwith the southward retreat of the Ryukyu arc offshore eastern Ilan Plain, the directions of the velocities in thevicinity shift to southeast.
The Coastal Plain and Taiwan Strait are located in the margin of the Chinese continent and west side ofthe deformation front, so the station velocities here are mostly only marginal or not significant in the directionof northwest, which is consistent with the convergence orientation between Philippine Sea and Eurasia plates.
After crossing the fault Group I from Lutao, Lanhsu and Coast Range, there is a significant change of thevelocity field. In Fig. 5, red and yellow arrows represent the displacements on the west and east side of the discontinuity. Black arrows denote the dislocation(thedisplacement difference between the two sides)on thediscontinuity. The figure shows that the rates and directionsof the velocities change after crossing the faultGroup I, and such changes become larger to the south.The direction shifts from NW in the Coast Range toWNW in the eastern margin of the Central Range, ora 10°~20° decrease in azimuth and 9.67~17.96 mm/yrdecrease in the rate, which means the fault Group I hasremarkable effect on the crustal displacement field ofTaiwan. The calculated slip rate on the fault group Iis 13.81~23.48 mm/yr, increasing from north to south, and the directions are the same as the fault strike. Theseresults are in good agreement with that of Bos et al.(2003), which is 7.8~25 mm/yr.
4.2 Strain Rate FieldFigure 6a shows the principal strain rates of Taiwan, showing the distribution of maximum compressiveprincipal strain rates in Coast Range and offshore easternTaiwan, of which the predominent orientation is inNW-SE, largely consistent with the orientation of plateconvergence between the Philippine Sea and Eurasiaplates. Extension is also found in the Ilan Plain whichis closely related to the opening of the Okinawa Trough.The same extension is present in southern Taiwan, forwhich the reason is explained in previous sections.

|
Fig. 6 (a) Comparison between computed maximum principal strain rates and focal mechanisms. (b) Comparison between computed maximum principal strain rates and World Stress Map. Black cross arrows stand for computed principal strain rates, outward arrows indicate compressive strain and inward arrows indicate tensile strain. Red lines represent data from World Stress Map |
To examine the computed results, we compare theorientations of the computed principal strain rate with those of the focal mechanisms and the World StressMap.
Earthquakes in the period of 1976-01-01–2014-12-31, with focal depths less than 40 km and magnitudesbetween 4 and 10 are chosen in this paper(http://www.globalcmt.org/CMTsearch.html, last visit on Jan.1, 2015)(Dziewonski et al., 1981; Ekstrom et al., 2012). Due to the uneven spatial distribution of seismic events, it is difficult to discern the epicenters of earthquakes. Therefore, we divide the study area into 20×26 smallmeshs. If there are more than 2 events occurred in a mesh, we average each component of the seismic momentsof these events, then calculate the new focal mechanism and show it at the center of the mesh. Fig. 6a showsthe average focal mechanism resolutions are in good agreement with the computed principal strain rate fieldby finite element simulation. Moreover, extrusion is dominated in the Coast Range and West Foothill, and thefocal mechanism results show that there are many thrust-fault earthquakes there. The southern and northernCentral Range and Ilan Plain are in extension, where a number of normal fault earthquakes occurred(Fig. 6a).In the northern and southern Central Range, the extension state is different from Coast Range. This is inaccordance with the conclusions of Hu et al.(1996), Bos et al.(2003) and Zhu et al.(2011)based on GPSdata. The northwestward convergence of the Philippine Sea plate may accounts for that, while the effects ofthe upheaval and extension of the Manila accretion wedge are not negligible. In the Western Foothills and WestPlain, principal compressive strain is dominant, which may be explained by the decay of the strain because of faraway from the central convergence. Actually, low seismicity is found there. The Pingtung plain in southwesternTaiwan is in compression, which is consistent with the results of Hu et al.(1996), Bos et al.(2003) and Zhu et al.(2011), with thrust-fault earthquakes occurring there. We can also see from the figure that there is acounterclockwise rotation of the principal strain. The escape of this area to southwest, westward retreat ofManila trench together with the resistance of Peikang high may explain this phenomenon. The strain field inIlan Plain is a little complex. On the whole, it is extension, while compression can be seen in the south part.This agrees with the focal mechanisms, tectonic escape in northeast Taiwan, opening of the Okinawa trough and southward retreat of the Ryukyu arc system.
In addition, the comparison between computed maximum principal strain rate and World Stress Map(WSM)is displayed in Fig. 6b. The WSM shows the present-day crustal stress of the world. There are two datatypes of the WSM, one is original, the other is smoothed. Since the spatial distribution density of the originaldata is inhomogeneous, we choose the second in this paper(http://dc-app3-14.gfz-potsdam.de/pub/introduction/introduction frame.html, http://dc-app3-14.gfz-potsdam.de/pub/stress data/stress data frame.htm, last visiton Jan. 1, 2015)(Heidbach et al., 2010). Fig. 6b shows that the orientations of computed principal strainrates are in good agreement with that of the WSM except for few areas, suggesting our model is reasonable.
According to the comparison between the computed results and focal mechanism solutions and WSM, themodel we adopted is qualified to delineate the complicated crustal deformation in Taiwan.
Figure 7 displays the computed maximum shear strain rate field in Taiwan. As we focus on the isl and , weonly provide the strain rate field inside the isl and . The figure clearly shows that the shear strain rate is high inthe southern Taiwan on the whole. The maximum value is located in southwest Taiwan and second maximumvalue in the Coast Range, from Hualien to Taitung. It is a little different from the results by Bos et al.(2003) and Zhu et al.(2003), which may be due to the different BCs chosen on southwest borders of the model. The shear strain rate is small in northern and western Taiwan. This may be because the convergence between thePhilippine Sea and the Eurasia plates is absorbed by the LVF region, thus the shear strain rate is significant inthe Coast Range.

|
Fig. 7 Computed maximum shear strain rate field in Taiwan |
To examine whether the calculated results are reasonable, we compare them with the GPS observationresults. Fig. 8 displays the computed and observed velocities at GPS sites. It should be noted that the GPSdata are from Ching et al.(2011), in which the influence of the large earthquakes such as the 1999 Mw 7.6Chi-Chi earthquake in the corresponding period is avoided. In other words, the GPS measurements reflect theinterseismic crustal movement.

|
Fig. 8 Comparison between computed velocity vectors and GPS observation results. Computed velocity vectors as blue arrows and GPS observation results as red arrows |
It can be seen in Fig. 8 that the computed and observed results are in good agreement. The N54°Wtrending movement of the Philippine Sea plate makes an angle of about 74° with the N20°E trend of the LVF.Because the convergence is not perpendicular to the boundary, there is a component of shear stress parallel tothe plate boundary, which results in boundary-parallel shear strain on both sides of the LVF. Thus significantmechanical decoupling occurs across the LVF, which may explain the systematic regional anticlockwise deviationof velocity vector trajectories west of the LVF. The orientation shift is more apparent in the south part of thefault Group I, which has been discussed before. The presence of the fault Group I explains the significant changeof the displacement vectors crossing the LVF. The computed results successfully reproduce a counterclockwiserotation in southwestern Taiwan, in agreement with the GPS observations. The fits of azimuth and magnitudewith the GPS results are good in the northern Central Range and Taipei Basin. The velocity field in the Ilan Plain and offshore northeastern Taiwan is consistent with the observed GPS data in terms of the orientationsas well as the magnitudes.
The LVF is not a purely sinistral strike-slip fault but a left-lateral fault with a large component of thrust(Yu and Liu, 1989; Lee and Angelier, 1993b). Left-lateral strike component dominates at the north part ofthe LVF, which is 6~16 mm/yr. In the central part, the lateral component is 19~24 mm/yr and the thrustcomponent is 16~22 mm/yr, the ration between them is approximately 1:1. While at the southern part, boththe components are 29~34 mm/yr. Despite the LVF zone is weaken, it is difficult to simulate the verticalmovement with a 2-D plane-strain model. Thus, the computed results fit the observed better in the central and northern part of the LVF, near the Meinung fault. But the difference between the computed and observedresults is a bit larger in southern part of the LVF, where vertical components of the thrust displacements aresignificant compared with the horizontal ones. Besides, that the computed velocities are less than the observedresults in southern Ilan Plain may be interpreted by a scarcity of GPS data in this area.
In a word, the computed results are consistent with the GPS observation results, implying our model isreasonable and the calculated results are reliable.
5.2 Different Friction Coefficients Along the LVF
The ANSYS optimal result reveals that the friction coefficients on the faults except fault Group I are verylarge, so these faults have relatively less influence on the strain field of Taiwan region(Bos et al., 2003). In orderto study the main factors, we analyze the influence of the fault Group I on the deformation field of Taiwan bychanging the friction coefficients. Since the optimal friction coefficient on fault Group I is

|
Fig. 9 Computed velocity field results and the velocity comparison between two sides of fault group I with different fault friction coefficients. (a) Friction coefficient of fault group I, μ1 = 0.1. (b) Friction coefficient of fault group I, μ2 = 1.0. |
On the other h and , the 2-D model we established in this paper is simple, different from the actual 3-Dsituation. Besides, friction coefficients on the fault may be variable. Therefore, friction coefficient of 0.5 canhardly be the exact value all along the LVF.
The geological setting and strain field in Taiwan are rather complex. Despite we have simulated theinterseismic crustal deformation and movement velocity by a 2-D finite element model, the result is consideredto be a first approximation. To acquire better results in line with the actual geological structure, more factorsshould be taken into consideration and 3-D modeling is necessary.
6 CONCLUSIONSIn this paper, the crustal movement velocity field and strain field in Taiwan are calculated utilizing theGPS observation data as constraints in simulation. We also discussed main factors controlling the strain ratefield in the paper. The primary conclusions are as follows.
The computed velocity field is consistent with the GPS observation result. Orientations of the calculatedprincipal strain rates are in line with those from the WSM and from focal mechanisms, which indicates thatour model is reasonable at least in first approximation. Thus, the computed deformation field is reliable.
The calculated velocity field in Taiwan shows a fan-shaped pattern from north to south and decreases fromsoutheast toward northwest. In the mid-east of Taiwan, the velocities point to northwest, but the directiongradually rotates clockwise to the north and counterclockwise to the south. This may be explained by theescaping of the materials to northeast and southwest as the indentation and oblique convergence go on ineastern Taiwan and at the same time, the prominent Peikang and Kuanyin highs in the west of Taiwan stopthe adjacent isl and from moving westward. After passing the LVF, the velocities decrease dramatically. Thecalculated dislocation on the LVF is 13.81~23.48 mm/yr, which means the convergence is partly absorbed bythe LVF zone.
The highest calculated maximum principal strain rates of Taiwan are located in the Coast Range and adjacent waters in the eastern Taiwan, the superiority trend of maximum principal compressive strain is NW-SE, which is agree with the orientation of arc-continent collision between the Eurasian and Philippine Sea plates.Extension is found in northern and southern Central Range. And there are more normal fault earthquakesthere. The northwestward convergence of the Philippine Sea plate may accounts for that, while the effects ofthe upheaval and extension of the Manila accretion wedge are not negligible. In the Western Foothills and WestPlain, principal compressive strain is dominant, which may be explained by the decay of the strain because offar away from the center of convergence. The Pingtung plain in southwestern Taiwan is in compression, and there are more thrust fault earthquakes there. We can also see from the figure that there is a counterclockwiserotation of the principal strain there. The escape of this area to southwest, westward retreat of the Manilatrench together with the resistance of the Peikang high may account for this result. The strain status in IlanPlain is a little complex. On the whole, it is extension here, while compression can be seen in the south part.This is agree with the focal mechanism solutions and on account of the tectonic escape in northeast Taiwan, opening of Okinawa Trough and southward retreat of the Ryukyu arc system.
The calculated results imply that the general framework of present-day deformation in Taiwan resultsfrom interactions of many factors such as plate collision between the Eurasian and the Philippine Sea plates, geometry of the plate boundaries, resistance of Kuanyin and Peikang highs, faulting and rifting, opening of theOkinawa trough and retreat of the Ryukyu Trench.
We are grateful to the editors for their valuable suggestions. This work was supported by the NaturalScience Foundation of Beijing(8152034), the National Natural Science Foundation of China(4094020), OpenFoundation of State Key Laboratory for Earthquake Dynamics(LED2012B01), and Special Projects of ScientificResearch Institutions of State Level(ZDJ2013-21, ZD2014-01).
| [1] | Angelier J, Chu H T, Lee J C, et al. 2000. Active faulting and earthquake hazard: The case study of the Chihshang Fault, Taiwan. Journal of Geodynamics, 29(3-5): 151-185. |
| [2] | Angelier J, Chang T Y, Hu J C, et al. 2009. Does extrusion occur at both tips of the Taiwan collision belt? Insights from active deformation studies in the Ilan Plain and Pingtung Plain regions. Tectonophysics, 466(3-4): 356-376. |
| [3] | Barrier E, Angelier J. 1986. Active collision in eastern Taiwan: the Coastal Range. Tectonophysics, 125(1-3): 39-72. |
| [4] | Biq C C. 1972. Transcurrent buckling, transform faulting and transpression, their relevance in eastern Taiwan kinematics. Petrol. Geol. Taiwan, 20: 1-39. |
| [5] | Bonilla M G. 1975. A review of recently active faults in Taiwan. US: US Geological Survey. |
| [6] | Bonilla M G. 1977. Summary of Quaternary faulting and elevation changes in Taiwan. Mem. Geol. Soc. China, 2: 43-55. |
| [7] | Bos A G, Spakman W, Nyst M C J. 2003. Surface deformation and tectonic setting of Taiwan inferred from a GPS velocity field. Journal of Geophysical Research: Solid Earth (1978-2012), 108(B10): 2458. |
| [8] | Chang C H,Wu Y M, Shin T C, et al. 2000. Relocation of the 1999 Chi-Chi earthquake in Taiwan. Terrestrial Atmospheric and Oceanic Sciences, 11(3): 581-590. |
| [9] | Chang C P, Chang T Y, Angelier J, et al. 2003. Strain and stress field in Taiwan oblique convergent system: constraints from GPS observation and tectonic data. Earth and Planetary Science Letters, 214(1-2): 115-127. |
| [10] | Chen K P, Tsai Y B. 2008. A catalog of Taiwan earthquakes (1900-2006) with homogenized Mw magnitudes. Bulletin of the Seismological Society of America, 98(1): 483-489. |
| [11] | Cheng S N. 1995. The study of stress distribution in and around Taiwan [Ph. D. thesis] (in Chinese). Taiwan: National Central University. |
| [12] | Chi W R, Namson J, Suppe J. 1981. Stratigraphic record of plate interactions in the Coastal Range of eastern Taiwan. Mem. Geol. Soc. China, 4: 155-194. |
| [13] | Chiang C W, Chen C C, Chen C S, et al. 2008. Deep electrical structure of the southern Taiwan orogeny and its tectonic implications by MT data. // Abstracts of the 19th International Workshop on Electromagnetic Induction in the Earth (Volume 1). Ching K E, Rau R J, Lee J C, et al. 2007. Contemporary deformation of tectonic escape in SW Taiwan from GPS observations, 1995-2005. Earth and Planetary Science Letters, 262(3-4): 601-619. |
| [14] | Ching K E, Rau R J, Johnson K M, et al. 2011. Present-day kinematics of active mountain building in Taiwan from GPS observations during 1995-2005. Journal of Geophysical Research: Solid Earth, 116(B9): B09405, doi: 10.1029/2010jb008058. |
| [15] | Clift P D, Schouten H, Draut A E. 2003. A general model of arc-continent collision and subduction polarity reversal from Taiwan and the Irish Caledonides. Geological Society, London, Special Publications, 219(1): 81-98. |
| [16] | Dai L M, Li S Z, Lou D, et al. 2013. Numerical modeling on the stress filed in the Huanghua depression, Bohai Bay basin. Chinese J. Geophys. (in Chinese), 56(3): 929-942, doi: 10.6038/cjg20130321. |
| [17] | Dziewonski A M, Chou T A, Woodhouse J H. 1981. Determination of earthquake source parameters from waveform data for studies of global and regional seismicity. Journal of Geophysical Research: Solid Earth (1978-2012), 86(B4): 2825-2852. |
| [18] | Ekström G, Nettles M, Dziewónski A M. 2012. The global CMT project 2004-2010: centroid-moment tensors for 13017 earthquakes. Physics of the Earth and Planetary Interiors, 200-201: 1-9. |
| [19] | Hao J L, Wang W M, Wang J, et al. 2009. A dislocation model of elastic block for aseismic crustal deformation in Taiwan. Chinese J. Geophys. (in Chinese), 52(5): 1223-1232, doi:10.3969/j.issn.0001-5733.2009.05.011. |
| [20] | He Y M, Yao Z X. 2002. Dislocation model for current crustal deformation in and around southern Taiwan, China. Chinese J. Geophys. (in Chinese), 45(5): 638-645. |
| [21] | Heidbach O, Tingay M, Barth A, et al. 2010. Global crustal stress pattern based on the World Stress Map database release 2008. Tectonophysics, 482(1-4): 3-15. |
| [22] | Ho C S. 1986. A synthesis of the geologic evolution of Taiwan. Tectonophysics, 125(1-3): 1-16. |
| [23] | Ho C S. 1988. An introduction to the geology of Taiwan: explanatory text of the geologic map of Taiwan. Taipei, Taiwan: Central Geological Survey, Ministry of Economic Affairs. |
| [24] | Hsu M T. 1980. Earthquake Catalogues in Taiwan (from 1644 to 1979) [Ph. D. thesis]. Taipei: National Taiwan University,77. |
| [25] | Hsu T L. 1976. Neotectonics of the Longitudinal Valley, eastern Taiwan. Bull. Geol. Surv. Taiwan, 25: 53-62. |
| [26] | Hsu V. 1990. Seismicity and tectonics of a continent-island arc collision zone at the Island of Taiwan. Journal of Geophysical Research: Solid Earth (1978-2012), 95(B4): 4725-4734. |
| [27] | Hsu Y J, Yu S B, Simons M, et al. 2009. Interseismic crustal deformation in the Taiwan plate boundary zone revealed by GPS observations, seismicity, and earthquake focal mechanisms. Tectonophysics, 479(1-2): 4-18. |
| [28] | Hu J C, Angelier J, Lee J C, et al. 1996. Kinematics of convergence, deformation and stress distribution in the Taiwan collision area: 2-D finite-element numerical modelling. Tectonophysics, 255(3-4): 243-268. |
| [29] | Hu J C, Angelier J, Yu S B. 1997. An interpretation of the active deformation of southern Taiwan based on numerical simulation and GPS studies. Tectonophysics, 274(1): 145-169. |
| [30] | Hu J C, Yu S B, Angelier J, et al. 2001. Active deformation of Taiwan from GPS measurements and numerical simulations. Journal of Geophysical Research: Solid Earth (1978-2012), 106(B2): 2265-2280. |
| [31] | Huang M H, Hu J C, Hsieh C S, et al. 2006. A growing structure near the deformation front in SW Taiwan as |
| [32] | deduced from SAR interferometry and geodetic observation. Geophysical Research Letters, 33(12): L12305, doi: 10.1029/2005gl025613. |
| [33] | Huang W J, Johnson K M, Fukuda J, et al. 2010. Insights into active tectonics of eastern Taiwan from analyses of geodetic and geologic data. Journal of Geophysical Research: Solid Earth (1978-2012), 115(B3): B03413. |
| [34] | Huchon P, Barrier E, de Bremaecker J C, et al. 1986. Collision and stress trajectories in Taiwan: a finite element model. Tectonophysics, 125(1-3): 179-191. |
| [35] | Kao H, Wu F T. 1996. The 16 September 1994 earthquake (mb=6.5) in the Taiwan strait and its tectonic implications. Terrestrial, Atmosphere and Oceanic Science, 7(1): 13-29. |
| [36] | Kao H, Shen S S J, Ma K F. 1998. Transition from oblique subduction to collision: Earthquakes in the southernmost Ryukyu arc-Taiwan region. Journal of Geophysical Research: Solid Earth (1978-2012), 103(B4): 7211-7229. |
| [37] | Kao H, Chen W P. 2000. The Chi-Chi earthquake sequence: active, out-of-sequence thrust faulting in Taiwan. Science, 288(5475): 2346-2349. |
| [38] | Kuo-Chen H, Wu F T, Jenkins D M, et al. 2012. Seismic evidence for the - quartz transition beneath Taiwan from Vp/Vs tomography. Geophysical Research Letters, 39(22): L22302. |
| [39] | Lallemand S, Font Y, Bijwaard H, et al. 2001. New insights on 3-D plates interaction near Taiwan from tomography and tectonic implications. Tectonophysics, 335(3-4): 229-253. |
| [40] | Lee J C, Angelier J. 1993a. Localisation des déformations actives et traitement des données géodésiques: l'exemple de la faille de la Vallée Longitudinale, Taiwan. Bull. Soc. Géol. France, 164(4): 533-570. |
| [41] | Lee J C, Angelier J. 1993b. Location of active deformations and geodetic data analyses: An example of the longitudinal valley fault, taiwan. Bull. Soc. Géol. France, 164(4): 533-540. |
| [42] | Lee J C, Angelier J, Chu H T, et al. 2001. Continuous monitoring of an active fault in a plate suture zone: a creepmeter study of the Chihshang Fault, eastern Taiwan. Tectonophysics, 333(1-2): 219-240. |
| [43] | Lee J C, Angelier J, Chu H T, et al. 2003. Active fault creep variations at Chihshang, Taiwan, revealed by creep meter monitoring, 1998-2001. Journal of Geophysical Research: Solid Earth (1978-2012), 108(B11): 2528. |
| [44] | Lin A T, Watts A B. 2002. Origin of the West Taiwan basin by orogenic loading and flexure of a rifted continental margin. Journal of Geophysical Research: Solid Earth (1978-2012), 107(B9): 2185. |
| [45] | Lin C H, Yeh Y H, Yen H Y, et al. 1998. Three-dimensional elastic wave velocity structure of the Hualien region of Taiwan: Evidence of active crustal exhumation. Tectonics, 17(1): 89-103. |
| [46] | Lin K C, Hu J C, Ching K E, et al. 2010. GPS crustal deformation, strain rate, and seismic activity after the 1999 Chi-Chi earthquake in Taiwan. Journal of Geophysical Research: Solid Earth, 115(B7): B07404, doi: 10.1029/2009JB0064-17. |
| [47] | Lu C Y, Jeng F S, Chang K J, et al. 1998. Impact of basement high on the structure and kinematics of the western Taiwan thrust wedge: insights from sandbox models. Terrestrial, Atmospheric and Oceanic Sciences, 9(3): 533-550. |
| [48] | Lu C Y, Malavieille J. 1994. Oblique convergence, indentation and rotation tectonics in the Taiwan Mountain Belt: Insights from experimental modelling. Earth and Planetary Science Letters, 121(3-4): 477-494. |
| [49] | Pezzopane S K, Wesnousky S G. 1989. Large earthquakes and crustal deformation near Taiwan. Journal of Geophysical Research: Solid Earth (1978-2012), 94(B6): 7250-7264. |
| [50] | Rau R J, Wu F T. 1995. Tomographic imaging of lithospheric structures under Taiwan. Earth and Planetary Science Letters, 133(3-4): 517-532. |
| [51] | Rau R J, Ching K E, Hu J C, et al. 2008. Crustal deformation and block kinematics in transition from collision to subduction: Global positioning system measurements in northern Taiwan, 1995-2005. Journal of Geophysical Research: Solid Earth (1978-2012), 113(B9): B09404. |
| [52] | Shi Y L, Zhu S B. 2006. Discussion on method of calculating strain with GPS displacement data. Journal of Geodesy and Geodynamics (in Chinese), 26(1): 1-8. |
| [53] | Sun Y J, Zhang H, Shi Y L, et al. 2011. Numerical investigation on the geodynamical mechanism of the first major shock of 2006 Pingtung MW7.0 earthquake. Sci. China Earth Sci. (in Chinese), 54(5): 631-639, doi: 10. 1007/s11430-010- 4114-9. |
| [54] | Suppe J. 1984. Kinematics of arc-continent collision, flipping of subduction, and back-arc spreading near Taiwan. Mem. Geol. Soc. China, 6: 21-33. |
| [55] | Teng L S. 1987. Stratigraphic records of the late Cenozoic Penglai orogeny of Taiwan. Acta Geologica Taiwanica, (25): 205-224. |
| [56] | Teng L S. 1990. Geotectonic evolution of late Cenozoic arc-continent collision in Taiwan. Tectonophysics, 183(1-4): 57-76, doi: http://dx.doi.org/10.1016/0040-1951(90)90188-E. |
| [57] | Teng L S. 1996. Extensional collapse of the northern Taiwan mountain belt. Geology, 24(10): 949-952. |
| [58] | Tsai Y B. 1986. Seismotectonics of Taiwan. Tectonophysics, 125(1-3): 17-28, 31-37. |
| [59] | Wu F T. 1978. Recent tectonics of Taiwan. Journal of Physics of the Earth, 26(Suppl): S265-S299. |
| [60] | Wu Y M, Chang C H, Zhao L, et al. 2007. Seismic tomography of Taiwan: Improved constraints from a dense network of strong motion stations. Journal of Geophysical Research: Solid Earth (1978-2012), 112(B8): B08312. |
| [61] | Wu Y M, Zhao L, Chang C H, et al. 2009. Relocation of the 2006 Pingtung Earthquake sequence and seismotectonics in Southern Taiwan. Tectonophysics, 479(1-2): 19-27. |
| [62] | Yu S B, Liu C C. 1989. Fault creep on the central segment of the Longitudinal Valley fault, eastern Taiwan. Proc. Geol. Soc. China, 32(3): 209-231. |
| [63] | Yu S B, Jackson D D, Yu G K, et al. 1990. Dislocation model for crustal deformation in the Longitudinal Valley area, Eastern Taiwan. Tectonophysics, 183(1-4): 97-109. |
| [64] | Yu S B, Chen H Y. 1994. Global positioning system measurements of crustal deformation in the Taiwan arc-continent collision zone. Terrestrial, Atmospheric and Oceanic Sciences, 5(4): 477-498. |
| [65] | Yu S B, Chen H Y, Kuo L C. 1997. Velocity field of GPS stations in the Taiwan area. Tectonophysics, 274(1): 41-59. |
| [66] | Yu S B, Kuo L C, Punongbayan R S, et al. 1999. GPS observation of crustal deformation in the Taiwan-Luzon Region. Geophysical Research Letters, 26(7): 923-926, doi: 10.1029/1999gl900148. |
| [67] | Zhang C H. 2008. ANSYS 11.0 Engineering Application Examples of Analytic Structure (in Chinese). Beijing: China Machine Press. Zhu S B, Shi Y L. 2004. Genetic algorithm-finite element inversion of drag forces exerted by the lower crust on the upper crust in the Sichuan-Yunnan area. Chinese J. Geophys. (in Chinese), 47(2): 232-239. |
| [68] | Zhu S B, Shi Y L. 2005. Genetic algorithm-finite element inversion of topographic spreading forces and drag forces of lower crust to upper crust in Tibetan Plateau. Acta Scientiarum Naturalium Universitatis Pekinensis (in Chinese),41(2): 225-234. |
| [69] | Zhu S B, Cai Y E. 2006. Inversion of viscous properties of crust and mantle from the GPS temporal series measurements. Chinese J. Geophys. (in Chinese), 49(3): 771-777. |
| [70] | Zhu S B, Shi Y L. 2007. Origin of tectonic stresses in the Chinese continent and adjacent areas. Science in China Series D: Earth Sciences (in Chinese), 50(1): 67-74. |
| [71] | Zhu S B, Xing H L, Xie F R, et al. 2008. Simulation of earthquake processes by finite element method: The case of megathrust earthquakes on the Sumatra subduction zone. Chinese J. Geophys. (in Chinese), 51(2): 460-468. |
| [72] | Zhu S B, Cai Y E. 2009. Dynamic mechanisms of the post-seismic deformation following large events: Case study of the 1999 Chi-Chi earthquake in Taiwan of China. Science in China Series D: Earth Sciences (in Chinese), 52(11): 1813-1824. |
| [73] | Zhu S B, Zhang P Z. 2010. Numeric modeling of the strain accumulation and release of the 2008 Wenchuan, Sichuan, China, earthquake. Bull. Seismol. Soc. Am., 100(5B): 825-2839. |
| [74] | Zhu S B, Zhao X Y, Liu Y, et al. 2011. Distribution of strain rates in Taiwan before and after 1999 Chi-Chi earthquake and their geodynamic mechanisms. Journal of Geodesy and Geodynamics (in Chinese), 31(2): 38-43. |
| [75] | Zhu S B, Zhang P Z. 2013. FEM simulation of interseismic and coseismic deformation associated with the 2008 Wenchuan earthquake. Tectonophysics, 584: 64-80, doi: 10.1016/j.tecto.2012.06.024. |