 2015, Vol. 58


2. The Geophysical Electromagnetic Detection Technology Key Laboratory of Ministry of Land and Resources, Langfang Hebei 065000, China
The lithosphere,composed of caprock of the high-velocity upper mantle and the crust,lies above theasthenosphere and is widely used as a synonym of the rigid crust of the earth. The boundary between thelithosphere and the asthenosphere is referred to as the lithosphere-asthenosphere boundary(LAB). Quantitativeresearch includes various definitions of the lithosphere based on various physical and chemical properties suchas mechanical,thermal,seismologic,elastic,chemical,petrologic,and electrical qualities(Chen et al.,2007),which indicates the respective limitations of the different approaches. Below the continental lithosphere,LABsdetermined by the various definitions of lithosphere often exhibit significant differences; thus,the LAB underthe continental lithosphere has a complex structure and nature. Based on the features of the asthenospherein the upper mantle such as lower seismic velocity,high-conductivity,high temperature,and relatively strongplasticity,changes in thickness of the electrical lithosphere can be detected by telluric electromagnetic soundingto determine the depth of the top of the high-conductive layer in the upper mantle(Wei et al.,2008). Previousstudies have shown that the LAB and the thermal-rheological bottom boundary have strong correlation,asdetermined by magnetotelluric(MT)sounding in the craton region. Because latter is defined from a mechanicalperspective,the definition is close to that according to the plate tectonics theory(Wei and Li,2015). Thisreflects to some extent the physical significance of the LAB as determined according to the high-conductivelayer in the upper mantle.
The deep crust,mantle structure,and construction inside the continent are popular subjects in currentgeoscience research,in which the exchange and transfer of deep substances and energy are explored(Teng et al.,2014). The lithosphere in mainl and China is composed of numerous small blocks and has experienced along and complicated evolutionary process. Therefore,its interior structure is extremely complex and resultsin strong structural deformation,magmatic activity,and endogenic mineralization(Wan,2012). Research ofthe electrical properties of the lithosphere in China,including the distribution of the LAB as determined bythe high-conductive layer in the upper mantle,may provide important information for these issues. However,because most of results are centralized in particular regions,less research has been conducted on the overalldevelopment and distribution of the high-conductive layer in the upper mantle on a nationwide scale. To analyzethe electrical properties of the lithosphere in mainl and China,Li(1996)prepared resistivity and top-depth mapsof high-conductive layers in the crust and upper mantle in that region at depths of 30 km,90 km,and 150 kmaccording to MT surveys prior to 1994. This study supplements the previous data with those of MT soundingsperformed from 1995 to 2010. Moreover,a new top-depth map of the high-conductive layer in the upper mantleof mainl and China is prepared,and the relationship between the topography of the high-conductive layer in theupper mantle and the endogenous metallic ores and petroleum reservoirs is analyzed.
2 ORIGIN OF THE HIGH-CONDUCTIVITY LAYER IN THE UPPER MANTLEWith an increasing depth underground,the earth’s temperature gradually rises. At depth about 150 km,temperature rises with depth fast in hight heat fluxes areas,while temperature rises with depth slow in low heatfluxes areas. Such increases in temperature with depth are defined as the geothermal gradient(Fig. 1; Vanyan,2001). The resistivity of the crust and the upper mantle lowers with increaing depth(Fig. 2a). The electricaltesting results of high-temperature and high-pressure mantle rocks show that the resistivity of the rocks alsodecreases with increasing temperature(Fig. 2b; Parkhomenko,1989; Li et al.,1998a). When the initial melttemperature(solidus curve)of the rocks is reached,the resistivity of the rocks is sharply lowered. Therefore,ifthe earth temperature at a certain depth in the upper mantle reaches the initial melt temperature of the rocks,generally 1100~1200°C,the resistivity anomaly appears at the corresponding high-conductive layer in the uppermantle. The resistivity value of the rocks is highly sensitive to the status of their molten masses. Previousresearch has shown that when the content of the molten mass of spinel lherzolite is 3%,its resistivity value isonly 5 Ωm(Jin and Bai,1993),which is close to the electrical property value of the high-conductive layer inthe upper mantle. However,some molten masses that weaken the grain boundary of ores result in decreases inthe flow strength and effective viscosity of the upper mantle,thus representing a plastic asthenosphere believedby many researchers to be mantle asthenosphere(Lu,1989). That is,the high-conductive layer in the uppermantle corresponds roughly to the asthenosphere of the upper mantle. Wang et al.(2005)analyzed the pressure and temperature estimations inside the earth at the lower crust and deeper earth.They determined that the fluids are at their supercritical status,which help to form highly mineralizedfluids,partial melting,mineral particle reaction rims,and spot defects that contribute to formation of thehigh-conductive layer.

|
Fig.1 The geothermal distribution of the continent (ВАНБЯН, 2001) |

|
Fig.2 (a) Geoelectric sections of continental crust and upper mantle (ВАНБЯН, 2001); (b) Eclogite resistivity under high temperature and high pressure condition (Parhomenko, 1989; Li et al. 1998) |
Because MT sounding is not affected by the highresistive shielding,such as an area covered by verythick basalt,and is sensitive to the high-conductivelayer,it is very easy to determine the top boundary ofthe asthenosphere. However,as shown by the profileof the Chinese 39° line in Fig. 3,where the maximumthickness of the asthenosphere is 300 km,the thickness of the asthenosphere is generally more than 100~200 km,and the resistivity is only several or tens of ohmswithin the scope of frequency as adopted by MT sounding. Therefore,the electromagnetic waves are absorbedby the very thick asthenosphere and generally does not reach the bottom boundary of the asthenosphere. Insome places,however,the high-conductive layer in the upper mantle is thin and can be explored up to the secondhigh-conductive layer. Because the top boundary of the first high-conductive layer in the upper mantle indicatespart of the melting penetration of the mantle rocks(Peng et al.,2012) and is a type of plastic asthenosphere,the top boundary of the first high-conductive layer in the upper mantle as detected by MT sounding is usedin the present study to represent the top boundary of the asthenosphere. The results are used to evaluate thefavorable sections of the endogenous metallic ores and the petroleum reservoirs of mantle origin by researchingtheir buried depths,locations,and morphological characteristics.

|
Fig.3 Deep geophysical profile along the N39° line of China (added the MT on the basis of the result of Liu et al. 2004) |
The geothermal flux,a quantity of original heat that is transmitted to the surface and radiated externallyon the unit area of the surface,is commonly expressed by
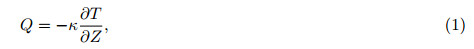
where Q is the geothermal flux(mW·m-2); κ is the thermal conductivity of rocks(W·m-1·K-1); and  isthe geothermal gradient(K/km); the negative sign(-)represents the heat radiation directed to extraterrestrialspace.
Eq.(1)indicates that the geothermal flux value is in direct proportion to the geothermal gradient and the thermal conductivity of the rocks,and the sharply lowered resistivity of the rocks is closely related to theunderground deep temperature when it reaches the initial melt temperature(solidus curve)of rocks. Ad′am ′(1978)conducted a statistical study of the relationship between the geothermal flux values and the depths of thetop boundary of the upper mantle in several regions,obtaining the empirical formula between the geothermalflux value(Q) and the depth of the top boundary of the upper mantle(HL):

where HL is the buried depth of the top boundary of the upper mantle(km),and Q is the geothermal flux value(HFU). We measured the geothermal flux value(Q')in mW·m-2,where 1 HFU = 41.87 mW·m-2.
Therefore,in Eq.(2),Q = Q0/41.87,i.e.,

Two geoscientific profiles were selected to analyze MT sounding and geothermal flux data. One is EastUjimqin,Inner Mongolia-Yi County,Liaoning(Shi et al.,1991),and the other is Heihe,Heilongjiang-Fuyu,Jilin. We compare the depth of the top boundary of the upper mantle estimated by using the geothermalflux values and the depths of the high-conductive layer in the upper mantle reversely deduced from the MTsounding(Figs. 4 and 5). The results show good agreement,and the morphological characteristics are essentiallyconsistent. Therefore,Ad′am’s empirical formula is applicable to China.

|
Fig.4 The depth of high conductive layer in upper mantle according to MT and the average heat flow along Yixian-East Ujimqin profile |

|
Fig.5 The depth of high conductive layer in upper mantle according to MT and the average heat flow along Heihe-Fuyu profile |
To further prove the feasibility of our estimation,the Tarim Basin is selected for comparative researchbecause it is well studied in geothermal but poor in MT sounding data. Feng et al.(2009)calculated thegeothermal flux value of the Tarim Basin by using numerous geothermal logging data and rock thermal conductivity data to prepare the geothermal flux map of the entire basin. Meanwhile,only four sounding points ofone geoscientific profile and one depth surveying point are present inside the concave region in Yecheng Countyof this basin. The depth of the top boundary of the upper mantle in the Tarim Basin was estimated by usingthe geothermal flux values of the Basin as reported by Feng et al.(2009)by using Ádáms empirical formula (Fig. 6). The depth of the top boundary of the high-conductive layer in the upper mantle obtained from thefive aforementioned telluric electromagnetic sounding points is highly consistent with that estimated by usingthe geothermal flux. This result demonstrates that the depth of the top boundary of the upper mantle can beestimated by using the geothermal flux values in an area where no or little MT data are available.

|
Fig.6 The top interface in upper mantle in Tarim basin (according to Feng et al. (2009) heat flow results) |
Deng et al.(2008)compared the results of MT and geothermal flux research used in determining thethickness of the lithosphere composed of various materials. They reported that the maximum consistency ratioof the lithosphere thickness is 80% with 10%~15% error.
The existing geothermal flux data has large gaps. Therefore,in the present study,we use previous estimations to supplement and improve the depth of the top boundary of the high-conductive layer in the uppermantle.
4 DISTRIBUTION CHARACTERISTICS OF THE HIGH-CONDUCTIVITY LAYER IN THEUPPER MANTLE IN MAINLAND CHINA 4.1 Preparation of the top Boundary Depth Map of the High-Conductivity Layer in the UpperMantle in Mainl and ChinaTo the 1°×1° top boundary depth map of the high-conductive layer in the upper mantle in mainl and China made by Li(1996),we supplemented MT sounding data obtained by actual measurement as reported inthe domestic literature from 1997 to 2010. In addition,we supplemented the geothermal flux data containinglarge gaps. The following data were collected: MT sounding data of the Tibetan Plateau(Sheng et al.,2006,2009,2010; Zhang et al.,1996; Ma et al.,2001; Wei W B et al.,2006a,2009; Liu et al.,2001; Zhao et al.,2004,2008; Sun et al.,2003; Tan et al.,2004; Tang et al.,2005; Ma et al.,2005; Kong et al.,1996),northeast China(Niu and Lu,1998; Liu et al.,2006a,2006b; Liu et al.,2009; Lu et al.,2005),and other regions(Xu,1996; Yang et al.,2005; Wei W B et al.,2006b; Ye et al.,2009; Zhao et al.,1997,1999,2009; Zhang et al.,2010; Deng et al.,1990,2001; Zhan et al.,2000,2004,2008; Y et al.,2008; Zhu et al.,2005; Li et al.,1998a,1998b; Zhang et al.,2008; Wang et al.,2010) and geothermal flux data(Feng et al.,2009; Wang et al.,1995). The values of thedepth of the top boundary of the high-conductive layer in the upper mantle at all surveying points in the gridobtained,based on the 1°×1° grid scale,were averaged as the value of that in the corresponding unit. Fig. 7shows the distribution of these data. The data in the eastern region are better than those in the western region.The areas in the west in which the data are lacking are mainly mountainous areas such as the Kunlun,AltynTagh,Kailas,and Nyainqentanglha mountains. The new top boundary depth map of the high-conductivitylayer in the upper mantle in mainl and China is prepared by using the data based on the 1°×1° grid(Fig. 6).

|
Fig.7 The research intensity map of MT method in the continent of China |
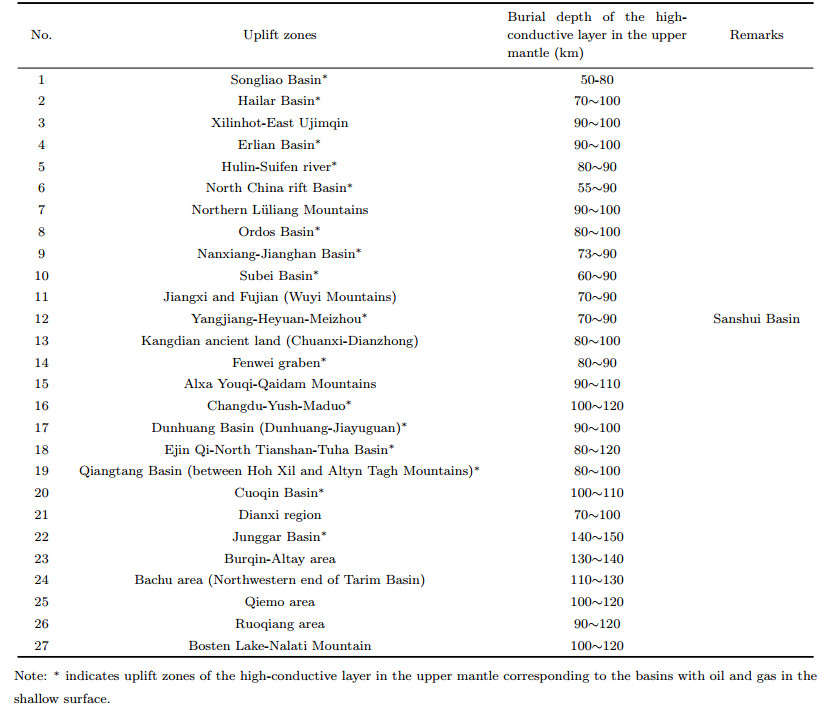
In Fig. 8,the depth of the top boundary of the high-conductive layer in the upper mantle in China shows zoning in the south and north and partitioning in the east and west. Bounded by the north-south seismicbelt,such depth in the east is shallow and deep in the west. Demarcated by West Kunlun-Qinling-Dabiemountains-Shanghai,it is shallow to the north and deep to the south. The depth varies significantly,with theshallowest point of about 50~60 km at the Songliao Basin in Northeast China and the deepest point,230 kmat Changsha-Guilin; the average depth is about 100~120 km. Based on the uplift and depression pattern of thedepth of the top boundary of the high-conductivity layer in the upper mantle in mainl and China,27 uplift(lithospheric thinning)zones are recognized,named according to their locations(Table 1). The majority ofthese uplift zones correspond to regions of high heatflow and strong earthquakes,with the features of theactive structure zones located mostly under the current rift and basin structures. Moreover,the highconductive layer in the upper mantle at the deep levelhas strong correlation with basins and rifts such as theNorth China rift basin(Zhao et al.,1990; Fig. 9) and the Fenwei rift(Deng et al.,2008; Xing et al.,1989;Fig. 10).

|
Fig.8 The depth of the top interface of the high conductive layer in upper mantle in the continent of China |

|
Fig.9 MT result in the rift basin of NC (new data was added base on Jiang et al. 1990) |

|
Fig.10 MT result in Fenwei graben system (Deng et al. 2008; Xing et al. 1989) |
| Table 1 Uplift zones of the high-conductive layer in the upper mantle in mainland China |
Research of burial depth and its distribution ofthe high-conductive layer in the upper mantle is relevant to determining the distributions of endogenousmetallic ores and petroleum reservoirs.
5 RELATIONSHIP BETWEEN DISTRIBUTION OF THE HIGH-CONDUCTIVITY LAYERIN THE UPPER MANTLE AND DISTRIBUTION OF ENDOGENOUS METALLIC ORESResearchers have examined the relationship between the distribution of endogenous metallic ores and thedepth structure from different perspectives(Shcheglov,1990; Xu,1996). Shcheglov(1990)studied metallic oresoccurring in various places worldwide and determined that the uplift walls of the upper mantle or upper mantlediapirs are generally locations rich tin and tungsten ores and that copper,lead,zinc,and molybdenum ores areabundant in the uplift slope of the mantle,particularly in the inclined upper gradient zone. The uplift of theupper mantle is controlled by the uplifting of the asthenosphere(Shan et al.,1987). Shcheglov also reportedthat because the differential deformation of the morphology of the mantle is successive and can exist in the longtime,it is favorable for formation of the ore reserves in various periods. The geoelectric features of the depthdetermined by geophysical exploration reflect the contemporary depth status because the deep geophysical fieldat the early stage has been retained and will not disappear in the short time. For example,a temperature fieldhaving a significant influence on the resistivity of the rocks will not be rapidly lowered. Thus,a lengthy periodis required for the temperature at a certain section in the lithosphere to be lowered from 1200 °C to 500~600°C upon upwelling of the asthenosphere,which is the minimum temperature of the mantle rocks at the moltenstage. Several researchers have calculated the theoretical retention time of the ancient deep structure to be at200 million to 300 million years(Ge et al.,2009). This result is largely consistent with that of Shcheglov suchthat differential deformation of the morphology of the mantle can exist in the long time. Two examples aregiven below.
(1)The obvious uplift of the asthenosphere occurring from the Neopaleozoic to the early Mesozoic era canbe clearly identified in the Ailao Mountains,Yunnan Province by using geophysical methods(Ge et al.,2009).Under the background of early uplift of the asthenosphere,the effects of the later uplift of the asthenosphereare stacked,and a metallogenic model resulting from several stages of asthenospheric uplift can be made forthis ore-rich area(Fig. 11).

|
Fig.11 Crust mantle structure and distribution of mineral resources at Ailao Mountain ore district (Simplified Ge et al. 2009) |
(2)The Panxi paleo-rift,Sichuan Province,formed during the Caledonian and Indosinian periods. It wasoriginally formed during the Caledonian 500 Ma,enlarged in the early Varisian,then shrank and disappearedduring the late Indosinian-Yanshanian period(Zhang and Jiang,1988). The MT sounding in the Panxi paleo-rift(Fig. 12)indicates that neither heat flow anomalies as strong as that of the contemporary rift nor an anomaliesof the low resistivity of the upper mantle at the bottom occurred(Li and Jin,1987). However,the uplift marksof the asthenosphere are present. Additionally,the abnormally high resistivity in the lithosphere observed inthe ancient rift shows an upwell of a significant amount of mantle-origin magmatic rocks that have cooled and formed high-resistivity anomalies. According to the data of Zhang and Jiang(1988),the mineralizationtime of the endogenous metallic ores in the Panxi paleo-rift was the later Caledonian,Varisian,Indosinian and Yanshanian periods; consistent with the times of formation,breakup,uplift,and shrinkage of the rift. These endogenous ores are distributed mainly in the upperfault zones of the rift axis,and the deep part corresponds to the uplift zone of the asthenosphere.

|
Fig.12 MT section in the western Panzhihua rift belt (Li et al. 1987) |
The region of the Qinling Mountains is an important metallogenetic area in China and is a favorable location for researching the relationship betweenore distribution and deep structure. From 1997 to1999,the Institute of Physical and Chemical Exploration,starting from the research of the electricalproperties of the deep part,explored the relationshipbetween deep geoelectric structure and the distribution of the endogenous metallic ores in this area(Li et al.,1999). Fig. 13 shows that the majority of the oredeposits are located at the uplift or inclined uppergradient zone on both sides of the high-conductivelayer in the upper mantle. In this area,most ofthe molybdenum and tungsten ore deposits are located at the uplift,and the copper,lead,zinc,gold,antimony,and mercury ore deposits are located atthe inclined upper gradient zone; fewer endogenousmetallic ores are distributed in the concave region ofthe high-conductive layer in the upper mantle.

|
Fig.13 The depth of high conductive layer in upper mantle (Li et al.1999) and distribution of the Mesozoic endogenetic metallic ore in Qinling area (Guo et al. 1989; Xu et al. 1996) |
On the basis of these results,the known endogenous metallic ores of tungsten,tin,molybdenum,antimony,gold,iron,chrome,copper,nickel,lead,zinc,and mercury on the metallogenetic map of the Chinese endogenousmetallic ores(Guo and Liu,1989)from the Mesozoic era have been stacked on the top boundary depth mapof high-conductivity layer in the upper mantle in mainl and China(Fig. 14). The statistics of these 12 ores areshown in Fig. 15. More than 80% of the endogenous ore deposits of all elements are distributed in the upliftor upper gradient zone of the top boundary of the high-conductive layer in the upper mantle. The continuinguplift of the asthenosphere causes thinning and extension in the lithosphere,and the resulting tensional fault isa favorable energy channel through which the deep substances and heat are transmitted to the upper crust. Thesupercritical fluids in the deep part of the earth can extract metallic and non-metallic metallogenic elementsfrom the source of ores to form a metallogenic mixed solution with several components. Due to their strongerdissolubility,these fluids can effectively dissolve the metallogenic substances and easily react with the adjacentrocks,thus forming various types of structural fractures or secondary dissolved pores. This process improvesthe transmission conditions and plays an important role in the transfer of the metallogenic substances(Wang et al.,2005). Therefore,the uplift or upper gradient zone of the top boundary of the high-conductive layerin the upper mantle is an upwelling channel of mantle substances and is a favorable area for the formationof endogenous metallic ores. Moreover; these supercritical fluids play an important role in the transfer of themetallogenic substances. Further research of the morphology of the high-conductive layer in the upper mantlecan provide an important foundation for estimation of endogenous metallic ores.

|
Fig.14 The depth of high conductive layer in upper mantle and the distribution of endogenetic metallic ore and oil gas field in the continent of China |

|
Fig.15 Correlogram of the pattern of high conductive layer in upper mantle and endogenetic metallic ore distribution |
To determine whether a relationship exists between the distribution of the high-conductivity layer inthe upper mantle and known petroleum reservoirs,the petroleum fields and the basins containing petroleumreservoirs are superimposed on the depth map of the high-conductive layer in the upper mantle in China(Fig. 14). According to the results presented in Fig. 14 and Table 1,the major basins containing petroleumreservoirs in East China,such as Songliao,Bohai Bay,and Erlian basins,correspond to the uplift zones of thehigh-conductive layer in the upper mantle,and the petroleum fields are located mostly in the upper uplift orthe side in the intermediate belt. The main body of large basins in western China is located in the mantledepression areas. For example,the Tarim Basin and the major petroleum fields correspond to the gradientzones transitioned from a mantle depression area to a peripheral uplift. In central China,only the hinterl and of the basins containing petroleum reservoirs correspond to a mantle depression area; the peripheral area of thebasins corresponds to a larger uplift of the high-conductive layer in the upper mantle. For example,the majorpetroleum fields in the Ordos Basin are located at the uplift area of the high-conductive layer in the uppermantle. This feature is consistent with the fact that there are many warms basins in the east,many cold basinsin the west,and many intermediately warm basins in central China(Luo,1999).
The deep structure of the crust and its evolution control the formation of a basin,thus controlling theformation,transfer,and accumulation of petroleum reservoirs. The uplift of the asthenosphere causes stretching and thinning of the lithosphere,making the basement fracture and sink to form a basin. For example,theformation progress of the Songliao Basin is the result of the underthrust of the Kula-Pacific plate beneathEurasia. This movement created mantle uplift,which caused sinking and thinning of the crust followed by a lithospheric thinning,thus forming a large-scale faultdepression and downwarping basin and creating thestrong correlation of the overall depression of the basin and the mantle uplift(Fig. 16; Yun et al.,2003).The uplift of the asthenosphere was accompanied bya mantle diapir,making the lithosphere stretch and thin,thus forming a series of roughly parallel deep and large faults with mostly almost upright normalfaults. Due to the intensive faulting,it formed a highpermeability zone where the igneous magma,air,and liquid at the bottom can rise on a large scale and accumulate to form reservoirs in the favorable sections ofthe crust. Deep reflection seismic data revealed thata heat flow diapir may have appeared in the deep area of the Songliao Basin to enter the upper crust from theupper mantle(Yun et al.,2003). Fluids and gases such as carbon dioxide and hydrocarbons from the mantledirectly generated the natural gas pool and helped to multiply the endogenetic organisms in the basin,thusproviding temperature conditions favorable for the hydrocarbon evolution of biological organic substances(Li et al.,1996).

|
Fig.16 The image relationship between the uplift of high conductive layer in upper mantle and shallow basin |
Recent analysis of microelements of crude petroleum many oil fields revealed that the very high metallicmicroelements from the mantle fluids are not derived from sedimentary rocks(Teng et al.,2009; Dai et al.,1995).These elements include vanadium and nickel in the crude petroleum in the Tarim oilfield; lead,strontium,and neodymium in the bitumen in the Tarim oilfield; gold in the crude petroleum in the Shengli oilfield; lead,strontium,and neodymium in the crude petroleum in the Liaohe Oilfield; and uranium in the crude petroleumin the Daqing oilfield. The petroleum often contains or is associated with several kinds of gases or metallicelements possibly from the deep earth,which reveals that there is a certain association in the genesis mechanism.Currently this phenomenon has two interpretations: the petroleum or associated metallic elements may be fromthe deep mantle,and the petroleum is of inorganic origin. The inorganic origin has been supported by onsitegeological observation,synthesis in a chemical lab,and industrial production(Yuan and Li,2012). Theoreticalanalysis according to chemical thermodynamics revealed that the hydrogen-carbon system can generate ethane and heavier hydrocarbon only when the pressure is larger than 3×10⁶ kPa at a minimum depth of 100 km beneaththe surface and the temperature is higher than 700 °C. Evidence of hydrocarbon substances of nonbiologic originwas found in the Songliao and Tarim basins(Wang et al.,2009; Guo et al.,1998). However,a third theorystates that supercritical water from the deep area provides an abundance of hydrogen ions,making the fragmentsgenerated from the pyrogenic decomposition of the organic substances to immediately hydrogenize and becomestable. This process is particularly evident in hydrogen-deficient organic putrilage substances,in which theproductivity of the liquid hydrocarbons is enhanced. Moreover,the high heat energy carried by the heatedliquids from the deep area with strong dissolubility and diffusibility creates an increase in the geotemperatureof a basin,thus accelerating the thermal evolution of the hydrocarbon rocks and promoting the formation ofpetroleum(Wang et al.,2005).
In brief,the metallogenic environment of the petroleum field is also related to the deep dynamic environment and transfer of deep substances,making the formation location of the petroleum field correspond tothe distribution of the uplift of the asthenosphere or mantle diapir in space. The majority of the petroleumfields distributed in China are associated with active rifts,implying that the distribution of petroleum fieldsis internally related to the current movement of the crust(Peng and Guo,2001),which may be the surfaceexpression of such a relationship.
The distribution of either endogenous metallic ores or petroleum fields corresponds to the uplift zones ofthe asthenosphere; however,they are not overlapped in the spatial position. The former is distributed in the uplift zones of the upper mantle near the side of the orogenic zone,and the latter is distributed in the samezones near the side of the basin,forming an ore-containing-petroleum trend in space. The substances and heatfrom the deep earth form hydrothermal ore deposits in the orogenic zone near the basins containing petroleum;moreover,they produce hydrocarbon catalysts and petroleum and natural gas of inorganic origin in the basinscontaining petroleum. This hypothesis is based on the associated distribution of hydrothermal ore deposits and petroleum fields and their internal relationship(Guo,2001).
7 CONCLUSIONS(1)The depth of the top boundary of the high-conductive layer in the upper mantle in China exhibitszoning in north and south and partitioning in the east and the west. Generally,this layer in the eastern and northern regions is shallow,and in the western and southern regions is deep. The depth of the top boundaryof the high-conductive layer in the upper mantle varies widely,with the shallowest point of about 50~60 kmoccurring at the Songliao Basin in Northeast China,and the deepest point of 230 km occurring at ChangshaGuilin; and the average depth is about 100~120 km. Based on the distribution features,the high-conductivelayer in the upper mantle in mainl and China can be divided into 27 uplift zones.
(2)The distribution of endogenous metallic ores in mainl and China in the Mesozoic era is closely related tothe uplift-depression pattern of the high-conductive layer in the upper mantle. More than 80% of the endogenousmetallic ores are distributed in the uplift or upper gradient zone of the top boundary of the high-conductivelayer in the upper mantle.
(3)The distribution of the basins containing petroleum in mainl and China exhibits an obvious threepartition feature. The major basins containing petroleum reservoirs in East China correspond to the upliftzones of the high-conductive layer in the upper mantle,and the petroleum fields are mostly located at theupper uplift or on the side of the intermediate belt. The main body of the large basins in West China is locatedin the mantle depression areas,and the major petroleum fields correspond to the gradient zones transitionedfrom the mantle depression area to the peripheral uplift. In central China,only the hinterl and of the basinscorresponds to the mantle depression areas. The peripheral areas of the basins correspond to the larger uplift ofthe high-conductive layer in the upper mantle,where the major petroleum fields are located. The distributionof either the endogenous metallic ores or the petroleum fields has a spatial relationship with the uplift zonesof the upper mantle. The former are distributed in the uplift zones of the upper mantle near the side of theorogenic zone,and the latter distributed in the same zones near the side of the basin.
(4)The uplift zones of the upper mantle are favorable energy channels through which the deep substances and heat are transmitted to the upper crust,providing a stable environment for metallogenic substances and energy for formation of the endogenous metallic ores. These zones are thus favorable for producing hydrocarboncatalysts,energy,and petroleum and natural gas of inorganic origin in the basins containing petroleum. Thesupercritical fluids from the deep earth play an important role in the formation of the upper mantle layer and the transfer of the metallogenic substances.
(5)Full use of the existing geophysical data,further development of regional three-dimensional MT sounding,and determination of the development status of the high-conductive layer in the upper mantle with morespatial details may provide significant references for exploration of metallic ores and petroleum reservoirs.
ACKNOWLEDGMENTSWe are grateful to Yuan Xuecheng at the Development and Research Center,China Geological Survey foroffering many valued opinions and suggestions. We also thank the reviewers for their valuable suggestions onthe modification of the manuscript. This work was jointly supported by the National Program of Deep probing and Experiments(Sino-Probe-01-04),Project of China Geological Survey(121201110971),and Special Project of Ministry of National L and s and Resources(200811039).
| [1] | Щeглoв A д. 1990. Éндогенная Meталлогения И Tектоносфера. Гeoтектоика, (5): 9-16. |
| [2] | ВАНБЯН Л Л. 2001. Electromagnetic Sounding. Beijing: Oceanography Publishing House. |
| [3] | Ádám A. 1978. Geothermal effects in the formation of electrically conducting zones and temperature distribution in the Earth. Phys. Earth Plan. Int., 17(2): 21-28. |
| [4] | Chen L, Zhu R X, Wang T. 2007. Progress in continental lithosphere studies. Earth Science Frontiers, 14(2): 58-75. |
| [5] | Dai J X, Song Y, Dai C S, et al. 1995. Inorganic Gas and Its Reservoir Forming Conditions in Eastern China (in Chinese). Beijing: Science Press. |
| [6] | Deng Q H, Liu G D, Liu J H, et al. 1990. The observation of magnetotelluric and electrical characteristics of the crustupper mantle along Hubei Xiangfan-Fujian Luoyuan profile. Seismology and Geology (in Chinese), 12(2): 149-158. |
| [7] | Deng Q H, Wang J J, Tang J, et al. 2001. Electrical structures of the crust and upper mantle in Sanhe-Pinggu M8 earthquake area, China. Seismology and Geology (in Chinese), 23(2): 178-186. |
| [8] | Deng J F, Teng JW, Peng C, et al. 2008. The Geophysical Field Character and Deep Geological Prospecting (in Chinese). Beijing: Geological Publishing House, 59-62 |
| [9] | Feng C G, Liu SW, Wang L S, et al. 2009. Present-day geothermal regime in Tarim basin, northwest China. Chinese J. Geophys. (in Chinese), 52(11): 2752-2762. |
| [10] | Ge L S, Deng J, Guo X D, et al. 2009. Deep-seated structure and metallogenic dynamics of the Ailaoshan polymetallic mineralization concentration area, Yunnan province, China. Science in China (Series D): Earth Sciences (in Chinese), 52(10): 1624-1640. |
| [11] | Guo W K, Liu M G. 1989. The Map of Endogenous Mineral Ore in China. Beijing: Geological Publishing House. |
| [12] | Guo Z Q. 2001. Minerallied hydrothermal liquid and petroleum generation. Xinjiang Petroluem Geology, 22(3): 181-184. |
| [13] | Guo Z Q, Feng Z H, Wang P Z. 1998. Coexisting elements and geochemical characteristics in crude oil of Tarim basin. Petroleum Explorationist, 3(1): 34-36. |
| [14] | Jiang Z, Sun H, Xu C F, et al. 1990. Jiangsu Xiangshui-Electrical structure of crust and upper mantle Inner Mongolia Kathmandu. Seismology and Geology (in Chinese), 12(3): 193-199, 206. |
| [15] | Jin Z M, Bai W M. 1993. Dynamical partial melting and its geophysical significances. Geological Science and Technology Information (in Chinese), 12(1): 93-100. |
| [16] | Jin S, Ye G F, Wei W B, et al. 2006. The electrical structure and fault feature of crust of south-eastern Tibetan plateau: the result of magnetotelluric prospecting on profile from Xiachayu-Changdu. Earth Science Frontiers (in Chinese), 13(5): 408-415. |
| [17] | Jin S, Wei W B, Ye G F, et al. 2009. The electrical structure of Bangong-Nujiang suture: results from magnetotelluric sounding detection. Chinese J. Geophys.(in Chinese), 52(10): 2666-2675. |
| [18] | Jin S, Wei W B, Wang S, et al. 2010. Discussion of the formation and dynamic signification of the high conductive layer in Tibetan crust. Chinese J. Geophys. (in Chinese), 53(10): 2376-2385. |
| [19] | Kong X R, Wang Q S, Xiong Z B. 1996. Integrated geophysical and lithosphere structure research in the western Tibet. Science in China (Series D) (in Chinese), 26(4): 308-315. |
| [20] | Li L, Jin G Y. 1987. Telluric electromagnetic sounding study of crust and upper mantle in the Panxi "rift zone" and the Longmenshan faulted zone. Geophysical and Geochemical Exploration (in Chinese), 11(3): 161-169. |
| [21] | Li L. 1996. The geoelectrical characteristic of crust and upper mantle in the continental region of China. Acta Geophysica Sinica (in Chinese), 39(S1): 130-140. |
| [22] | Li L, Yang P Y, Duan B, et al. 1998a. The lithospheric geoelectric model of east Qinling. Acta Geophysica Sinica (in Chinese), 41(2): 189-196. |
| [23] | Li L, Jin G Y, Liu Y H, et al. 1998b. The contrast of lithospheric electrical structure between east and west Qinling orogen. The Abstracts of Chinese Learned Periodical (Bulletin of Science and Technology) (in Chinese), 4(7): 840-844. |
| [24] | Li L, Jin G Y, Yang P Y, et al. 1999. Geoelectrical structure of the crust and upper mantle in the Qinling and adjacent regions. Continental Dynamics, 4(1): 70-77. |
| [25] | Li Y J, Zhang X L, Chen Y C. 1996. Continental Layer Controlled Tectonics Introduction. Beijing: Geological Publishing House. 82-95. |
| [26] | Liu H B, Kong X R, Ma X B, et al. 2001. The physical property and structure characteristics of the Southeastern of the Qinghai-Tibet plateau crust. Science in China (Series D) (in Chinese), 31(Suppl.): 61-65. |
| [27] | Liu M, Cui X J, Liu F T. 2004. Cenozoic rifting and volcanism in eastern China: a mantle dynamic link to the Indo-Asian collision?. Tectonophysics, 393(1-4): 29-42. |
| [28] | Liu G X, Zhang X Z, Yang B J, et al. 2006a. Electrical structures of the lithosphere along the Jiamusi massif and its eastern edge. Chinese J. Geophys.(in Chinese), 49(2): 598-603. |
| [29] | Liu G X, Zhang Z H, Han J T, et al. 2006b. Features of the electric structure of the lithosphere beneath the Hinggan-Inner Mongolia and Jilin-Heilongjiang regions. Geology in China (in Chinese), 33(4): 824-831. |
| [30] | Liu C, Zhang X Z, Liu Y, et al. 2009. Geoelectrical evidence for characteristics of lithospheric structure beneath the Yuejinshan collage zone and its vicinity in Northeast Asia. Chinese J. Geophys.(in Chinese), 52(4): 958-965. |
| [31] | Lu Z X, Jiang D L, Bai Y, et al. 2005. Exploration and research on the structure of the crust and upper mantle in northeast China. Seismological Research of Northeast China (in Chinese), 21(1): 1-8. |
| [32] | Lu F X. 1989. The Mantle Petrological (in Chinese). Wuhan: China University of Geosciences Press, 28-29. |
| [33] | Luo Z L. 1999. Discussion on the uniqueness of the petroleum geological conditions in China. Petroleum Explorationist, 4(2): 1-7. |
| [34] | Ma X B, Kong X R. 2001. The thermal status of Qinghai-Tibet plateau and the differences between the western and the eastern plateau. Progress in Geophysics (in Chinese), 16(3): 12-20. |
| [35] | Ma X B, Kong X R, Liu H B, et al. 2005. The electrical structure of northeastern Qinghai-Tibet plateau. Chinese J. Geophys. (in Chinese), 48(3): 689-697. |
| [36] | Niu X, Lu Z X. 1998. Deep and shallow tectonic features of Luyang-Lishu geoscience transect and relation between them and seismic activity. Seismological Research of Northeast China (in Chinese), 14(2): 67-74. |
| [37] | Peng W, Guo Z Q. 2001. On crustal movement and its relation to distribution of oil and gas field. Xinjiang Petroluem Geology, 22(6): 527-529. |
| [38] | Peng W, Huang X G, Bai W M. 2012. The role of water and melt on the low-velocity and high-conductivity zones in the upper mantle. Progress in Geophys. (in Chinese), 27(5): 1970-1980, doi: 10.6038/j.issn.1004-2903.2012.05.018. |
| [39] | Shan J Z, Zhong J Q, Wang Z Z. 1987. Simulation experiment research of the formation and evolution of the ancient continental rift of western Panzhihua. //China Panxi Rift Collected Works II (in Chinese). Beijing: Geological Publishing House, 165-175. |
| [40] | Shi S L, Xu C F, Wang J J, et al. 1991. Study on electric conductivity of the deep earth along the Yixian, Liaoning, to Dong-ujimqin, Neimongol from profile. Seismology and Geology (in Chinese), 13(2): 115-125. |
| [41] | Sun J, Jin W G, Bai D H, et al. 2003. Sounding of electrical structure of the crust and upper mantle along the eastern border of Qinghai-Tibet Plateau and its tectonic significance. Science in China (Series D): Earth Science, 46(2): 243-253. |
| [42] | Tan H D, Wei W B, Unsworth M, et al. 2004. Crustal electrical conductivity structure beneath the Yarlung Zangbojiang suture in the southern Xizang plateau. Chinese Journal of Geophysics (in Chinese), 47(4): 686-690, doi: 10.3321/j.issn:0001-5733.2004.04.020. |
| [43] | Tang J, Zhang Y, Zhao G Z, et al. 2005. Electrical conductivity structure of the crust and upper mantle in the northeastern margin of the Qinghai-Tibet plateau along the profile Maqên-Lanzhou-Jingbian. Chinese J. Geophys. (in Chinese), 48(5): 1205-1216, doi: 10.3321/j.issn:0001-5733.2005.05.032. |
| [44] | Teng J W, Ruan X M, Zhang Y Q, et al. 2009. Theoretical concept for sedimentary basin, crystalline basement and the origin of oil and gas and its exploration and exploitation in the second deep space. Chinese J. Geophys. (in Chinese), 52(11): 2798-2817, doi: 10.3969/j.issn.0001-5733.2009.11.015. |
| [45] | Teng J W, Song P H, Mao H H. 2014. The orientation and problems of contemporary intra-continental physics and dynamics. Geology in China, 41(3): 675-697. |
| [46] | Wan T F. 2012. Formation, evolution and characteristics of China continental lithosphere. Chinese Journal of Nature, 34(4): 196-200. |
| [47] | Wang C Y, Du J G, Liu W, et al. 2005. Geological applications of supercritical fluids. Northwestern Geology, 2005, 38(2): 49-53. |
| [48] | Wang J, Wang J A, Shen J Y, et al. 1995. Heat flow in Tarim basin. Earth Science-Journal of China University of Geosciences, 20(4): 314. |
| [49] | Wang X, Zhan Y, Zhao G Z, et al. 2010. Deep electric structure beneath the northern section of the western margin of the Ordos basin. Chinese J. Geophys. (in Chinese), 53(3): 595-604, doi: 10.3969/j.issn.0001-5733.2010.03.013. |
| [50] | Wang X B, Guo Z Q, Tuo J C, et al. 2009. Abiogenic hydrocarbons in commercial gases from the Songliao Basin, China. Science in China (Series D): Earth Science, 52(2): 213-226, doi: 10.1007/s11430-009-0015-1. |
| [51] | Wei R Q, Li W Y. 2015. Thermal-rheological bottom boundary of continental lithosphere: case studies on cratons of Kaapvaal, Fennoscandia, and Slave. Journal of University of Chinese Academy of Sciences, 32(1): 73-81. |
| [52] | Wei W B, Jin S, Ye G F, et al. 2006a. Conductivity structure of crust and upper mantle beneath the northern Tibetan Plateau: Results of super-wide band magnetotelluric sounding. Chinese J. Geophys. (in Chinese), 49(4): 1215-1225, doi: 10.3321/j.issn:0001-5733.2006.04.038. |
| [53] | Wei W B, Jin S, Ye G F, et al. 2006b. MT sounding and lithosphere thickness in North China. Geology in China, 33(4): 762-772. |
| [54] | Wei W B, Ye G F, Jin S, et al. 2008. Geoelectric structure of lithosphere beneath eastern North China: features of a thinned lithosphere from magnetotelluric soundings. Earth Science Frontiers, 15(4): 204-216. |
| [55] | Wei W B, Jin S, Ye G F, et al. 2010. The conductivity structure and rheological property of lithosphere in the southern Tibet inferred from supper-broadband magmetotulleric sounding. Science in China (Series D): Earth Science, 53(2): 189-202, doi: 10.1007/s11430-010-0001-7. |
| [56] | Xing J S, Yao D Q, Li M. 1989. The structural characteristics of Shanxi Graben system from geophysical data. Shanxi Geological (in Chinese), 4(2): 95-109. |
| [57] | Xu C F. 1996. The electrical structure of crust upper mantle and the rules of earthquake distribution in the continent of China. Acta Seismologica Sinica (in Chinese), 18(2): 254-261. |
| [58] | Xu Z W, Ren Q J, Xu W Y, et al. 1996. Relationship between deep structure and distribution of mineral deposits in Qinling region. Science in China (Series D), 39(S1): 17-23. |
| [59] | Yang W C, Xu J R, Cheng Z Y. 2005. The Geophysical and Crust-Mantle Action of Dabie-Sulu Orogenic belt. Beijing: Geological Publishing House. |
| [60] | Ye G F, Wei W B, Jin S, et al. 2009. Study of the electrical structure and its geological meanings of the middle part of Tancheng-Lujiang fault zone. Chinese J. Geophys. (in Chinese), 52(11): 2818-2825. |
| [61] | Yu P, Wu J S, Wang J L, et al. 2008. Using long period magnetotelluric profile of Fengcheng of Shanghai-Huzhou of Zhejiang province to study deep electrical structure. Chinese J. Geophys. (in Chinese), 51(2): 503-510. |
| [62] | Yuan X C, Li S F. 2012. The abiogenetic petroleum origin hypothesis and its application in China. Geology in China (in Chinese), 39(4): 843-854. |
| [63] | Yun J B, Yin J Y, Jin Z J. 2003. Deep geological feature and dynamic evolution of the Songliao basin. Seismology and Geology, 25(4):595-608. |
| [64] | Zhan Y, Zhao G Z, Wang J J, et al. 2008. Deep electric structure beneath the epicentre of the 1927 Gulang M8 earthquake and its adjacent areas from magnetotelluric sounding. Chinese J. Geophys. (in Chinese), 51(2): 511-520, doi: 10.3321/j.issn:0001-5733.2008.02.023. |
| [65] | Zhan Y, Zhao G Z, Chen X B, et al. 2004. Crustal structure from magnetotelluric profiling in the Haiyuan earthquake area, Ningxia hui autonomous region, China. Chinese J. Geophys.(in Chinese), 47(2): 274-281. |
| [66] | Zhan Y, Zhao G Z, Tang J, et al. 2000. Electric structure of the crust of the mains earthquake area in Xinjiang autonomous region. Seismology and Geology, 21(2): 159-167. |
| [67] | Zhang H R, Jiang H. 1988. The rift structure of Panzhihua-Xichang belt and its control action of endogenous mineral ore. //China Panxi Rift Collected Works III (in Chinese). Beijing: Geological Publishing House: 128-139. |
| [68] | Zhang S Y, Wei S, Wang J Y, et al. 1996. Magnetotelluric sounding in the Qiangtang basin of Xizang (Tibet). Earth Science-Journal of China University of Geosciences (in Chinese), 21(2): 198-202. |
| [69] | Zhang S Q, Li C H, Sun W Y, et al. 2008. Construction of the conceptual model of thermal reservoir structure of the Xining basin. Geological Bulletin of China (in Chinese), 27(1): 126-136. |
| [70] | Zhang J H, Zhao G Z, Xiao Q B, et al. 2010. Analysis of electric structure of the central Tan-Lu fault zone (Yi-Shu fault zone, 36°N) and seismogenic condition. Chinese J. Geophys. (in Chinese), 53(3): 605-611, doi: 10.3969/j.issn.0001- 5733.2010.03.014. |
| [71] | Zhao G Z, Tang J, Zhang Y, et al. 2004. The relationship between crust electrical structure and block deformation in the northeast Tibet. Science in China (Series D) (in Chinese), 34(10): 908-918. |
| [72] | Zhao G Z, Chen X B, Wang L F, et al. 2008. Electromagnetic detection evidence of "pipe flow layer" in the edge of the Qinghai-Tibet plateau. Chinese Science Bulletin (in Chinese), 53(3):345-350. |
| [73] | Zhao G Z, Chen X B, Xiao Q B, et al. 2009. Generation mechanism of Wenchuan strong earthquake of MS8.0 inferred from EM measurements in three levers. Chinese J. Geophys. (in Chinese), 52(2): 553-563. |
| [74] | Zhao G Z, Liu T S, Jiang Z, et al. 1997. Investigation on MT data along Yanggao Rongcheng profile by two-dimensional inversion. Chinese J. Geophys. (in Chinese), 40(1): 38-46. |
| [75] | Zhao G Z, Jiang Z, Liu G D, et al. 1999. Seismic activity area in northern north China of 2D inversion and interpretation of MT data. Geophysical (in Chinese), 20: 69-79. |
| [76] | Zhu J S, Cai X L, Cao J M, et al. 2005. China South and East Sea Areas of China Lithosphere 3D Structure and Evolution (in Chinese). Beijing: Geological Publishing House, 87-112. |
| [77] | Пархоменко Э И. 1989. Геоэлектрические ссойства минералов и гориых вьсокихдавленнях и ттмпературах. Moskвa: Нaукк, 86-103. |