 2015, Vol. 58


One of the important challenges associated with tropical cyclone(TC)forecasting is the rapid change in structure and intensity. This is also a more concerned research field in TC dynamics. The influence factors of structure and intensity change in TCs can be classified into two categories: external large scale environmental force factor and TC internal disturbance changes(Wang and Wu, 2004). Previous studies show that largescale environmental factors, such as vertical wind shear(Bender, 1997; Holland and Wang, 1999), sea surface temperature(SST) and air-sea interaction(Duan et al., 1998), and boundary layer(Chen and Ding, 1979; Bender et al., 1993)play important roles in rapid change of structure and intensity.
Recent advances in TC dynamics have deepened the underst and ing of many internal dynamical processes, such as wave characteristics associated with the asymmetric structures in the inner-core regions(Montgomery and Kallenbach, 1997; Zhong et al., 2009), polygonal eyewalls(Schubert et al., 1999; Montgomery et al., 2002), and eyewall replacement cycles(ERCs)(Houze et al., 2007; Terwey and Montgomery, 2008). Although observational studies similarly show that these internal processes are closely related to the rapid intensity changes of TC(Montgomery et al. 2006a; Aberson et al. 2006), the dynamical mechanism of the influence on TCs structure and intensity change still remains elusive due to the lack of comprehensive underst and ing on these processes(Wang and Wu 2003).
The latest observational and simulated studies have revealed that high-value Potential Vorticity(PV) exists in the TCs inner core. The high-value PV occurs in the eye or inside of eyewall in terms of horizontal distribution, and is characterized by high-value PV columnar structure in the vertical direction. Thus, the spatial structure of the PV field can be expected to be a tower of high PV, referred to as PV Tower(PVT) (Schubert W H, et al, 1987; Möller J D, et al, 1994). The radial profile of PV mainly has two types of basic characteristics: ① positive high PV values occur in the eye and monotonically decrease with radius from the eye center, which means that radial PV distribution has a monopole characteristic, referred to as Monopole PV Tower(MPVT); ② the PV field can be viewed as an annular tower of high PV with low PV in the eye, and the sign reversal of the radial gradient of PV exists, resulting in a hollow tower structure in TCs, referred to as hollow PV tower(HPVT).
The difference of radial PV distribution is thought to be an important factor governing the dynamic stability of TC-like vortex. Nolan and Montgomery(2001)report that the algebraically growing instability occurs for any vortex that possesses a basic-flow absolute vorticity maximum other than at the center axis. Zhong et al.(2010)research the barotropic stability of vortex Rossby waves(VRWs)in 2D inviscid TC-like vortices, and discovered one of the necessary conditions for VRW barotropic instability that there must be at least one zero point of basic vorticity gradient in the radial scope except the eye. In addition, Zhong et al. (2009)show that it appears easily to form mixed vortex Rossby-inertial-gravity waves(VRIGWs)exhibiting the characteristics of both inertial-gravity waves(IGWs) and votex-Rossby waves(VRWs), and lead to instability of the mixed-wave when large wavenumber, large Rossby number(R0), and intense radial secondary shear of environmental wind exist in TC-like vortex. Thus, the instability in TC-like vortices is closely related to the difference of radial PV distribution. The influence of PV mixing and transport on dynamic stability in TC-like vortices of two types of PVT structure(i.e. MPVT and HPVT, respectively)are explored in a nondivergent barotropic model by Hendrick and Schubert(2008). Moreover, Hendrick et al.(2008, 2010) examine the complete lifecycles of different HPVT in a nondivergent barotropic model framework. Azimuthal mean diagnostics are presented showing the evolution of the radial pressure and tangential wind profiles for each ring to assess the relationship between PV mixing events and hurricane intensity change.
At present the studies that explore the influences of MPVT and HPVT on the intensity change and dynamic instability of TCs are mostly based on the theoretical simulations. Therefore, it is the intention of this study to further underst and the role of PVT in real TCs intensity change, using a high-resolution simulation of Hurricane Wilma(2005)by Chen et al.(2011), the storm that demonstrated record-breaking rapid intensification(RI). The objectives of this paper are to examine(i)PV intensity change based on the subsidence of the upper-level warm-core, the mid-level latent heat release and the low-level dynamic instability coinciding with the intensity change of Wilma;(ii)the evolution of PVT structure and its role in the rapid intensification of TCs; and (iii) how different PVT structures affect the instability of TCs through quantitative analysis. The next section presents model-predicted Wilma’s intensity and structure changes, and analyzes PV intensity change in relation to the intensity changes of Wilma under the action of the subsidence of the upper-level warm-core, the midlevel latent heating, and the low-level dynamic instability. Section 3 diagnoses the PVT characteristics in the different development stages of Wilma(2005), and shows that the distributions of PVT are well consistent with the intensity and structure changes of the hurricane. Section 4 quantitatively analyzes HPVT structure change in Wilma’s rapid intensification(RI)period with the structural parameters of HPVT, which can reflect the influence of PVT on instability of TC-like vortices, and then explores the role of establishment and breakdown of HPVT in governing rapid intensity change of TC. A summary and some concluding remarks are given in the final section.
2 THE INTENSITY AND STRUCTURE CHANGE OF HURRICANE WILMA(2005)Hurricane Wilma(2005)was the most powerful hurricane over the Atlantic basin since records began, with strong wind, cloudburst and storm surge which brought severe casualty and economic losses in Mexico and America. Using the Weather Research and Forecasting model(WRF), Chen et al.(2011)designed a twoway interactive, movable, quadruply nested(27/9/3/1 km)grid that was initialized at 0000 UTC 18 October 2005(hereafter 18/00-0) and integrated for 72 h(18/00-0–21/00-72), with the finest grid resolution of 1 km at 5-min intervals. Comparing with the observations(Chen et al., 2011), this simulation can reproduce main characteristics of the Hurricane Wilma reasonably well in the process of development: record-breaking RI, maximum intensity and small eye size, rapid contraction of eyewall and eyewall replacement cycle(ERC) process.
According to time series of the minimum sea level pressure(Pmin) and the maximum surface wind(Umax) (Fig. 1a), the simulation period is expected to be divided into three stages with reference to Chen et al.(2011), covering an initial 15 h spin up(referred to as pre-RI)from 18/00-0 to 18/15-15, a 21 h RI stage from 18/15-15 to 19/12-36, and a 36-h weakening(referred to as post-RI)stage from 19/12-36 to 21/00-72.

|
Fig.1 Time series of the simulated (a) Pmin (solid,hPa) and Umax (dashed,m·s-1),(b) the variation of Pmin (solid, hPa·h-1) and Umax (dashed,m·s-1·h-1) in one hour,(c) Time-height cross section of area-averaged PV anomaly (shaded,PVU) and diabatic heating rate (black solid line,interval=5 K·h-1) in a subdomain of 60 km×60 km, and temperature anomaly (black solid line,interval=2 K) superposed with potential temperature (gray dashed line,interval=10 K) at the eye center |
Figures 1(a, b)show the time series of the predicted hurricane intensity in terms of Pmin and Umax, and their variations in one hour. During the pre-RI period except the initial 6 hours spin-up time, the average rate of change in Pmin is less than 4 hPa·h-1, while the change rates in Umax are characterized by the alternatively positive and negative variations though the change rates in Umax are large at individual times. This result indicates that the hurricane keeps steady intensification during the pre-RI period. The changes of Pmin and U max are increased obviously as entering the RI period, corresponding to the mean RI rate of 3.44 hPa·h-1 (1.0 m·s-1·h-1) and the peak hourly RI rate is 6.48 hPa·h-1(6.12 m·s-1·h-1), which indicates that the model reproduces reasonably well RI process. Moreover, this RI period can be further divided into two stages based on the changes of Pmin and Umax. One is from 18/15-15 to 19/03-27, during which an explosive deepening episode for Wilma and the mean change rate of Pmin and Umax are 4.58 hPa·h-1 and more than 1.85 m·s-1·h-1, respectively. The other is from 19/03-27 to 19/12-36, and the mean change rate of Pmin and Umax are only 1.93 hPa·h-1 and 0.12 m·s-1·h-1, respectively. Compared with the former period, the TC hurrican intensifies at a rate much slower, indicating that Wilma makes the transition to weakening stage.
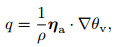
PV is a useful concept since it is conserved by parcels in the flow. If, in addition, the flow is in quasigeostrophic balance, the height and velocity fields can be uniquely determined from the PV. Thus, it is helpful to underst and many aspects of inner core dynamics of TCs(e. g., Wang 2002a, b). Ertel’s PV can be defined as
To discuss the evolution of PV and its related variables in hurricane intensity change process, considering Wilma’s scale feature, Fig. 1c shows that time-height cross section of area-averaged PV anomaly and diabatic heating rate in a subdomain of 60 km×60 km, and temperature anomaly superposed with potential temperature θ at the eye center. The difference between the PV(temperature)in current time and area-averaged PV (temperature)at the model initial time is defined as PV(temperature)anomaly. The evolution of area-averaged PV anomaly shows that large positive PV anomaly centers are mainly concentrated in three levels, one locates in the upper troposphere(i.e.at z=16 km), another extends upward from 5 km to 12 km in the midtroposphere, the other locates in the lower stratosphere near z=3 km. At the model initial time, the positive PV anomaly takes place near z=16 km along with the θ = 370~400 K layer starting descending and subsidence of the upper-level warm core, and did not disappear until reaching the TC maximum intensity at 36 hours into integration. Note that downward slope of θ isolines becomes steep and the upper-level warm core begins to split in two at the onset of RI, the two centers locate in 16 km above and 13 km respectively. During the 21 hours RI period, positive PV anomaly begins to weaken in response to the decrease of vertical gradients of θ in upper layer. Upper-level θ isolines tend to be straight and temperature gradient is nearly constant after reaching the peak intensity, while positive PV anomaly disappears. The vertical structure of warm core changing over time is examined by Chen and Zhang(2013), and they found that the θ = 370~400 K layer descending and the subsidence of lower stratospheric air play important roles in the intensification of the upper-level warming core. Furthermore, the intensification and subsidence of upper-level warm core contribute to the increase of upper-level area-averaged PV in the inner region. The changes of PV anomaly at middle or lower levels are closely associated with the latent heating. Because of the earlier release of mid-level latent heat triggered by convection, mid-level PV anomaly occurs one hour ahead of low-level PV anomaly. Then, the increase of diabatic heating rate and the subsidence of the upper-level warm core make significant contributions to rapid intensification of mid-level PV anomaly. Once entering the RI stage, the mid-level diabatic heating rate rapidly increases from 10 K/h, until reaching the peak at 27 hours of integration, corresponding to a sharp increase of mid-level PV anomaly. The mid-level PV anomaly is over 21 PVU. Subsequently, the growth rate of mid-level PV anomaly begins to decrease with diabatic heating rate, although the mid-level PV anomaly is still on the increase, reaching its peak of more than 24 PVU at 36 hours of integration. The above mentioned results reveal that the mid-level PV anomaly and latent heat release are closely related. The intensity and vertical extension height of mid-level PV anomaly were significantly weakened, while Wilma begins to enter the weakening stage, corresponding to the rise in Pmin, although the changes of lower-level PV are smaller than those of mid-level PV during the RI period, it is well consistent with Wilma’s intensity change. However, in contrast to the mid-level PV anomaly rapid decrease at post-RI stage, the intensity of lower-level PV anomaly is more stable which did not intensify again until 70 hours into integration. The strong diabatic heating existing in lower levels indicates that the change of the low-level PV has a cetain relation to diabatic heating. Moreover, the eye inversion resulting from strong hydrostatic stability and PV mixing events from dynamic instability of a hurricane-like PV hollow tower play significant roles in the change of the lower-level PV(Hendricks and Schubert, 2010).
It has been realized that the structure and intensity changes are closely associated with the structure of lower-level PV in internal dynamical processes. In order to further discuss this phenomenon, Fig. 2 shows the radius-time cross section of tangential mean PV and radar reflectivity(at z=3 km)during the development period of 6 hours–72 hours into integration except for the initial 6 hours of model adjustment. At the pre-RI stage, convection is poor and scattered inside Wilma. The radial distribution of lower-level PV is approximately monotonic with radius from the eye center. At the onset of Wilma’s RI, PV in that area significantly increases and its radial structure becomes hollow, namely the large PV center shifts out of the eye, meanwhile the radial gradients of PV between the large PV center and the eye become stronger. In addition, the eyewall and spiral rainb and s have formed by organized cumulus convection after 13 hours of integration, while secondary PV maxima are also formed inside the strongest echo region and rapidly contracts with eyewall contraction from 20 km to 10 km. The two PV maxima begin to merge near 24 hours of integration. At 31 hours of integration, the PV intensity and its radial gradients reach the peak. The model results indicate that the radial structure of PV transforms from monopole to hollow structure. Previous theoretical studies have found that the radial profile of tangential mean PV which is characterized by hollow structure is viewed as a necessary condition for dynamic instability in vorticity(Nolan et al., 2001; Zhong et al., 2010). Thus, the buildup and development of hollow structure for the PV radial distribution in the lower levels correspond to the explosive deepening(RI)episode when Pmin and Umax change at a much faster rate(cf. Figs. 1a and 1b). After 32 hours of integration, the PV maximum point again moves inward, and there is a decreasing tendency for PV gradients with the increase of PV in the eye. Later, the intensification speed of Wilma becomes slower, reaching its peak intensity at 36 hours of integration. The distribution of model-predicted radar reflectivity(at z=3 km)shows a secondary eyewall is formed near the radius of 30 km at 21 hours of integration, and this eyewall begins to contract at a rate much faster than the inner eyewall shortly after. Because of the different contracting rates, the two eyewalls merge into a wider eyewall at the radius of 15 km at 27 hours of integration, referred to as Eyewall Merging Process(Chen, 2011). The formation of secondary eyewall can cause local latent heat release thus affect PV intensity. However, on the one h and , this effect on the radial distribution of the azimuthal mean PV can be neglected. On the other h and , PV radial mixing in lower levels is enhanced by rapid contraction of the eyewall, which is in favor of the establishment of hollow structure.

|
Fig.2 Axisymmetric PV (solid, interval=10 PVU) as a function of time and radial distance, superimposed with the radar reflectivity (shaded, dBZ), at 3 km height from the 36-h model integration between 0000 UTC 18 and 1200 UTC 19 Octorber. Dashed lines denote the location of radial top and second maximum PV |
Thus, the above-mentioned results confirm that the intensity and structure change of PV in the inner core region depends mainly on the subsidence of the upper-level warm-core, the mid-level latent heat release, and the low-level dynamic instability. In particular, the distribution of the lower-level PV and its instability show a close relation to the speed of intensity change in RI process.
3 THE STRUCTURE AND EVOLUTION OF PVTPV describing simultaneously divergent and rotational motion, is a quantity useful for underst and ing many aspects of inner core dynamics of Hurricanes. As pointed out by Macdonald(1968), PV is a leading factor that contributes to the formation and propagation of waves in Hurricanes. In addition, Nolan and Montgomery (2001)propose that the PV structure is closely associated with instability hurricane-like vortex. As a result, the study that investigates the characteristics of PV structure can reveal the evolution of deep convection and the intensity change of hurricanes.
To clearly reflect the vertical structure characteristics of PV, Fig. 3 shows vertical cross section of axisymmetric PV at a few selected times during the pre-RI and RI periods. At the pre-RI stage(see Fig. 3a), radial flow and vertical motion are relatively weak. Meanwhile, two preferred peak PV elements appear in the vertical direction: one is located at the eye region in the lower and middle tropospheres, which forms the structure of monopole PVT from the surface extending upward to the height of 6 km; the other is located in the eye above 15 km, which is transported outward by gravity waves in the upper outflow layer. From the whole of the PV structure, the large PV in the lower and upper troposphere monotonically decrease radially outward from the eye, presenting typical character of MPVT. Note also that the large PV region exhibits tilt outward in the midtroposphere and then the PV values within the radius of 10~20 km are larger than that in the eye at z=7 km, which marks the formation of hollow PVT. There are two reasons that account for this result: one is that the large PV at lower levels are upward transported by the slantwise upward motion near the radius of 10 km; the other is latent heat release from the intense upward motion area in the mid-troposphere.

|
Fig.3 Vertical cross section of axisymmetric PV (shaded, PVU) , potential temperature (solid, interval=20 K), diabatic heating rate (dashed, interval=20 K·h-1), and wind vectors (m·s-1) at (a) 15 hours, (b) 21 hours, (c) 29 hours and (d) 36 hours corresponding to model integration time. The values of vertical velocity all multiplied by 10 |
After entering the RI stage, the distribution of PV remains at a monotonic state in the upper troposphere and the large PV values increase to above 80 PVU with the subsidence of upper warming in the eye. Although θ isolines tend to cave in the eye in the mid-troposphere, the PV values in the eye appear to increase unobviously less than 50 PVU. Nevertheless, the diabatic heating rates are more than 60 K/h inside the intense upward motion area at z=7 km, causing the isoline of diabatic heating rate become dense in the mid-troposphere. Simultaneously, the large PV center of more than 90 PVU occurs inside the intense upward motion area. These indicate that with the organization of convection and the formation of eyewall, latent heat release induces sharp warming in the eyewall in the mid-troposphere, and then the strong gradients of diabatic heating rate on the inner edge of the eyewall. These diabatic effects constantly result in the rapid increase of local PV in the mid-troposphere and produce a hollow tower, which shall be referred to as a hollow PVT(HPVT). Under the effect of diabatic heating gradients, the large PV values region occurs similarly inside the lower-level upward motion area. As the large PV values region breaks in the eye, it is shown that the low-level HPVT build up and the instability grows in the hurricane. Despite the upper warming core being continually strengthened, the PV intensity in the eye remains constant until 29 hours into integration(see Fig. 3c). When the peak vertical velocity increases to 6 m·s-1 near the radius of 15 km, the diabatic heating center associated with latent heat release start to appear, vertically stretching to z=12 km from z=3 km. The upright column structure of large PV is established at the radius of 10 km. This HPVT has the following several characteristics, as compared to the former period HPVT:(1)the mainly sinking motion in the large PV columns leads to the transportation of large PV from the mid-levels to the lower-levels, which contributes to increase PV inside the radius of maximum wind(RMW) and build up the HPVT in lower levels;(2)the reinforcement of low-level radial inflow and the convergence occurring on each side of large PV region strengthen horizontal PV transportation into the inside of RMW, which is helpful for the maintain and development of HPVT;(3)the two hollow columns of high PV become narrower and strong PV gradients in hurricanes are found, which indicates that the instability tends to enhance, causing the explosive deepening of Wilma.
The diabatic heating rate increases to above 120 K/h with the continuous development of convection in the eyewall at 36 hours of integration, when the hurricane reaches the peak intensity and its isolines are denser at the radius of 15 km in the intense upward motion area(see Fig. 3d). In addition, the vertical distribution of both diabatic heating rate and high PV values in the columnar region tend to be uniform under vertical mixing in intense convection. Due to the increase of radial velocity on both sides of high PV column, the large PV fluids are mixed into the eye, making the radial width of high PV annular ring become wider than that during explosive deepening period. Moreover, the PV maximum at z=3 km extended farther into the eye, creating a bridge-like structure similar to that found by Yau et al.(2004). This result demonstrates that PV mixing between the eyewall and eye at lower levels is the most obvious as a result of dynamic instability in the hurricane, which is consistent with the findings of Hendricks et al.(2010). In response to the enhanced radial PV mixing, the PV in the eye increase to more than 60 PVU. It indicates that hollow tower breaks down, that is, the HPVT begins to transform into the MPVT, and the vortex tends to be stable.
The vertical distribution of azimuthal mean PV shows that the HPVT structure occurs preferentially in the middle troposphere. However, the HPVT structure most highly correlated with dynamic instability occurs at lower levels near the height of 3 km, where the buildup and breakdown of HPVT is well consistent with intensity change of Wilma. As a result, Fig. 4 further examines the horizontal distribution of PV superposed with flow vectors at z=3 km in different stages of Wilma’s intensification. During the pre-RI period, the PV values in the inner-core region are small with the PV maximum only reaching 40.5 PVU, and the large PV are completely concentrated in the eye region, indicating that the PV distribution is approximately monotonic. Although horizontal tangential velocity increases and the rotation of hurricane is amplified, the PV values in the eye keep below 50 PVU after entering RI period. Therefore, the annular structure of elevated PV is produced inside the RMW(near the radius of 10 km), where the PV maximum is more than 90 PVU. That is, the radial distribution of PV might be expected to be a hollow annulus of high PV with low PV in the central region. At 29 hours of integration, horizontal tangential velocity continuously increases, and the PV ring becomes thinner and more symmetrical as the annular ring contracts inward within a radius of 10 km. At this time, the PV maximum inside the RMW is 128 PVU, while the PV values in the eye have yet kept below 50 PVU. In response to the PV ring being hollower, Wilma begins explosive deepening. When the PV maximum and position of elevated PV ring basically stabilize, the PV values in the eye increase to 90 PVU and the PV ring continues inward thickening from the inside of the eyewall. Large PV fluid has been mixed into the eye region, which leads to the PV ring nearly symmetrized to a monopole. Subsequently, Wilma starts weakening.

|
Fig.4 Horizontal PV (shaded, PVU) and wind vector (m·s-1) at 3 km height at (a) 15 hours, (b) 21 hours, (c) 29 hours and (d) 36 hours corresponding to model integration time |
The characteristics of PVT in different stages of Wilma’s intensification are presented through the analysis of horizontal and vertical PV distribution. Dynamic analysis indicates that, the structure of PVT is closely associated with instability of Hurricanes, including barotropic instability, algebraic instability and mixed-wave instability. An identical necessary condition for these instabilities is that there must be a PV(degenerate into vorticity under the nondivergent barotropic condition)maximum in the radial scope except in the eye. The three-dimensional structure of HPVT in real hurricanes can be used to nicely illustrate this phenomenon. Thus, the buildup and breakdown of HPVT associated with dynamic instability of vortex, play a significant role in governing the rapid intensity changes of hurricanes.
4 THE EFFECT OF PVT ON INTENSITY CHANGES OF HURRICANESWe have discussed that the transformation between MPVT and HPVT from each other and the change of dynamic stability in hurricanes can occur under the upper-level warming, latent heat release, and vertical mixing of convection. However, the spatial distributions of PVT simply qualitatively describe whether the structure satisfies the necessary condition for dynamic instability or not. How the characteristics of PVT are exhibited and how different PVT structures affect the instability of hurricanes will be explored further by quantitative analysis.
Schubert et al.(1999)performed a linear stability analysis for hurricane-like rings of enhanced vorticity. They found that, in a barotropic context, the unstable vorticity wave growth rate is a function of the average inner-core vorticity, azimuthal wavenumber, the ring thickness, and the ring hollowness. Based on the definition of an annular vorticity in the stability analysis(Michalke and Timme, 1967), Schubert et al.(1999)defined two parameters to describe these hurricane-like vorticity rings: a ring thickness parameter δ(i.e., the ratio of the vorticity jumps from the eye to the eyewall and from the eyewall to the environment), and a ring hollowness parameter γ(i.e., the ratio of the eye vorticity ζ1 to the average inner-core vorticity ζav, γ = ζ1/ζav).
The basic state vorticity is defined by
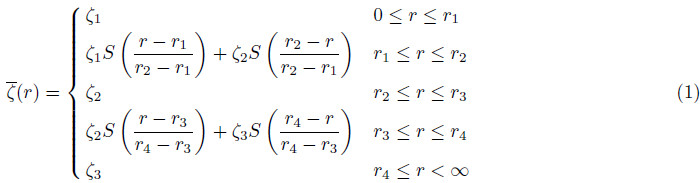
In order to quantitatively analyze Wilma’s PV ring at different stages and get an insight into the effect of the buildup and breakdown of HPVT on intensity change in hurricanes, two structural parameters for PV ring, thickness and hollowness are generalized to the PV diagnostics in the real hurricane. Fig. 5a shows the radial profiles of basic absolute vorticity and its gradient, as well as the location of each radius parameter in theoretical simulation by Hendrick et al.(2008). R1 and R4 correspond to the radii of vorticity gradient jump and sharp drop, respectively. R2 and R3 denote the inner and outer boundary radius of vorticity peak, respectively. Fig. 5b exhibits the radial profiles of axisymmetric PV and its gradient in numerical simulation of Wilma at 24 hours of integration. By comparison, the PV profiles in the real case from the eye to the peak are smooth without evident turning points. Moreover, the slope of PV profile is large near the radius of maximum PV, that is, PV values change more rapidly. These results make it hard to calculate the structural parameters in the real case. Therefore, the calculation method of both thickness and hollowness in Hurricane Wilma is modified according to the ideal experimental results of Hendrick et al.(2009). Firstly, the positions of occurred PV jumps are determined via the peaks of PV growth rate, in other words, the positions of both crest and trough for PV gradient are used to represent r1 and r4, respectively. Secondly, the region in which the PV values are more than 90 percents(including 90%)of the peak, is defined as the large PV region, and its inner and outer boundary radius corresponds to r2 and r3, respectively. Finally, because the inner core region for the hurricane is not clearly defined, we use the ratio of the eye PV q1 to the PV maximum qm to calculate the ring hollowness. Based on the definition above, the positions of r1, r2, r3, and r4 have been determined at the RI stage in Hurricane Wilma. Then, the PV ring thickness and holloness during the RI period are obtained at 30 mins intervals.

|
Fig.5 (a) Radial distribution of basic absolute vorticity (solid,10-3s-1) and absolute vorticity gradient (dotteddashed,s-1·m-1) used in theoretical simulation by Hendrick (2008).Dashed lines indicate the radius parameters. R1 and R4 denote the radius of vorticity increasing rapidly and decreasing sharply,respectively.R2 and R3 denote the inner and outer boundary radius of vorticity peak.(b) Radial distribution of axisymmetric PV (solid,PVU) and axisymmetric PV gradient (dotted-dashed,PVU·m-1) at 24 hours corresponding to model integration time.R1 and R4 correspond to locations of crest and trough for PV gradient,respectively.In a ddition,R2 and R3 denote the boundary radius to the region whose values are more than 90%(including 90%) of the peak |
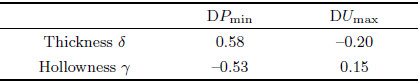
When the radial PV profile is characterized by MPVT(i.e., r1 = 0, q1 = qm), corresponding to δ = 0 and γ = 1, Wilma keeps a steady state. Along with the buildup of HPVT, the large thickness and the small hollowness show that the PV ring is thin and hollow, while the small thickness and the large hollowness indicate that the PV ring is thick and filled. Table 1 lists the correlation coefficients between structural parameters of lower-level PV rings at 30 mins intervals and intensity change of Wilma at 30 mins intervals. The correlation coefficient between the change rate of the minimum sea level pressure every 30 minutes(DPmin) and the ring thickness δ is 0.58 while the correlation coefficient between the change rate of the maximum wind speed every 30 minutes(DUmax) and the ring thickness δ is only -0.2. Similarly, the correlation coefficient between DPmin and the ring hollowness γ is –0.53, but between DU max and the ring hollowness γ is 0.15. The correlation coefficients of the structural parameters and the change rate of minimum sea surface central pressure exceed the 99% confidence level, while the correlation coefficients of the structural parameters and the change rate of the maximum wind speed don’t pass the confidence test. These results illustrate that significant correlation between the structural parameters of HPVT and the minimum sea level pressure change of the hurricane exists. On the contrary, the correlation is poor between the structural parameters of HPVT and the maximum wind speed change.
| Table 1 The correlation coefficients between structural parameters of low-level PV rings and intensity change of hurricane |
The evolution of both intensity change in Wilma and the structural parameters for PV ring during the RI period are shown in Fig. 6. In response to the large PV existing in the eye, the ring thickness and hollowness are 0 and 0.97, just entering the RI stage, respectively. It indicates that the point of the PV peak is removed from the eye with the position of large PV gradually moving outward, and the ring of enhanced PV is generated. It is one of necessary conditions for the instability of hurricane. In the next 12 hours, the δ monotonically increases while the γ monotonically decreases. The thickness reaches its maximum(δ=0.57), but the hollowness minimizes(γ=0.40)at 27 hours of integration. The structure of PVT becomes thinner and hollower at this time. As the radial PV gradients on the edges of the annular ring reach the peak, the PV ring is the most unstable. It can be presented from the evolution of both the DPmin and the DUmax(Fig. 6a)that Wilma stays in the explosive deepening stage with the mean of DPmin of more than 2 hPa 30 min-1 within 15~27 hours of integration. Of interest is that Umax tends to increase during the first 6 hours. But the DUmax is characterized by the oscillation around zero during the second 6 hours period, which illustrates the hurricane stability does not appear to be consistent with the change in Umax as the PV ring becomes thin and hollow. Chen et al.(2011)find that the change in Pmin is not consistent with the change in Umax, as compared to the pressure-wind relation during the first 6 hours RI period in the review of the life cycle of Wilma. The effect of the PVT characteristics on the structure and intensity change in hurricanes have been investigated by (Hendrick et al.2008, 2010)with a nondivergent barotropic model. They found that both the minimum central pressure and maximum tangential velocity simultaneously decrease during all PV mixing events, when the HPVT structure transforms into the MPVT. The above discussion shows that on one h and , Pmin decreases with PV ring becoming thinner and hollower, and Umax also increases under the constraint of gradient wind balance, causing hurricanes to intensify, but on the other h and , Umax could decrease through the PV mixing to inhibit the hurricane development. Thus, when unstable structure of HPVT in Wilma develops into a certain stage, the reduction of Pmin tends to be constant, but the variation of Umax oscillates around zero value. On the whole, the intensification rate of Wilma decreases during this period, as compared to the intensification rate at the first 9 hours RI stage(Fig. 6a).

|
Fig.6 Time series of the variations of (a) Pmin (solid, hPa/30 min) and Umax in 30 minutes (dashed, (m·s-1)/30 min); and (b) two structural parameters, in which thickness and hollowness are denoted by solid and dashed line, respectively |
Note that the variation of both thickness and hollowness exhibit oscillation after 27 hours of integration. Oscillating changes for thickness and hollowness are very evident and float up or down between 0.4 and 0.45 (Fig. 6b)especially within 27~31 hours of integration. Meanwhile, the large fluctuations of DPmin and DUmax occur, as well as the intensification rate of Wilma further weakens. After 31 hours of integration, the thickness and hollowness enter into the stage of monotonic decrease and increase respectively. This result indicates that the width of PV ring becomes thicker, associated with the radius of the PV peak moving inward, and large PV fluids are mixed into the eye. The hurricane instability is reduced in response to PV mixing. This illustrates that although thick rings which may be analogous to annular hurricanes exist at the later RI stage, the vortex is stable to exponentially growing perturbations(Knaff et al. 2003). Subsequently, the values of DPmin and DU max tend to 0. Until 36 hours of integration, the DPmin and DUmax are 0.02 hPa and 0.34 m·s-1 respectively, indicating that Wilma begins to weaken.
5 DISCUSSIONS AND CONCLUSIONSIn this study, the characteristics and evolution of the Potential Vorticity Tower(PVT)at different stages and its contribution to rapid intensification(RI)are investigated using the high-resolution simulation of Hurricane Wilma(2005).
The primary results of this study are as follows:
(1)By comparing the change of physical variables related to the PV with the intensity change of Wilma, it is determined that the positive PV anomaly in the upper troposphere tends to occur during the pre-RI period. Moreover, the PV anomaly gradually weakens with the subsidence of upper-level warm core during the RI period and disappears at the post-RI period. The temporal evolution of the PV anomaly large centre in the middle and lower troposphere are in phase of the intensity change of Wilma. The mid-level positive PV anomaly is closely related to the subsidence of upper tropospheric PV anomaly and the mid-level latent heat release associated with convective activity. Furthermore, the intensity change of the lower-level PV anomaly large centre satisfies the criterion of dynamic instability, so the distribution and evolution of PV anomaly have demonstrative function to the rapid intensification of Wilma at different stages.
(2)The vertical and horizontal structures of the PVT at different stages of RI are also diagnosed. Results reveal the transformation between MPVT and HPVT and it is related to the dynamic stability of the hurricane. The PV structure is characterised by typical monopole PVT(MPVT)in terms of the entire layer during the pre-RI period. As the build-up of hollow PVT(HPVT)under the effect of upper-level warming, latent heat release and vertical mixing of convection during the RI period, the enhanced instability causes the explosive intensification of Wilma. Subsequently, the radial PV mixing strengthens, indicating that the large PV columns on either side of the eye gradually break down, and the HPVT transforms into the MPVT. Simultaneously, the hurricane begins to stabilise.
(3)Two theoretical structural parameters, thickness and hollowness, are redefined in the simulated hurricane case so that the structural effect of the PVT on the intensity change of hurricanes could be quantitatively analyzed. The correlation analysis of the structural parameters and the intensity change of Wilma(2005)during the RI period show that the correlation coefficients of the structural parameters and the change rate of minimum sea surface central pressure exceed the 99% confidence level, which indicates the high dependency between the PVT structure and the intensity change of hurricanes. Meanwhile, it is also verified that the minimum central pressure and maximum tangential velocity could simultaneously decrease during all PV mixing events. Based on the case study, we will examine further through the composite analysis for more hurricane cases in the future to make the findings have more general significance.
ACKNOWLEDGMENTSWe would like to thank Prof. Da-Lin Zhang for his constructive and valuable comments on the manuscript. This work was supported by the National Natural Science Foundation of China(41175054, 41275002 and 41230421).
| [1] | Aberson S D, Black M, Montgomery M T, et al. 2006. Hurricane Isabel (2003): New insights into the physics of intense storms. Part II: Extreme localized wind. Bull. Amer. Meteor. Soc., 87(10): 1349-1354. |
| [2] | Bender M A, Ginis I, Kurihara Y. 1993. Numerical simulations of tropical cyclone-ocean interaction with a high-resolution coupled model. J. Geophys. Res., 98(D12): 23245-23263. |
| [3] | Bender M A. 1997. The effect of relative flow in the asymmetric structure in the interior of hurricanes. J. Atmos. Sci., 54: 703-724. |
| [4] | Chen H, Zhang D L, Carton J, et al. 2011. On the rapid intensification of Hurricane Wilma (2005). Part I: Model prediction and structural changes. Wea Forecasting, 26(6): 885-901. |
| [5] | Chen H, Zhang D L. 2013. On the rapid intensification of Hurricane Wilma (2005). Part II: Convective bursts and the upper-level warm core. J. Atmos. Sci., 70: 146-162. |
| [6] | Chen L S, Ding Y H. 1979. Generality of Western North Pacific Typhoons (in Chinese). Beijing: Chinese Science Press, 403. |
| [7] | Duan Y H, Qin Z H, Gu D F, et al. 1998. Numerical study on the effects of sea surface temperature on tropical cyclone intensity-Part I: Numerical experiment of the tropical cyclone intensity related to SST. Acta Meteorologica Sinica, 12(2): 142-148. |
| [8] | Hendricks E A. 2008. Tropical cyclone evolution via internal asymmetric dynamics [Ph. D. Dissertation]. Colorado:Colorado State University. |
| [9] | Hendricks E A, Schubert W H, Taft R K, et al. 2009. Life cycles of hurricane-like vorticity rings. J. Atmos. Sci., 66(3): 705-722. |
| [10] | Hendricks E A, Schubert W H. 2010. Adiabatic rearrangement of hollow PV towers. J. Adv. Model. Earth. Syst., 2: 1-19. |
| [11] | Holland G J, Wang Y Q. 1999. What limits tropical cyclone intensity. // Preprint of the 23rd Conference on Hurricanes and Tropical Meteorology. Amer. Meteor. Soc., Dallas, Texas, 955-958. |
| [12] | Houze Jr R A, Chen S S, Smull B F, et al. 2007. Hurricane Intensity and Eyewall Replacement. Science, 315(5816): 1235-1239. |
| [13] | Knaff J A, Kossin J P, De Maria M. 2003. Annular hurricanes. Wea. Forecasting, 18: 204-223. |
| [14] | Macdonald N J. 1968. The evidence for the existence of Rossby-like waves in the hurricane vortex. Tellus, 20(1): 138-150. |
| [15] | Michalke A, Timme A. 1967. On the inviscid instability of certain two-dimensional vortex-type flows. J. Fluid Mech., 29(4): 647-666. |
| [16] | Möller J D, Smith R K. 1994. The development of potential vorticity in a hurricane-like vortex. Quart. J. Roy. Meteor.Soc., 120(519): 1255-1265. |
| [17] | Montgomery M T, Kallenbach R J. 1997. A theory for vortex rossby-waves and its application to spiral bands and intensity changes in hurricanes. Quart. J. Roy. Meteor. Soc., 123(538): 435-465. |
| [18] | Montgomery M T, Vladimirov V A, Denissenko P V. 2002. An experimental study on hurricane mesovortices. J. Fluid Mech., 471: 1-32. |
| [19] | Montgomery M T, Bell M M, Aberson S D, et al. 2006. Hurricane Isabel (2003): New insights into the physics of intense storms. Part I: Mean vortex structure and maximum intensity estimates. Bull. Amer. Meteor. Soc., 87(10): 1335-1347. |
| [20] | Nolan D S, Montgomery M T, Grasso L D. 2001. The wavenumber-one instability and trochoidal motion of hurricane-like vortices. J. Atmos. Sci., 58(21): 3243-3270. |
| [21] | Schubert W H, Alworth B T. 1987. Evolution of potential vorticity in tropical cyclones. Quart. J. Roy. Meteor. Soc., 113(475): 147-162. |
| [22] | Schubert W H, Montgomery M T, Taft R K, et al. 1999. Polygonal eyewalls, asymmetric eye contraction, and potential vorticity mixing in hurricanes. J. Atmos. Sci., 56(9): 1197-1223. |
| [23] | Terwey W D, Montgomery M T. 2008. Secondary eyewall formation in two idealized, full-physics modeled hurricanes. J.Geophys. Res., 113: D12112. |
| [24] | Wang Y, Wu C-C. 2004. Current understanding of tropical cyclone structure and intensity changes-a review. Meteor.Atmos. Phys., 87(4): 257-278. |
| [25] | Zhong W, Zhang D L, Lu H C. 2009. A theory for mixed vortex Rossby-gravity waves in tropical cyclones. J. Atmos.Sci., 66(11): 3366-3381. |
| [26] | Zhong W, Lu H C, Zhang D L. 2010. Mesoscale barotropic instability of vortex Rossby wave in tropical cyclones. Adv.Atmos. Sci., 27(2): 243-252. |