 2015, Vol. 58


2. Department of Space Physics, School of Electronic Information, Wuhan University, Wuhan 430072, China;
3. State Key Laboratory of Space Weather, Chinese Academy of Sciences, Beijing 100190, China
The solar wind is composed of the plasma flow coming from the Sun and the interplanetary magnetic field flowing with the plasma. When the solar wind encounters the Earth, the geomagnetic field can shield it, and the bow shock, magnetosheath and magnetopause are formed. The coupling of solar wind and Earth’s magnetosphere triggers currents and electric fields, drives large-scale magnetospheric convections, causes changes of the magnetopause configuration, generates inner changes of the magnetosphere, and finally produces magnetic storms or substorms. The coupling also affects both the current systems and spatial regions in the magnetosphere, including the ring current and the radiation belts(Yuan, 2011).
Geomagnetic activity is an important phenomenon, largely affected by the solar wind. When the geomagnetic environment changes, especially during intense magnetic storms, environments of the ionosphere, upper atmosphere and particle radiation will respond strongly, resulting in severe space weather effects to pose a potential danger to orbiting spacecraft and astronauts in space. CMEs and CIRs are the main factors that influence the geomagnetic activity(Heber et al., 1999; Cane and Richardson, 2003; Zhang et al., 2008). CME events are a kind of large-scale solar activity, which mainly occur during solar maxima. CME-driven storms are of shorter duration and large intensity, commonly with storm sudden commencements(SSCs). In contrast, CIR events are always moderate, primarily occurring during solar minima. CIR-driven storms are of longer duration and weaker intensity. They occur frequently with Dst above -100 nT without SSCs. Geomagnetic storms are mainly driven by CMEs and CIRs(Turner et al., 2009), impacting remarkably on the dynamics of magnetospheric particles and the perturbation of various plasma waves(Reeves et al., 2003), on the timescales from seconds to months or more. Therefore, a detailed and comprehensive investigation of the temporal features of the solar wind and the geomagnetic activity is very important to recognize systematically the characteristic responses of Earth’s magnetosphere to solar activity and the solar wind-magnetosphere particle and energy coupling processes.
In order to comprehensively investigate the characteristic temporal features of the solar wind activity and associated geomagnetic activity, a large amount of solar wind data and geomagnetic activity indices are analyzed in detail. Firstly, using the public data of solar wind parameters and geomagnetic activity indices provided by the NASA OMNIWeb, the MATLAB codes are developed to deal with a number of key parameters including IMF Bz, solar wind velocity, solar wind proton density, solar wind dynamic pressure, Dst, AE, and Kp for the entire Solar Cycle 23 from 1996 to 2008. The complete database with a full list of 269 CME events and 456 CIR events is identified. Case event studies and superposed epoch analyses are implemented to carefully investigate the statistical features of four important solar wind parameters(IMF Bz, solar wind speed, solar wind proton density, and solar wind dynamic pressure) and three major geomagnetic indices(Dst, AE, and Kp)associated with the two types of solar disturbances. Secondly, the minimum of Dst index is utilized to differentiate 355 isolated geomagnetic storms occurring during the Solar Cycle 23. These storms are further categorized according to the magnitude of Dst minimum into 145 weak storms, 123 moderate storms, 70 strong storms, 12 severe storms, and 5 extreme storms. Finally, superposed epoch analysis is applied to evaluate the statistics of solar wind parameters and geomagnetic indices corresponding to magnetic storms with different intensities.
2 DATA AND METHOD 2.1 DataIn this paper, the data used to study the solar wind transients and geomagnetic activities are downloaded from the public data sets of NASA OMNIWeb(http://omniweb.gsfc.nasa.gov/). The major solar wind parameters and geomagnetic indices for analysis include the z component of interplanetary magnetic field(IMF Bz), solar wind proton density(Nsw), solar wind speed(Vsw), solar wind dynamic pressure(Pdyn = 2×10⁻⁶NswVsw2), with a 1-hour time resolution, and the Dst, AE and Kp index.
2.2 Analysis MethodCase studies and superposed epoch analysis are utilized to analyze CMEs, CIRs and isolated geomagnetic storms during the Solar Cycle 23 from 1996 to 2008. Here we first carefully identify the CME events, CIR events, and isolated geomagnetic storms during the Solar Cycle 23 to establish the corresponding databases. The start time and end time for each event are given, and superposed epoch analyses are performed to compare the solar wind parameters of solar wind transients: CMEs, CIRs, and the induced geomagnetic activities that are measured with geomagnetic indices. Using the same method, we also investigate the solar wind parameters when geomagnetic storms are generated, and compare those parameters and the changes of geomagnetic indices during different levels of geomagnetic storms. Superposed epoch analysis chooses zero epoch according to the same st and ard for each type of events. The time later and earlier than zero epoch is denoted as positive and negative, respectively. For example, if zero epoch is set to at 10:16UT on May 23, 2002, the time at 10:16UT on May 24, 2002 is denoted as +1 day, and the time at 10:16UT on May 22, 2002 is denoted as -1 day, and so on. Parameters to be analyzed should be described by the same time series, and then their temporal variations and averaged characteristics can be determined quantitatively in the interest time span.
In this paper, the zero epoch of each CME and CIR event is set as the start time of the event, which is selected as the time when interplanetary shock arrives or interplanetary magnetic field starts to turn southward. The end time is selected as the time when solar wind parameters and geomagnetic indices recover to the quiet level(Chen et al., 2012). The zero epoch of each geomagnetic storm is set as the time when Dst reaches the minimum. By doing so, geomagnetic storms can be easily classified to obtain the occurrence patterns of different classes of geomagnetic storms and study the relationships between Dst and other geomagnetic indices during geomagnetic storms.
3 RESULTS 3.1 Examples of CME and CIR Events and Their Driven Magnetic StormsLeft panels of Fig. 1 show a CME event and the driven magnetic storm. As shown by the vertical dashed lines, the start time was at 23:21UT on day of year(DOY)267(Sept. 24), 1998 and the end time was at 11:42UT on DOY 269(Sept. 26), 1998. The duration was about 1.5 days. The corresponding magnetic storm lasted even longer until the time when Dst recovered to the pre-storm level. During the considered time interval, solar wind parameters and geomagnetic indices show a number of variations:(1)the magnetic storm had a large southward IMF Bz component about -17.7 nT at 02:00UT on DOY 268. Associated with the increase of positive IMF By and southward turning of IMF Bz, the solar wind speed increased from 433 km·s-1 to 809 km·s-1, the solar wind proton density increased from 7.6 cm-3 to 12.0 cm-3, and the solar wind dynamic pressure increased from 2.67 nPa to 8.06 nPa within 5 hours. Subsequently, IMF Bz turned northward, reaching a peak magnitude at 7.5 nT. Finally, IMF Bz oscillated around 0 nT. The solar wind speed decreased slowly, but the solar wind proton density decreased faster, indicating the major role of the latter in the solar wind dynamic pressure pulse event.(2)Corresponding to the southward IMF Bz, there was a SSC with the Dst of -4 nT during the onset phase. The minimum Dst was -207 nT at 09:00UT on DOY 268, indicating a strong magnetic storm. At the same time the southward IMF Bz was small. The maximum AE was 1616 nT at 12:00UT on DOY 268, and the maximum Kp was 8.3 at 06:00UT on DOY 268. The recovery phase of magnetic storm lasted about 1.5 days. There were some oscillations with the amplitudes as large as hundreds of nT after the peak of AE index, as evident intense substorm activities. Kp decreased to 3 within one day. Both the occurrence of SSC and quick recovery of Kp index to the quiet-time level are typical features of CME-driven storms(Borovsky and Denton, 2006; Chen et al., 2012).

|
Fig.1 Examples of CME and CIR events and associated geomagnetic storms |
Right panels of Fig. 1 is a CIR event and its driven storm. As shown by the two vertical dashed lines, the start time was at 00:00UT on DOY 80(Mar. 20), 1996 and the end time was at 00:00UT on doy 84(Mar. 24), 1996. The duration was about 4 days. During the considered time period, solar wind parameters and geomagnetic indices varied as follows:(1)The southward IMF Bz is as small as -5.8 nT at 07:00UT on DOY 80, but the y and z components of IMF oscillated more frequently. The solar wind speed increased from 397 km·s-1 to 653 km·s-1, reaching its maximum at 23:00 UT on DOY 81 and then decreasing slowly. The solar wind proton density and dynamic pressure also decreased slowly. The peak value of the proton density was 15.5 cm-3 and the solar wind dynamic pressure was below 6 nPa.(2)The minimum Dst was -66 nT at 22:00UT on DOY 81, indicative of a moderate geomagnetic storm. No SSC occurred. The maximal AE index was 844 nT at 19:00UT on DOY 80. AE oscillated obviously, indicating the occurrence of substorms. The maximum Kp was 5.7. The Kp value of ~3 lasted a long time, corresponding to a recovery phase over one day. Relatively weak storms and long recovery phase of Kp are representative characteristics of CIR-driven storms(Borovsky and Denton, 2006; Chen et al., 2012).
3.2 The Complete List of CME and CIR EventsBased on the illustrative examples shown in Section 3.1 and the summarized major differences between CMEs and CIRs(Borovsky and Denton, 2006), all solar wind parameters and geomagnetic indices during the Solar Cycle 23 are analyzed to establish a complete list of CME and CIR events, in which the start time and end time for 269 CMEs and 456 CIRs are carefully identified for the following investigations.
3.3 Statistical Analysis of Solar Wind Parameters for CME and CIR Events 3.3.1 Superposed epoch analysisSuperposed epoch analysis is used to analyze seven parameters, including IMF Bz, solar wind speed(Vsw), solar wind proton density(Nsw), solar wind dynamic pressure(Psw), Dst, AE and Kp index, for 269 CME and 456 CIR events. Zero epoch is set as the start time of CME and CIR events. For CME events, the duration is three days including one day before zero epoch and two days after. For CIR events, the duration is five days including one day before zero epoch and four days after.
Figure 2 gives the results of solar wind parameters for all CME and CIR events during 23rd solar cycle(include IMF Bz, solar wind speed, solar wind proton density, and solar wind dynamic pressure)using superposed epoch analysis. The black “+” represents each point of CME and CIR events, and the red line represents the mathematic averages of the temporal variations. Statistically, IMF Bz, solar wind speed and solar wind dynamic pressure for CME events have a larger range than CIR events, but the solar wind proton density for CIR events has a larger range than CME events. For example, solar wind speed of some CME events can be larger than 1000 km·s-1, but CIR events is always less than 1000 km·s-1. The number of CME events with solar wind dynamic pressure peaks >30 nPa is much larger than that of CIR events. The proton densities for all CME events are less than 60 cm-3, but they can reach as large as 100 cm-3 for CIR events. The results of superposed epoch analysis show that the differences of statistically averaged IMF Bz between CME and CIR events are small. Although the solar wind speed shows obvious increase for both CME and CIR events, the former is much faster and decrease substantially within a few hours, while the latter increase slowly within one or two days after zero epoch. In addition, the statistically averaged dynamic pressures of CME events change more distinctly than CIR events, while the proton densities of CIR events are more variable.

|
Fig.2 Superposed epoch analysis results of four important solar wind parameters(IMF Bz, Vsw, Nsw, Pdyn)corresponding to all CME and CIR events of 1996-2008 |
Figure 3 gives the results of geomagnetic indices for all CME and CIR events during 23rd solar cycle(Dst, AE, Kp)using superposed epoch analysis. It is obvious that CME events drive more intense magnetic storms, disturb more obviously before zero epoch and couple with SSCs intensively. Relatively, CIR events can also drive strong geomagnetic storms with Dstmin < -350 nT, maximal AE> 1500 nT, and maximal Kp ~ 9. However, changes of AE and Kp indices for CIR events after zero epoch are not so obvious as CME events.
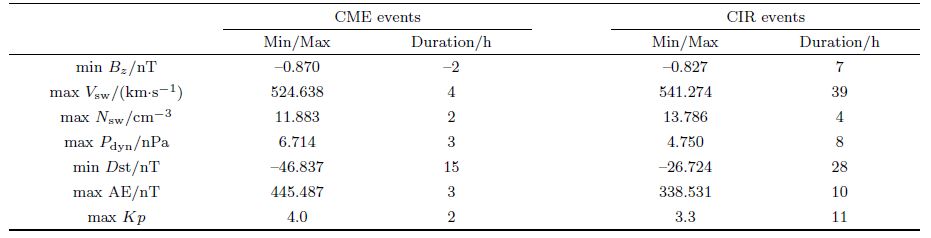
Table 1 gives the mean maximum(minimum)of IMF Bz, solar wind speed, solar wind proton density, solar wind dynamic pressure, Dst, AE and Kp and the time relative to zero epoch when arriving at the maximum/ minimum value. For CME events, each considered parameter approaches the mean maximum(minimum)quickly after the start time. But for CIR events, the parameters require a longer time to reach the maxima(minima). Table 1 tells that on average CME events have larger southward IMF Bz, solar wind dynamic pressure, AE, Kp and smaller Dstmin, which means that CME events are generally more severe than CIR events and their driven magnetic storms and substorms are much stronger(Denton et al., 2006). But for CIR events, solar wind speed and solar wind proton density have larger maxima, because CIR events are closely connected with high speed proton fluxes.

|
Fig.3 Superposed epoch analysis results of three major geomagnetic indices(Dst, AE, Kp)corresponding to all CME and CIR events of 1996-2008 |
| Table 1 Min or max of average values of various parameters corresponding to all CME and CIR events of 1996-2008 and associated time distances to zero epoch time |
Based on the results of superposed epoch analysis given by Fig. 2, the relation between Nsw and Pdyn for all CME and CIR events during 23rd solar cycle has been analyzed: using Nsw divided by Pdyn, then the slope of Nsw/Pdyn changing with time is obtained through linear fitting, and the fitting area is the whole duration of CME or CIR events after zero epoch. Fig. 4 gives the distribution of linear fitting slope of Nsw/Pdyn of all the CME and CIR events. The red “+” represents CME and the blue “*” represents CIR.
Analysis shows that linear fitting slope of Nsw/Pdyn is opposite for CME and CIR events. For CME events, 89.6% of linear fitting slopes k are positive, but for CIR events, 99.8% are negative. Because of Nsw/Pdyn = 5 × 10⁵/Vsw 2 (http://omniweb.gsfc.nasa.gov/html/ow data.html 3), where the units of Pdyn, Nsw, and Vsw are nPa, cm-3, and km·s-1, the obvious difference of linear fitting slope of Nsw/Pdyn represents the different variable characteristic of solar wind speed during CME and CIR events. During CME events, solar wind speed increases largely within short time firstly, then decreases slowly. The time of decreasing is longer than increasing, so the curve of Nsw/Pdyn decreases sharply and then increases slowly. Thus the linear fitting slope of Nsw/Pdyn is positive in the whole duration. Since the effect of high speed proton flux, solar wind speed increases for a long time during CIR events, linear fitting slope of Nsw/Pdyn is negative. Fig. 4 indicates that the whole change trend of solar wind speed is a valid and reasonable parameter to distinguish between CME and CIR events.

|
Fig.4 Scatter plot of the linear fitting slope of Nsw/Pdyn corresponding to all CME and CIR events of 1996-2008 |
A geomagnetic storm occurs if the following criteria are satisfied:(1)a significant disturbance occurs which means that the minimum Dst is less than -30 nT;(2)a disturbance has obvious onset, main, and recovery phase. The isolated geomagnetic storms have important research values in all geomagnetic storms. So this paper focuses on the isolated geomagnetic storms, the criterions of which are:(1)the disturbance is small while Dst decreases and increases, which means the temporal variable curve is smooth or can be fitted by a smooth curve;(2)Dst is almost in magnetic quiet state at the start time and end time. Through visual inspection analysis of Dst curve from 1996 to 2008 one by one, 355 isolated geomagnetic storms have been identified, which means about 27 per year.
In this paper, the criterion using Dstmin given by Loewe has been adopted(Loewe and Prolss, 1997), as listed in Table 2, which gives the number of every class of isolated magnetic storms during the period of 1996-2008.
| Table 2 Classification of geomagnetic storm intensity and the total number of different classes of geomagnetic storms of 1996-2008 |

Using superposed epoch analysis to analyze the main solar wind parameters and geomagnetic indices of every class of geomagnetic storms, the zero epoch is set to the time of the minimum in Dst(i.e., the peak of magnetic storm main phase), and the seven days data include two days before the zero epoch and five days after. The mean results are shown in Fig. 5. It is observed that Dst decreases fast during the main phase. When the magnetic storm becomes more intense, Dst decreases faster and the duration of the recovery phase is longer. Overall, the different classes of magnetic storms have similar variations of Dst and the results of other six indices are similar. It is noted that because of lack of samples of great storms, the variation is large even after superposition averaging.

|
Fig.5 Superposed epoch analysis results of all isolated geomagnetic storms of 1996-2008 |
CME and CIR events are two significant contributors to interplanetary and geomagnetic disturbances, providing major drivers of geomagnetic storms to impact on the geo-space environment. After comprehensively investigating the temporal variations and averaged characteristics of the solar wind activity and associated geomagnetic activity during the Solar Cycle 23, we have reached the main conclusions as follows:
(1)There are 269 CME events and 456 CIR events during the Solar Cycle 23. Statistically, compared to CIR events, CME events have a larger variation range of the magnitude of southward IMF Bz, of solar wind speed and of solar wind dynamic pressure. In contrast, CIR events have larger values of solar wind proton density.
(2)On average, CME events have larger magnitudes of southward IMF Bz, solar wind dynamic pressure, AE and Kp indices but smaller Dstmin. CME events are always more severe than CIR events and can drive more intense geomagnetic storms.
(3)89.6% of CME events have positive slopes of linearly fitted Nsw/Pdyn curves, while 99.8% of CIR events have negative slopes, representing the distinct features of solar wind speed variations during CME and CIR events. Hence, the overall trend of solar wind speed variation can act as a reasonable and useful proxy to distinguish CME and CIR events.
(4)There are 355 isolated magnetic storms during the Solar Cycle 23. As the magnitude of geomagnetic storms increases, Dst decreases faster and the duration of the storm recovery phase becomes longer. Overall, Dst index exhibits certain similarity in respect of different levels of geomagnetic storms.
This study focuses on the Solar Cycle 23. Analysis of the Solar Cycle 24 will be a study left for future investigation. We concentrate on the statistical analysis of CME events, CIR events, isolated geomagnetic storms, while leaving almost untouched the specific differences of solar wind parameters and geomagnetic indices. The next step will be to perform a comparative study of AE-Dst indices to investigate the connection between geomagnetic storms and substorms, quantitatively evaluate the solar wind condition and parameter characteristics for driving geomagnetic storms at different levels, and separate CME and CIR events for an in-depth analysis. In addition, a combined analysis of the features of solar wind and geomagnetic activity and the dynamic processes of magnetospheric charged particles and the global distributions of plasma waves will be advantageous to comprehend the temporal characteristics of the responses of Earth’s plasma sheet, radiation belts, and ring current to various solar activities, thereby facilitating the reliable establishment of the sophisticated global coupling framework of solar wind-magnetosphere-ionosphere system.
ACKNOWLEDGMENTSWe acknowledge the support from the National Natural Science Foundation of China(41204120, 41304130 and 41474141), from the Fundamental Research Funds for the Central Universities(2042014kf0251, 2042014kf0269), and from the Project Funded by China Postdoctoral Science Foundation(2013M542051). We also thank Dr. Tung-Shin Tsu at UCLA and Dr. Lan Jian at NASA for valuable discussions and constructive suggestions.
| [1] | Borovsky J E,Denton M H.2006.Differences between CME-driven storms and CIR-driven storms.Journal of Geophysical Research:Space Physics,111(A7),doi:10.1029/2005JA011447. |
| [2] | Cane H V,Richardson I G.2003.Interplanetary coronal mass ejections in the near-Earth solar wind during 1996-2002.Journal of Geophysical Research:Space Physics,108(A4),doi:10.1029/2002JA009817. |
| [3] | Chen G M,Xu J Y,WangWB,et al.2012.A comparison of the effects of CIR-and CME-induced geomagnetic activity on thermospheric densities and spacecraft orbits:Case studies.Journal of Geophysical Research:Space Physics,117(A8),doi:10.1029/2012JA017782. |
| [4] | Denton M H,Borovsky J E,Skoug R M,et al.2006.Geomagnetic storms driven by ICME-and CIR-dominated solar wind.Journal of Geophysical Research:Space Physics,111(A7),doi:10.1029/2005JA011436. |
| [5] | Heber B,Sanderson T R,Zhang M.1999.Corotating interaction regions.Advances in Space Research,23(3):567-579. |
| [6] | Loewe C A,Prlss G W.1997.Classification and mean behavior of magnetic storms.Journal of Geophysical Research:Space Physics,102(A7):14209-14213. |
| [7] | Reeves G D,McAdams K L,Friedel R H W,et al.2003.Acceleration and loss of relativistic electrons during geomagnetic storms.Geophysical Research Letters,30(10):1529-1533. |
| [8] | Turner N E,Cramer W D,Earles S K,et al.2009.Geoefficiency and energy partitioning in CIR-driven and CME-driven storms.Journal of Atmospheric and Solar-Terrestrial Physics,71(10-11):1023-1031. |
| [9] | Yuan S Z.2011.The study on several problems of geomagnetic activity[Master thesis].Nanjing:Nanjing University of Information Science and Technology |
| [10] | Zhang Y,Sun W,Feng X S,et al.2008.Statistical analysis of corotating interaction regions and their geoeffectiveness during solar cycle 23.Journal of Geophysical Research:Space Physics,113(A8),doi:10.1029/2008JA013095. |