 2015, Vol. 58


2. College of Earth Sciences, University of Chinese Academy of Sciences, Beijing 100049, China
Seismic waves carrying information about the deep structure of the Earth and strong seismic body waves, surface waves and normal modes have been used to obtain a series of one-dimensional models of the Earth’s velocity, e.g., PREM(Dziewonski and Anderson, 1981), IASP91(Kennett and Engdahl, 1991), and AK135 (Kennett et al., 1995). The 410 km discontinuity(hereafter 410 km)is the upper boundary of the mantle transition zone given by these models, and underst and ing its detailed structure is very important for determining the material composition and the dynamic process of material transportation in the Earth’s interior(Deuss, 2009).
Long-period PP and SS precursors(Flanagan and Shearer, 1998a, 1998b; Deuss, 2009) and ScS reverberations (Revenaugh and Jordan, 1991)have been used to study the existence of the 410 km and to map its large-scale topography. Based on the results of these precursors and the high-temperature and high-pressure experimental and theoretical mineral analyses, the 410 km is considered the phase transition interface from α-olivine to β-olivine(e.g., Bina and Helffrich, 1994; Collier et al., 2001; Jin et al., 2013). It is depressed under hot spots and uplifted by cool subducted slabs and stagnant remnants(Bina and Helffrich, 1994; Song et al., 2004; Obayashi et al., 2006; Deuss, 2009).
Because of catastrophes caused by large earthquakes, the USA, Japan, Europe and China have deployed high-density and high-quality permanent or portable seismometers to monitor seismic activity. Recently, tremendous amount of seismic waveform data accumulated has become sufficient to image the detailed structure of the deep Earth. Based on receiver functions, the local topography of the 410 km(e.g., Zhang et al., 2010; Tian et al., 2010, 2011)has been imaged in many regions using the PdS phase, which is a conversion from P to S at a depth of d km. It has been shown to have a much smaller undulation than the topography near subduction zones and hot spots(e.g., Li et al., 2000). Therefore, it is important to determine how the small-scale topography of the 410 km is affected by local temperature anomalies from seismic waveform data with a relatively short period.
Weak secondary phases selected from the stacked seismograms recorded by seismic networks or arrays can be used to determine the small-scale topography of mantle discontinuities(Rost and Thomas, 2002). The weak SdP phases converted from S to P at a d km discontinuity and recorded by teleseismic networks are widely used. To minimize the effects of lateral heterogeneities, the seismic records used are limited to epicentral distances between 30° and 90°(Zang and Zhou, 2002; Rost and Thomas, 2002). Because of the small depth intervals between the foci and adjacent discontinuities, the SdP phases from relatively small Fresnel regions can be easily found in the stacked seismograms and used to create images of the small-scale topography of mantle discontinuities.
The greatest number of intermediate and deep focal earthquakes near the western Pacific subduction region has been recorded by dense seismic networks at suitable epicentral distances and the stacked waveform data have been used with the N-th root slant stack method to obtain the SdP conversion phases. Along with the conversion phases, the topography and complex structures of the 410 km affected by subduction slabs beneath western Pacific region, e.g., Izu-Bonin and Tonga-Fiji, have been determined(e.g., Collier et al., 2001). There is less stagnant material beneath continent-continent collision zones than ongoing subduction zones(e.g., Fukao and Obayashi, 2013), and the temperature anomalies are relatively weak; therefore, the effect on the phase transition of the 410 km is relatively small. The Pamir-Hindu Kush region located at the western syntax of the India-Asia collision has given birth to large number of intermediate and deep earthquakes, which are globally rare(e.g., Ning and Zang, 1990; Negredo et al., 2007; Sun et al., 2009; Sippl et al., 2013). Based on the distributions of focal mechanisms and high-precision earthquake relocation data(Pegler and Das, 1998; Sippl et al., 2013; Bai and Zhang, 2015), it appears that the northward subduction of the Hindu Kush plate is driven by negative buoyancy, while the southward subduction of the Pamir plate is driven by upper mantle convection. This bidirectional subduction model constitutes the complex high-plateau geomorphology of the western syntax. Because the old oceanic plate beneath Pamir-Hindu Kush had subducted deep into the upper mantle, even into the mantle transition zone(Negredo, et al., 2007), and was followed by continental lithosphere subduction, there are many intermediate and deep earthquakes, and the deepest one has a depth of approximately 380 km(Pegler and Das, 1998). The topography of the 410 km can be used to analyze the effects of the subducted oceanic lithosphere on the discontinuity in this region.
Based on the waveform data from the Hi-net seismic network and the USArray transportable array of the Earth Scope project(TA), the SdP phases in the P codas are found from vespegrams derived using the 4-th root slant stack method to create images showing how the topography and complex structure of the 410 km are affected by the subduction stagnancy beneath the Pamir-Hindu Kush region.
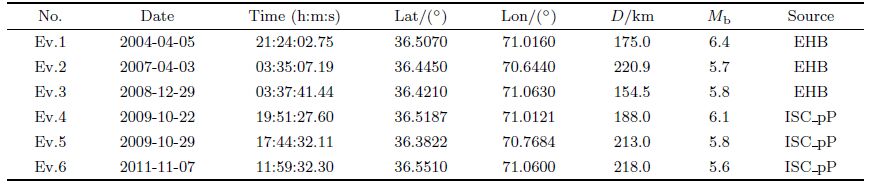
2 DATA PROCESSINGComplex focal sources or strong reflected pP or converted sP phases from the Earth’s surface can make a weak SdP phase invisible; therefore, we chose events with appropriate magnitudes and intermediate or deep focal depths and simple source time functions. The magnitudes of the earthquakes discussed in this paper are between Mb5.6 and 6.4, the lengths of the source rupture times are less than 4 s, and the signal-to-noise ratios should be sufficiently high. Because of the limited recording period of seismic networks and arrays and the selection criteria for the waveform data, we simply collected short-period waveform data from 6 events recorded since 2004 by the Hi-net seismic network and the broadb and data from one of the events recorded by the TA seismic array. The focal distribution can be seen in Fig. 1 and the relative parameters are listed in Table 1. The seismic waveform data were retrieved from the National Research Institute for Earth Science and Disaster Prevention, Japan(http://www.hinet.bosai.go.jp) and the Incorporated Research Institutions for Seismology, USA(IRIS, http://www.iris.edu). The focal depths affect the precision of the conversion depths directly; therefore, it is crucial to determine the focal depths accurately. The focal locations in Table 1 were selected from the events before 2009 in the EHB database(http://www.isc.ac.uk/EHB/index.html) and from the database of the International Seismological Center, and the focal depths from both databases were determined using the pP phases from globally distributed seismic stations.

|
Fig.1
The distribution of events used The focal mechanisms labeled with beach balls are the CMT solutions from http://www.globalcmt.org and the solid circles represent focal mechanisms that have no CMT solutions. The contours represent the extension of the Wadati-Benioff slab(Gudmundsson and Sambridge, 1998). The white numbers are the depths of the contours in km. |
| Table 1 The parameters of the events used |
The seismic waveform data were filtered with the frequency b and of 0.2~1.0 Hz because doing so can help find the conversion phase SdP(Castle and Creager, 2000) and suppress noise. During the data processing, we ab and oned the waveform data that was distorted by spike noises, etc.
The SdP phases due to weak mantle discontinuities could not be found directly from the raw waveform data. The waveform data for event Ev.5 recorded by the Hi-net seismic network are shown in Fig. 3. The seismograms were aligned and normalized to the highest peaks of the direct P phases and their arrival times were set to 0. The two dashed lines delineate the positions of the direct P phase and the S376P conversion phase. The S376P conversion phase cannot be distinguished in the raw waveform data, but is clearly shown in the stacked vespegrams shown later.
To find the SdP phases effectively, the N-th root slant stack method was used to enhance weak conversion phases and suppress noise(Kanasewich et al., 1973; McFadden et al., 1986; Zang and Zhou, 2002; Rost and Thomas, 2002). Because the target SdP phases are in P codas, the direct P peak with the largest amplitude in each trace was chosen as a reference for the stack processing. Its arrival time was set to 0 and each trace was normalized by its own peak amplitude(Fig. 3); therefore, the differential times and slownesses in the vespegrams of the direct P phases were 0.

|
Fig.3
The waveform data for Ev.5 recorded by Hi-net sub-network H6 The dashed line labeled “P” at 0 s represents the peaks of the direct P phases and the dashed line labeled “S376P” represents the arrival times of the conversion phases from the 410 km. |
The Hi-net seismic network is dense and its many stations are divided into sub-networks according to their azimuths and epicentral distances(Fig. 2a); therefore, the waveform data were also divided accordingly. The azimuthal and epicentral range covered by the TA seismic array is much smaller, making such a division unnecessary. The waveform data were processed using the 4-th root slant stack method by varying the differential slownesses. A comparison of the stacked seismograms of the same events recorded by different Hi-net subnetworks or the TA seismic array and of different events recorded by the same Hi-net sub-networks or the TA seismic array allowed the conversion phases to be selected and used to analyze the complex structure and topography of the velocity interfaces to cross-validate the results. To better illuminate the results, the stacked seismograms were made into vespegrams(in dB)of the differential times and slownesses by taking the base 10 logarithms of their envelopes. The SdP phases within ±0.1 s/(°)of the theoretical differential times and slownesses were found from the vespegrams. The locations and depths of the conversion points of the SdP phases were inverted based on the IASP91 model(Kennett and Engdahl, 1991). A more detailed description of the process can be found in Zang and Zhou(2002) and Rost and Thomas(2002).

|
Fig.2
The station distributions of the Hi-net seismic network and the TA array (a)The station distribution of the Hi-net. The sub-network distributions(H1-H9)of Hi-net that provided the waveform data for Ev.5 are labeled with different colors, and the small dots represent all of the other events;(b)The station distribution of the TA array, labeled with triangles. |
For a clearer explanation, the vespegrams of Ev.5 obtained from all of the sub-networks of Hi-net are used to illustrate the analysis performed in this study. In each vespegram, the numbers on top of the arrows represent the conversion depths of the SdP phases(Fig. 4). Because of the limited focal depths, the conversion phases between relatively strong direct P and pP phases are associated with the velocity interfaces at depths of approximately 360~381 km.

|
Fig.4
The vespegrams of the Ev.5 derived from the 4-th root slant stacking
based on data from the Hi-net sub-networks. H1-H9 were shown in Fig. 2b The numbers above arrows are the conversion depths(in km)related to SdP phases. |
Similarly, 36 vespegrams of all of the events in the data from the Hi-net sub-networks and the TA seismic array were used to find the conversion SdP phases related to the 410 km. The conversion depths are listed in Table 2. Because no conversion phase is strong enough to be identified within suitable error ranges of the differential times and slownesses in some vespegrams, there are some vacancies in Table 2.
| Table 2 The conversion depths determined from the vespegrams |
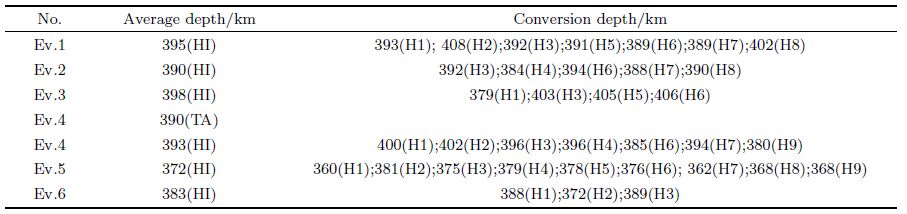
There is only one event recorded by both the TA seismic array(at an epicentral distance of approximately 95°) and the Hi-net seismic network(at distances from 40° to 50°). The average conversion depth related to the conversion phases found in the vespegrams of the Hi-net sub-networks is approximately 393 km, while that of the TA seismic array is 390 km. The result shows that the data from different epicenters are consistent.
Theoretically, conversion depth errors(±11km)come from the uncertainties in the focal depths(±5 km), the errors in the observed travel-times of the conversion phases(±5 km) and the velocity anomalies of the subducted slabs(±1 km)(Collier and Helffrich, 1997). Moreover, the regional topography of a velocity interface leads to errors in the conversion points of the vespegrams of different sub-networks(Zang et al., 2006). In comparison with those of other events, the conversion depths of Ev.5 are much shallower.
The conversion points between 372 and 398 km were projected onto a spherical plane at 410 km(Fig. 5).

|
Fig.5
The SdP conversion points relating to the 410 km Triangles represent the conversion point locations and the numbers represent the average depths of the conversion points(Table 2). All of the other symbols are as in Fig. 1. |
It was shown that the 410 km has been uplifted by 20~50 km because of the subducted slab and the stagnant materials induced by the subduction. Usually, the Clapeyron slant near the 410 km is -2.9 MPa/K(Bina and Helffrich, 1994), and then the phase transition interface of the 410 km is uplifted 8 km per 100 K. The subducted materials beneath the Pamir-Hindu Kush region cause a low-temperature anomaly of approximately 250~630 K compared with the surrounding mantle.
According to geological and geochemical test results, the continent-continent collision of this region occurred approximately 102~85 Ma(Ali et al., 2002); therefore, the oceanic lithosphere should have entered the deep Earth. In addition, seismic tomography shows that the subducted slabs of the Pamir-Hindu Kush plates are thinned at a depth of approximately 250 km, which means that the delamination of the subduction lithosphere continues and that stagnant materials have sunk into the mantle transition zone. Additional mineral components have been brought into the mantle by the stagnant materials. In addition to the phase transition of the 410 km from α-olivine to β-olivine, phase transitions at this depth could be caused by other types of stagnant materials, such as garnet, pyroxene and volatile chemical components, including water(Weidner and Wang, 2000). Other phase transitions and the partial melting induced by water could complicate the structure of the 410 km.
Compared with the 60~70 km elevation of the 410 km beneath the subducting zone in the western Pacific regions(e.g., Collier and Helffrich, 1997; Collier et al., 2001), the elevation of the 410 km caused by the low-temperature anomaly due to the subducted stagnant materials is relatively small. Additional seismic studies should be performed and the results combined with those of high-temperature and high-pressure mineral experiments to reveal the high-resolution structure of the 410 km and determine its implications for regional geodynamical processes.
4 CONCLUSIONBroadb and /short period waveform data from six earthquakes in the subduction slabs beneath Pamir-Hindu Kush with focal depths between 154.0 and 220.9 km and magnitudes between Mb5.6 and 6.4 recorded by the Hi-net seismic network, Japan and the TA seismic array, USA were processed using the 4-th root slant stack method. Thirty-six vespegrams of the waveform data of the Hi-net sub-networks and the TA seismic array were used to determine the conversion phase SdP, and then the conversion depths near 410 km were obtained. The 410 km is uplifted to the depths between 372 and 398 km. Compared with the effects of western Pacific subducting slabs, the stagnant subducted slab beneath Pamir-Hindu Kush causes a smaller impact on the topography of the 410 km.
ACKNOWLEDGMENTSThe study was supported by the National Natural Science Foundation of China(41274092). We would like to thank two reviewers for their comments that help improve the manuscript.
| [1] | Ali A,Nakamura E,Yamamoto H.2002.Sm-Nd mineral ages of pegmatite veins and their host rocks from Swat area,Chilas complex,northern Pakistan.J.Asian Earth Sci.,21(3):331-339. |
| [2] | Bai L,Zhang T Z.2015.Complex deformation pattern of the Pamir-Hindu Kush region inferred from multi-scale doubledifference earthquake relocations.Tectonophysics,638:177-184,doi:10.1016/j.tecto.2014.11.006. |
| [3] | Bina C R,Helffrich G.1994.Phase transition Clapeyron slopes and transition zone seismic discontinuity topography.J.Geophys.Res.,99(B8):15853-15860. |
| [4] | Castle J C,Creager K C.2000.Local sharpness and shear wave speed jump across the 660 km discontinuity.J.Geophys.Res.,105(B3):6191-6200. |
| [5] | Collier J D,Helffrich G R.1997.Topography of the "410" and "660" km seismic discontinuities in the Izu-Bonin Subduction Zone.Geophys.Res.Lett.,24(12):1535-1538. |
| [6] | Collier J D,Helffrich G R,Wood B J.2001.Seismic discontinuities and subduction zones.Phys.Earth Planet.Inter.,127(1-4):35-49. |
| [7] | Deuss A.2009.Global observations of mantle discontinuities using SS and PP precursors.Surv.Geophy.,30(4-5):301-326. |
| [8] | Dziewonski A M,Anderson D L.1981.Preliminary reference Earth model.Phys.Earth Planet.Inter.,25(4):297-356. |
| [9] | Engdahl E R,van der Hilst R,Buland R.1998.Global teleseismic earthquake relocation with improved travel times and procedures for depth determination.Bull.Seism.Soc.Am.,88(3):722-743. |
| [10] | Flanagan M P,Shearer P M.1998a.Global mapping of topography on transition zone velocity discontinuities by stacking SS precursors.J.Geophys.Res.,103(B2):2673-2692. |
| [11] | Flanagan M P,Shearer P M.1998b.Topography on the 410-km seismic velocity discontinuity near subduction zones from stacking of sS,sP,and pP precursors.J.Geophys.Res.,103(B9):21165-21182. |
| [12] | Fukao Y,Obayashi M.2013.Subducted slabs stagnant above,penetrating through,and trapped below the 660 km discontinuity.J.Geophys.Res.,118(11):5920-5938. |
| [13] | Gudmundsson Ó,Sambridge M.1998.A regionalized upper mantle(RUM) seismic model.J.Geophys.Res.,103(B4):7121-7136. |
| [14] | Jin Z M,Zhang Z J,Wu Y,et al.2013.Mantle transition zone and research methods.//Ding Z L ed.Research Methods in Solid Earth(in Chinese).Beijing:Science Publishing Company:402-434. |
| [15] | Kanasewich E R,Hemmings C D,Alpaslan T.1973.Nth-root stack nonlinear multichannel filter.Geophysics,38(2):327-338. |
| [16] | Kennett B L N,Engdahl E R.1991.Traveltimes for global earthquake location and phase identification.Geophys.J.Int.,105(2):429-465. |
| [17] | Kennett B L N,Engdahl E R,Buland R.1995.Constraints on seismic velocities in the Earth from traveltimes.Geophys.J.Int.,122(1):108-124. |
| [18] | Koulakov I,Sobolev S V.2006.A tomographic image of Indian lithosphere break-off beneath the Pamir-Hindu Kush region.Geophys.J.Int.,164(2):425-440. |
| [19] | Li X,Sobolev S V,Kind R,et al.2000.A detailed receiver function image of the upper mantle discontinuities in the Japan subduction zone.Earth Planet.Sci.Lett.,183(3-4):527-541. |
| [20] | McFadden P L,Drummond B J,Karvis S.1986.The N-th root stack:theory,application and examples.Geophysics,51(10):1879-1892. |
| [21] | Negredo A M,Replumaz A,Villaseñor A,et al.2007.Modeling the evolution of continental subduction processes in the Pamir-Hindu Kush region.Earth Planet.Sci.Lett.,259(1-2):212-225. |
| [22] | Ning J Y,Zang S X.1990.The distribution of Earthquakes and Stress State in Pamir-Hindu Kush Regions.Chinese J.Geophys.(in Chinese),33(6):657-669. |
| [23] | Obayashi M,Sugioka H,Yoshimitsu J,et al.2006.High temperature anomalies oceanward of subducting slabs at the 410 km discontinuity.Earth Planet.Sci.Lett.,243(1-2):149-158. |
| [24] | Pegler G,Das S.1998.An enhanced image of the Pamir-Hindu Kush seismic zone from relocated earthquake hypocentres.Geophys.J.Int.,134(2):573-595. |
| [25] | Revenaugh J,Jordan T H.1991.Mantle layering from ScS reverberations:1.Waveform inversion of zeroth-order reverberations.J.Geophys.Res.,96(B12):19749-19762. |
| [26] | Rost S,Thomas C.2002.Array seismology:methods and applications.Rev.Geophys.,40(3):2-1-2-27,doi:10.1029/2000RG000100. |
| [27] | Sippl C,Schurr B,Yuan X,et al.2013.Geometry of the Pamir-Hindu Kush intermediate-depth earthquake zone from local seismic data.J.Geophys.Res.,118(4):1438-1457. |
| [28] | Song T R A,Helmberger D V,Grand S P.2004.Low-velocity zone atop the 410-km seismic discontinuity in the northwestern United States.Nature,427(6974):530-533. |
| [29] | Sun W B,He Y S,Chang Z,et al.2009.The plate subduction and stress state in the Pamir-Hindu Kush region.Seism.Geol.(in Chinese),31(2):207-217. |
| [30] | Tian X B,Zhao D P,Zhang H S,et al.2010.Mantle transition zone topography and structure beneath the central Tien Shan orogenic belt.J.Geophys.Res.,115(B10):B10308,doi:10.1029/2008JB006229. |
| [31] | Tian X B,Teng J W,Zhang H S,et al.2011.Structure of crust and upper mantle beneath the Ordos Block and the Yinshan Mountains revealed by receiver function analysis.Phys.Earth Planet.Inter.,184(3-4):186-193. |
| [32] | Villaseñor A,Spakman W,Engdahl E R.2003.Influence of regional travel times in global tomographic models.EGSAGU-EUG Joint Assembly,Abstracts from the meeting held in Nice,France,6-11 April 2003,abstract 8614. |
| [33] | Weidner D J,Wang Y B.2000.Phase transformations:implications for mantle structure.//Karaoto S I,Forte A,Liebermann R,et al.Earth's Deep Interior:Mineral Physics and Tomography from the Atomic to the Global Scale,Vol.Geophysical Monograph Series 117.American Geophysical Union:215-235. |
| [34] | Zang S X,Zhou Y Z.2002.N-th root slant stack and its application in study of mantle discontinuities.Chinese J.Geophys.(in Chinese),45(3):407-415,doi:10.3321/j.issn:0001-5733.2002.03.012. |
| [35] | Zang S X,Zhou Y Z,Ning J Y,et al.2006.Multiple discontinuities near 660 km beneath Tonga area.Geophys.Res.Lett.,33(20):L20312,doi:10.1029/2006GL027262. |
| [36] | Zhang L P,Shao Z G,Li Z H.2014.Dynamic action of mutual subduction between the Indian and the Eurasia plates in Hindu Kush-Pamir region.Chinese J.Geophys.(in Chinese),57(2):459-471,doi:10.6038/cjg20140212. |
| [37] | Zhang Z J,Yuan X H,Chen Y,et al.2010.Seismic signature of the collision between the east Tibetan escape flow and the Sichuan Basin.Earth Planet.Sci.Lett.,292(3-4):254-264. |