2. Funciton Laboratory for Marine Mineral Resource Geology and Exploration, Qingdao National Oceanography Laboratory, Qingdao 266000, China;
3. Key Laboratory of Marine Hydrocarbon Resources and Environmental Geology, Ministry of Land and Resources, Qingdao 266071, China
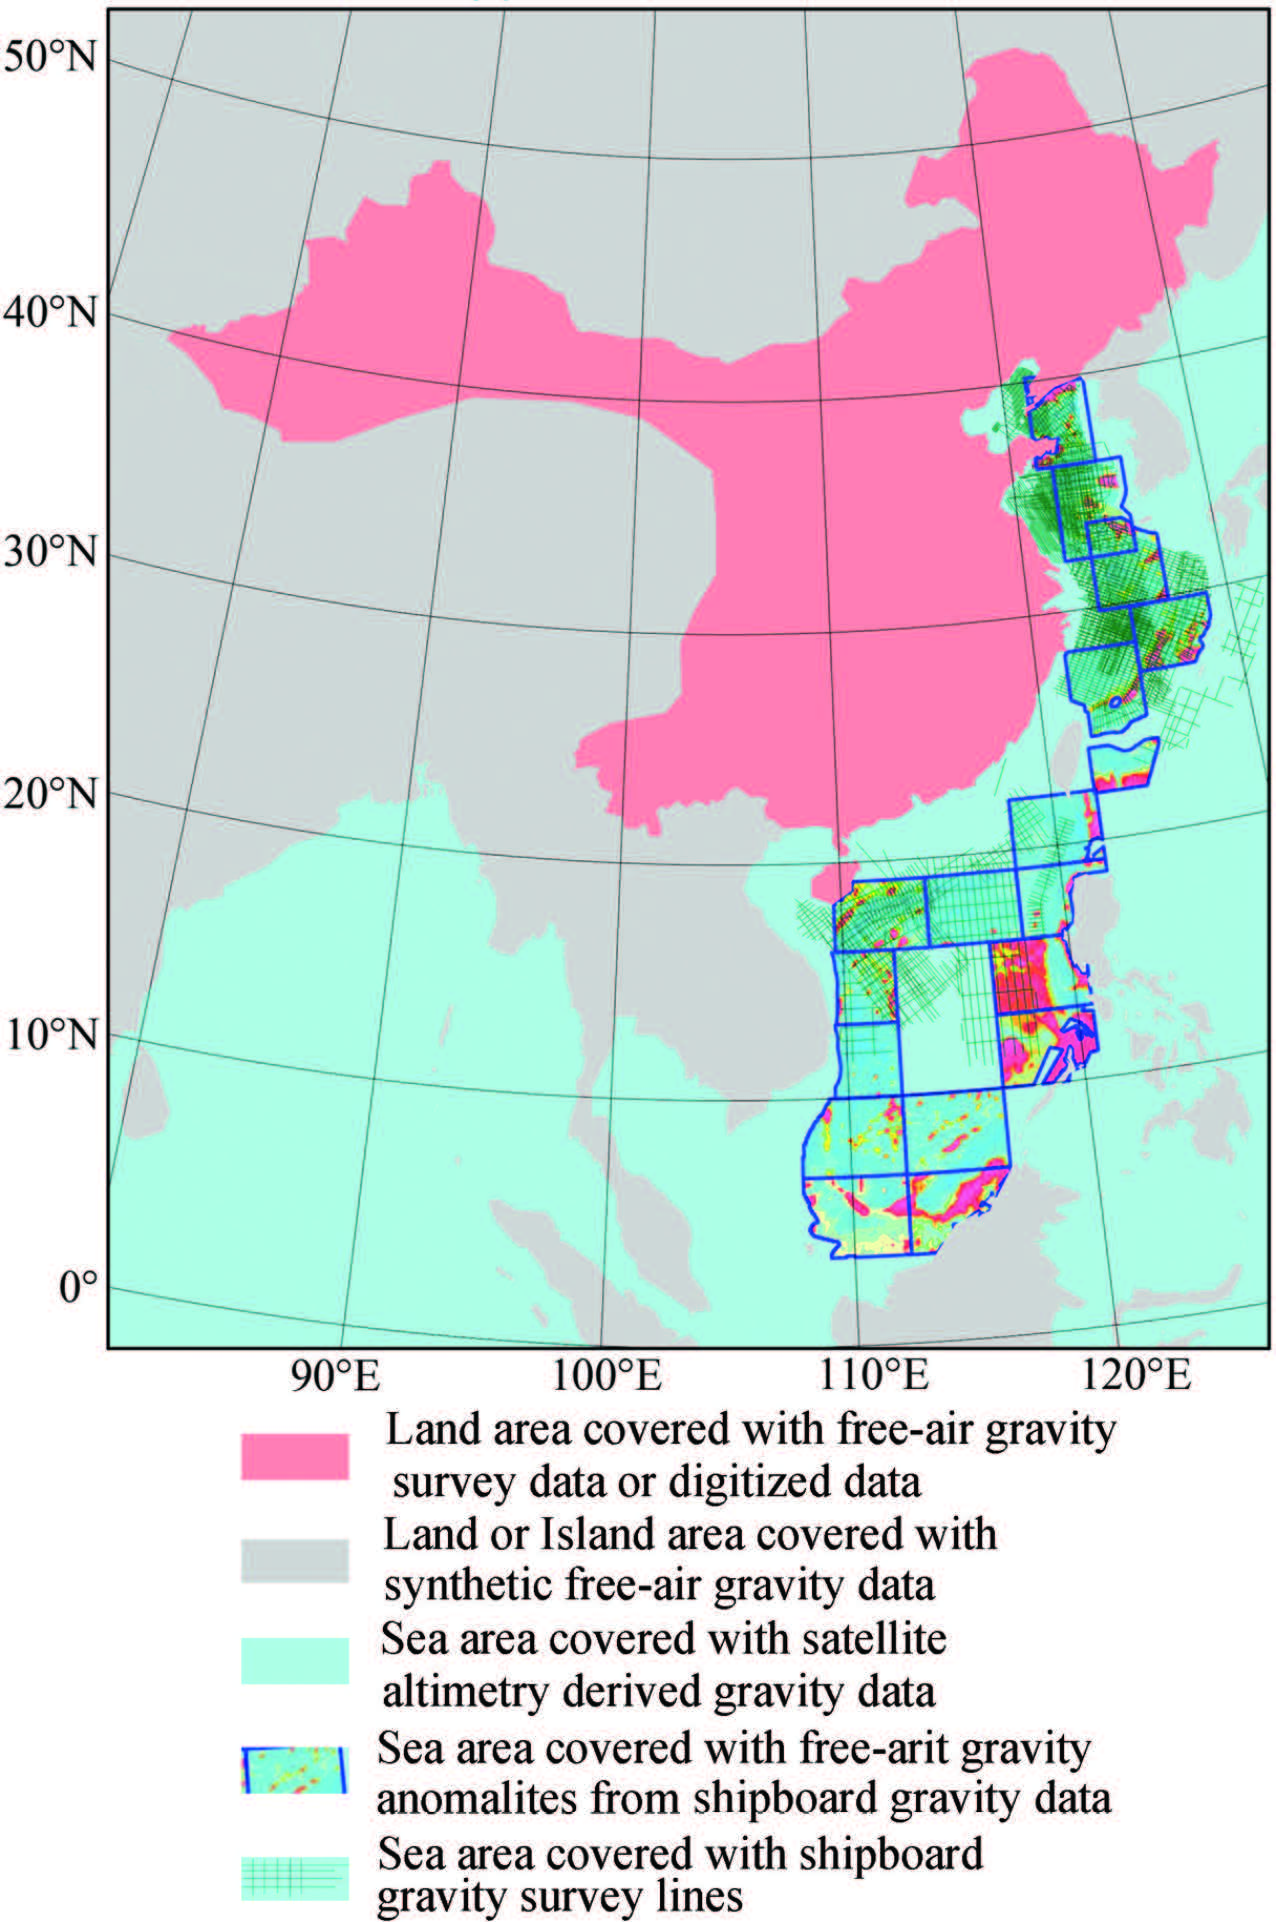
Free-air gravity anomalies on the earth refer to the differences resulted from the following calculation: making height correction to the measured gravity values on the earth’s surface to reduce to the geoid, and subtracting the value of the normal gravity field from this reduction value. In theory, free-air gravity anomalies are generated by non-uniform distributions of density in crust and upper mantle, reflecting the differences of shape and mass distribution between the real earth and the geodetic ellipsoid. As basic information of the potential field of the earth, free-air gravity anomalies are the important research object and terms of many disciplines including geodesy, geophysics, geology, seismology, and oceanography. In 2008, China Geological Survey initiated the project of preparing map series at a scale 1:5201406100 of geology and geophysics in China mainl and and seas and adjacent areas. The free-air gravity anomaly map is one of this series. It is a summary and display of results of geological and geophysical surveys in the last two decades after the publication of the map series of geology and geophysics in China mainl and and seas and adjacent areas in 1993(Liu, 1993). Compared to the previous work, this map covers a larger area, encompassing the whole China mainl and , Chinese seas and adjacent l and s and seas(Fig. 1).
|
Fig.1 Mult-source gravity data distribution in the mapping area |
From the late 1980s, in addition to ground-measured data, gravity data from satellite altimetry have widely used in map preparation for sea areas such as in the United States, Canada, Great United Kingdom, and Australia(GSC, 1998; Falvey, 2001; Chacksfield and Kimbell, 2006; Bacchin et al., 2008; USGS, 2013). The release of high-accuracy terrain data and high-degree earth gravity models makes it possible to obtain free-air gravity anomalies through calculation for those l and regions where ground measurement is difficult to conduct due to complex terrains(Becker et al., 2009). The complete coverage of satellite altimetry gravity data and earth gravity models provide the platform and reference for adjustment between different data. Thus, application of multiple-source data to preparation of gravity maps has become a trend in the world.
2 GRAVITY DATA OF MULTIPLE SOURCESThis map preparation used various kinds of gravity data which have varied accuracy and resolution. These data have different distributions on the map prepared, of which some are overlapped each other. It determines the nature of multiple sources of data as well as the necessity for data comparison.
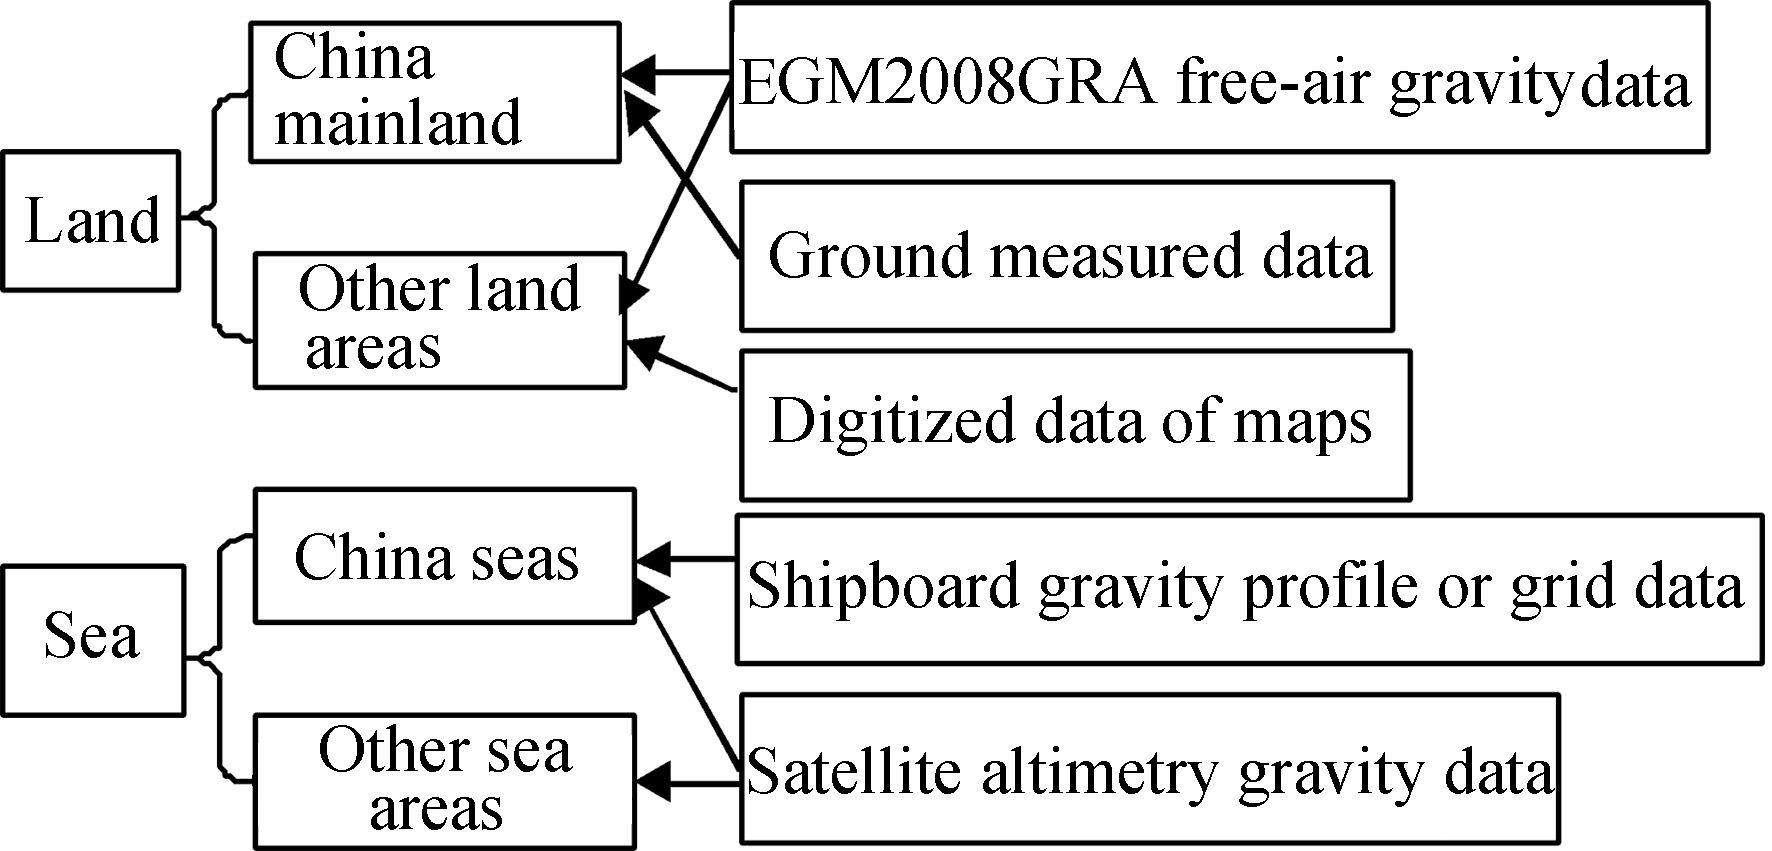
Figure 1 displays the collected data. Of them, the data of the EGM2008 gravity model cover all the l and or isl and areas of the map range. For China mainl and , there are free-air gravity anomaly data from regional gravity surveys. For China Taiwan and India subcontinent, the available data include digitalized data of published free-air gravity anomaly maps. Satellite altimetry data cover all the relevant sea areas, of which partial regions have free-air gravity anomaly data from ship-board surveys including some gridded results. Figs. 1 and 2 show the distributions and relations of multi-source gravity data.
|
Fig.2 Structural diagram showing relationship of the muti-source gravity data |
The earth gravity field model is the assemblage of basic parameters to describe and express the gravity field of the earth, which is the approximation or integration of the earth gravity field. At present, the most widely used global super-high-order earth gravity field model is EGM2008 that was released by the US National Geospatial-Intelligence Agency(NGA)in April 2004(NGA, 2008). This model was constructed based on the large-scale measured gravity data and satellite altimetry gravity data throughout the world as well as synthetic gravity data using new technology. Its spatial resolution is about 5 minutes(9 km)with accuracy less than 2~10 mGal(Pavlis et al., 2006, 2008a, 2008b). As it did not use the measured data in China mainl and and adjacent areas, the data of this model for these regions are of low accuracy. We have compared the measured 10 km-grid free-air gravity data in China mainl and with those derived from this model(Yang et al., 2012). The results show that for 80% of the whole China mainl and , the accuracy of the EGM2008 model is better than 10 mGal; while for other regions with complex topography it has low accuracy; especially in the Tibetan plateau, the st and ard error between the model and measured data is as large as 52.05 mGal. Because of sparse sites of real measurement, the measured grid data cannot express the gravity field accurately. Although the model data have many details, their accuracy is difficult to evaluate. Thus we suggest to invert free-air gravity data from Bouguer gravity data as a supplement for such areas or those without any data.
3.2 Synthetic Average Free-Air Gravity Data for the Tibetan PlateauWhen constructing the EGM2008 gravity model, NGA used the long-wavelength gravity anomalies from the model EGM96 and calculated in terms of the low-order spherical harmonic coefficients of the GRACE satellite gravity field model, as well as the short-wavelength gravity anomalies calculated by high-accuracy Residual Terrain Model(RTM), both of which were added to generate average free-air gravity data. Although this approach avoided the defects in the previous method that adds the terrain gravity effect to the isostatic gravity effect based on any isostatic hypothesis and greatly improved the conformity between model gravity data and measured gravity data, the final results remain much different from ground-measured data in areas of complex terrains. Because this method can merely improve modeling of the gravity field of short-wavelength signals, while the source of real free-air gravity anomalies comprises terrain mass, geologic mass and compensation mass, thus the calculated long- wavelength gravity anomalies do not completely correspond to the compensation mass, especially cannot represent the gravity effect of geologic mass. To solve this problem, we propose a method to invert average free-air gravity anomalies using Bouguer gravity anomalies. Bouguer gravity anomalies are resulted from applying terrain correction and middle layer correction to free-air gravity anomalies, which are poorly correlated with local terrains, so containing the gravity effects of both the geologic mass and compensation mass. It can be described as follows:

In areas with complex terrains, it is not appropriate to use directly measured free-air gravity anomalies to calculate their average values at grid nodes. Because it means that the Bouguer gravity anomalies at measurement sites and gravity effect of terrain mass are also gridded, resulting in W(△gB) and W(△gT). The terrain gravity effect depends on the terrain conditions around the measurement site(primarily within 0~20 km range). As such terrain conditions differ much, the terrain gravity effect is highly variable in its amplitude, which is difficult to control by gridding errors. We can employ the gridded Bouguer anomaly W(△gB), which is little correlated with terrain, and formula(2)to calculate the free-air gravity anomalies at nodes, so that the influence from surrounding terrain can be avoided.

In terms of the methods aforementioned, we have obtained free-air gravity anomalies in the Tibetan plateau(Figs. 3c and 3d).

|
Fig.3 (a) Ground measured gravity points in the Tibetan Plateau (base map is topography, black points represent the location), (b) EGM2008 data, (c) Ground measured gravity grid data, (d) Synthetic free-air gravity data |
We have compared the synthetic free-air gravity anomalies from inversion of measured Bouguer gravity anomalies and measured free-air gravity as well as EGM2008 free-air gravity anomalies. The results show that at 14106 sites, the st and ard and mean square deviations between interpolated ground measured data and synthetic data are -22.45 mGal and 28.27 mGal, respectively; while those between the synthetic data and model data are -2.17 mGal and 23.78 mGal, respectively. In the comparison above, we had only position data rather than measured free-air gravity anomalies at these sites, and we used the 10 km grid data to perform interpolation for approximate values needed. Consequently, our estimation on the accuracy of model data may be lowered(Yang et al., 2012). Nevertheless the comparison of three kinds of data can provide us with some information. The synthetic free-air gravity data bear a better resemblance to model data and smaller mean square deviations with measured data or slightly higher precision. So when we cannot use spatial grid data for map compilation and cannot evaluate accuracy of model data, it is an optimal choice to use the synthetic average spatial data from inversion of Bouguer gravity data.
For the l and and isl and s areas outside China on the map complied, we employed the same method to produce synthetic average free-air gravity data.
3.3 Comparison of Satellite Altimetry Gravity Data from Varied SourcesIn recent years, with increasing orbit data of satellite altimetry and development and application of signal reconstruction techniques, the accuracy of satellite altimetry gravity data has been greatly enhanced and widely used in gravity mapping and tectonic research. The relevant well known data include the SS series(SS refers to two scientists, S and well D T and Smith W H F)released by the Scripps Institute of Oceanography, California University, San Diego(S and ewll and Smith, 1997, 2005, 2009), the DNSC08GRA serie and DTU series published by the National Space Agency of Denmark University of Science and Technology(Andersen and Knudsen, 2000; Andersen et al., 2010), and commercial product of Getech Company of UK(Fairhead, 2001). The widely used SS series data developed earlier and is easier to access, being most popular. The data of Denmark has high quality, with advantage particularly nearby coasts. So the NGA of the US has applied both the data when constructing the EGM2008 earth gravity model. So far, the SS series has been updated to V23.1 as of August, 2014. In 2010, Denmark published dataset DTU10. The SS series of V16.1 released in 2007 is similar to its V15.1 in 2005, except for data supplement for high-latitude areas. The SS series of V18.1 released in 2008 has much better accuracy with respect to former versions, of which the data grid resolution was refined from 2 minutes to 1 minute, using the EGM2008 as the reference field to realize seamless transition between l and and sea. Afterwards, from SS V19.1 to SS V20.1, the latest altimetry data fill the blank areas such as the polar regions, with the accuracy equivalent to SS V18.1 as a whole. With the addition of three new satellite altimetry data, the data series released after SS V20.1 improve a lot both in accuracy and resolution. Andersen et al.(2010)made a statistics to the comparison of 321400 shipboard gravity data with satellite altimetry gravity data acquired in varied years. The results show that the calculated mean square deviations between both data around the year 2000 are generally greater than 5mGal, while those using DNSC08GRA and SS V18.1 are less than 4mGal, meaning accuracy improvement of more than 20%. While for coasts and polar regions, the accuracy of satellite gravity data is enhanced by as much as 40%~60%(Andersen et al., 2010).
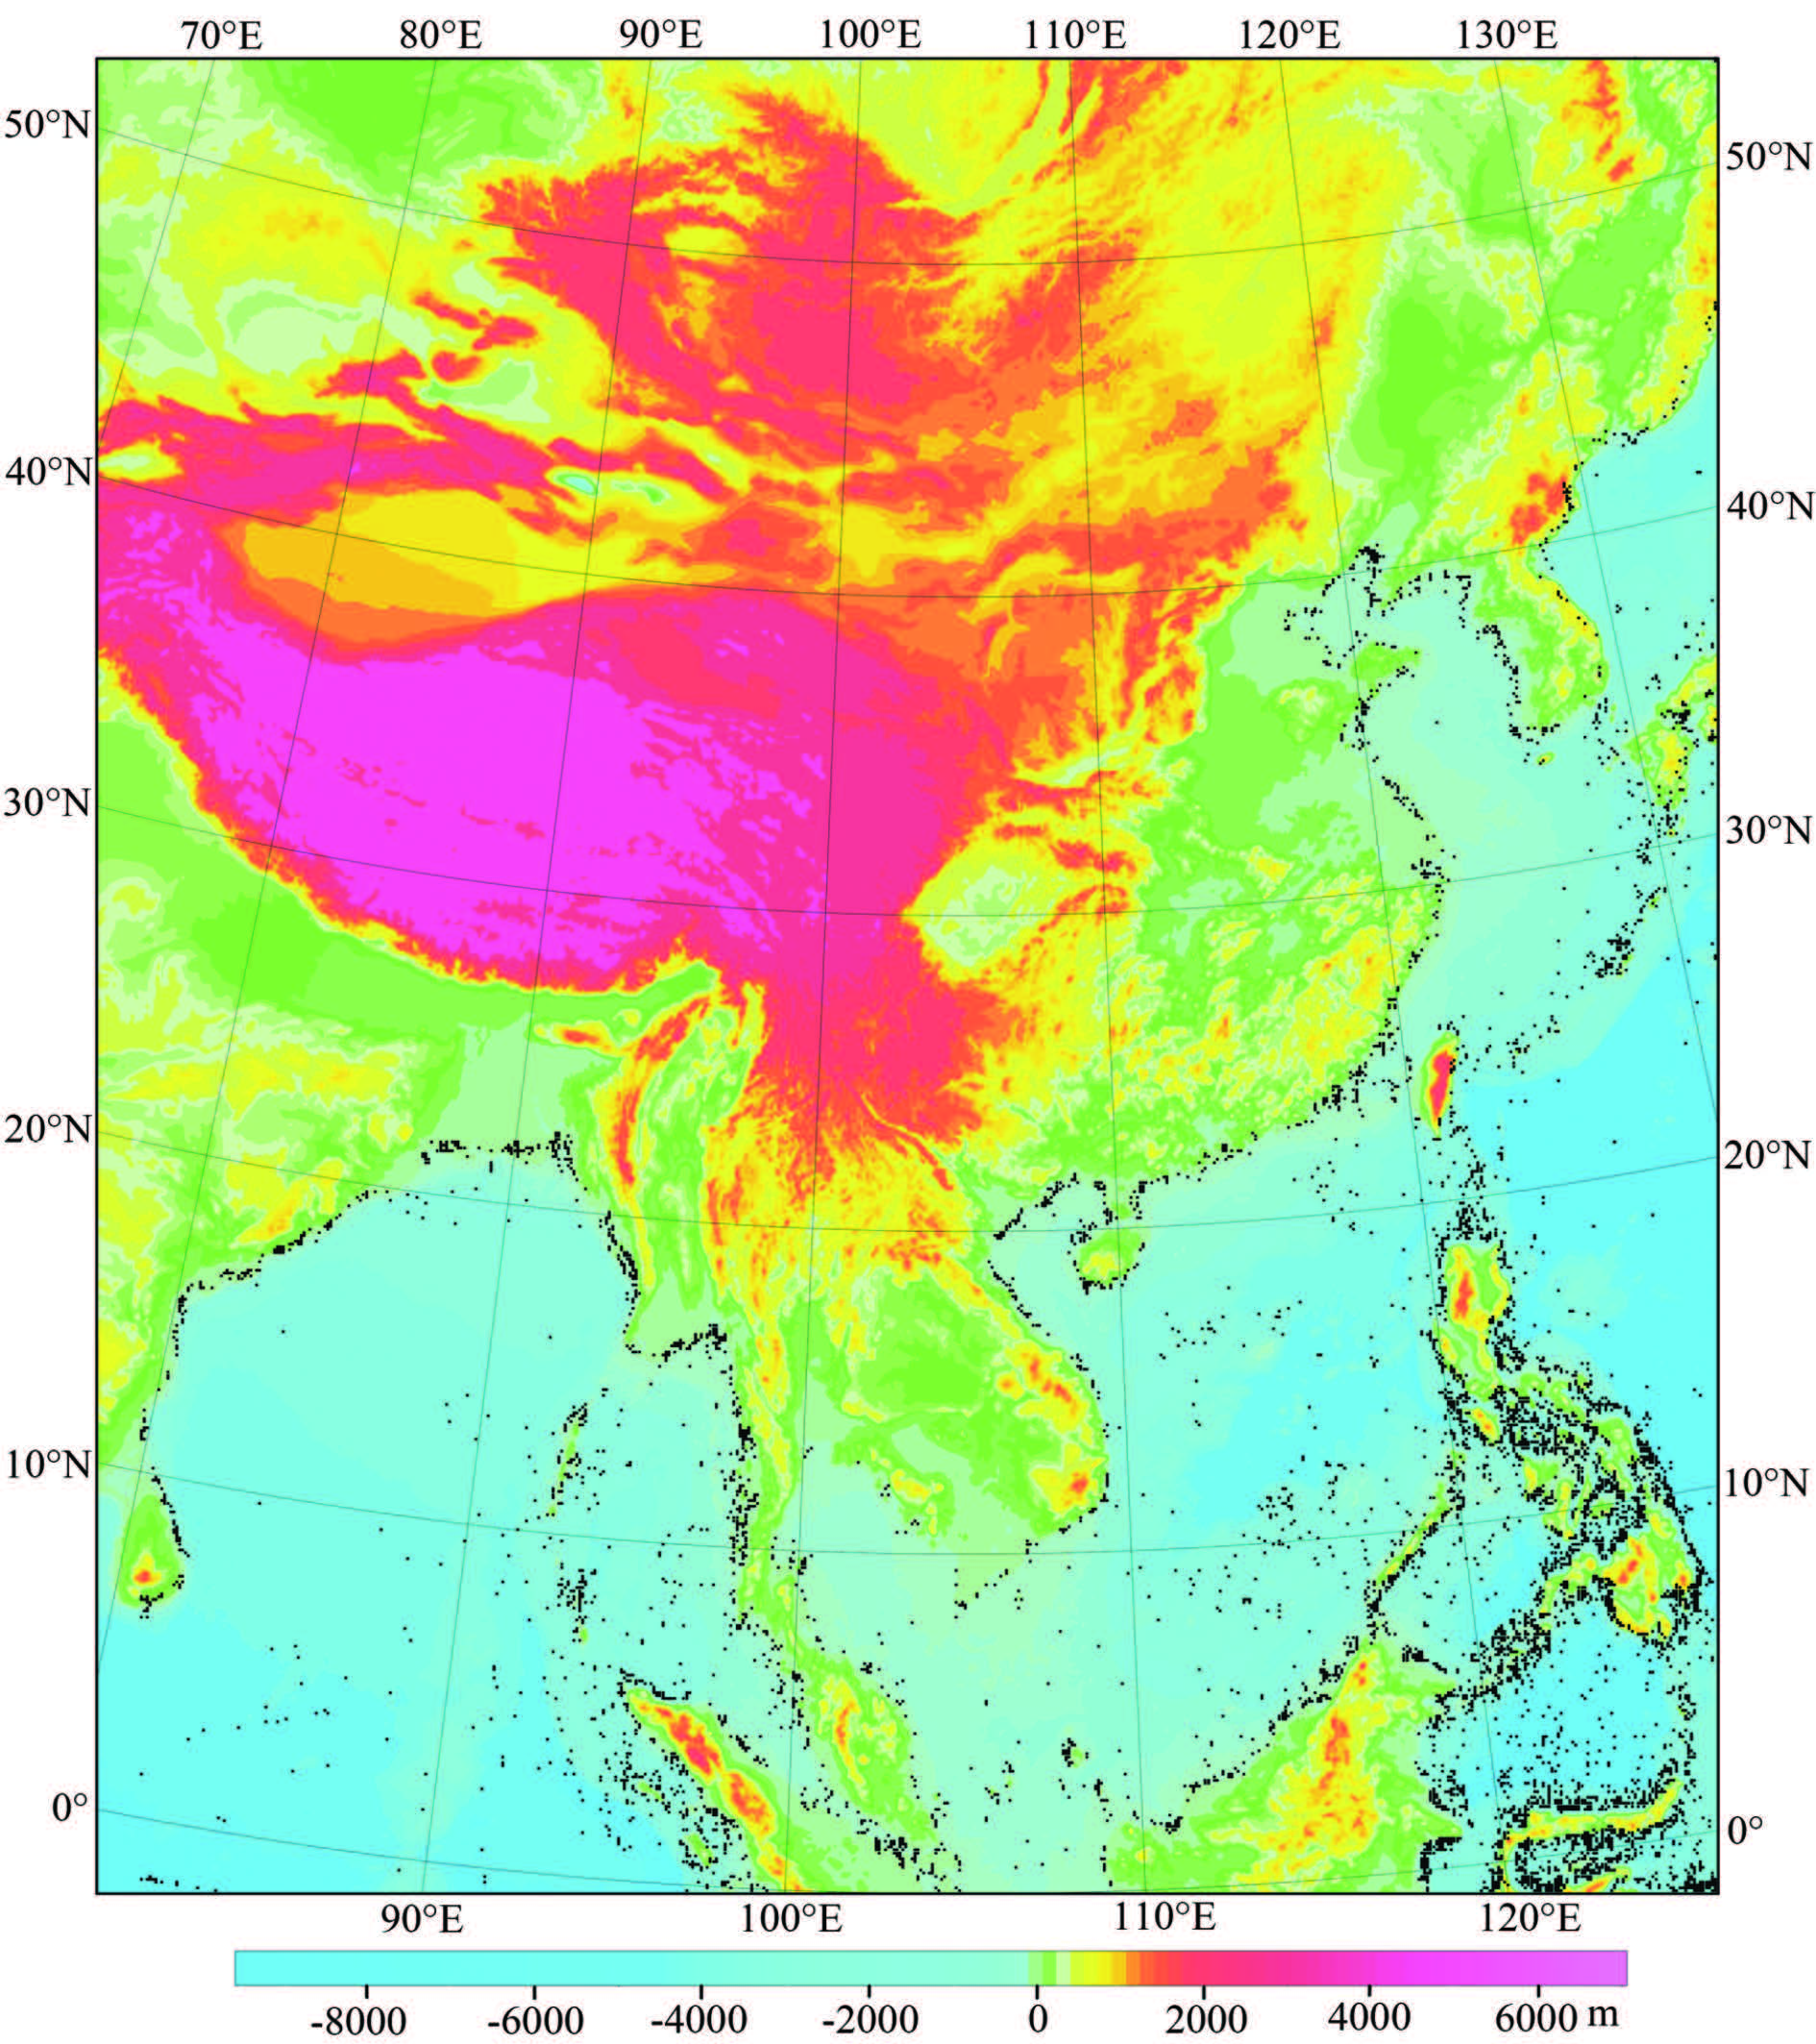
During our map compilation, we have compared the free-air gravity anomaly data from SS V18.1 and DNSC08GRA. Both data were gridded with spacing 10 km×10 km, and values at 123701 grid nodes were calculated for each. The comparison shows their average deviation is 0.033 mGal and st and ard deviation is 3.17 mGal, respectively. If we take the 3 times of the st and ard deviation as the criterion for distortion, the distorted grid nodes total 2243 in number. After removal of these nodes, the st and ard deviation is reduced to 2.28 mGal. By repeating in such a way, when 6040 distorted nodes(accounting for 4.9% of the entire data, their positions are shown in Fig. 3)are eliminated from data, the st and ard deviation declines to 1.92 mGal and no distorted points found again.
Data analysis shows that the free-air gravity of SS V18.1 and DNSC08GRA have a great resemblance, almost no systematic differences between them, and only st and ard deviation 1.92 mGal after removal of distorted points, implying consistent accuracy. As displayed in Fig. 4, those distorted points of gravity are primarily distributed in the areas with highly variable water depth, closely related with terrains there, such as trenches, troughs and isl and s. While a few distorted points appear in continental shelf and slope areas. Similar distorted points are prevailing in offshore areas, likely related to the tidal effect, which can explain why satellite altimetry gravity data in these areas have low accuracy.
|
Fig.4 Map showing grid points with difference values of free-air gravity anomalies larger than 3 times the standard deviation between SS V18.1 and DNSC08 gravity data (base map is topography, black points reprecent point locations) |
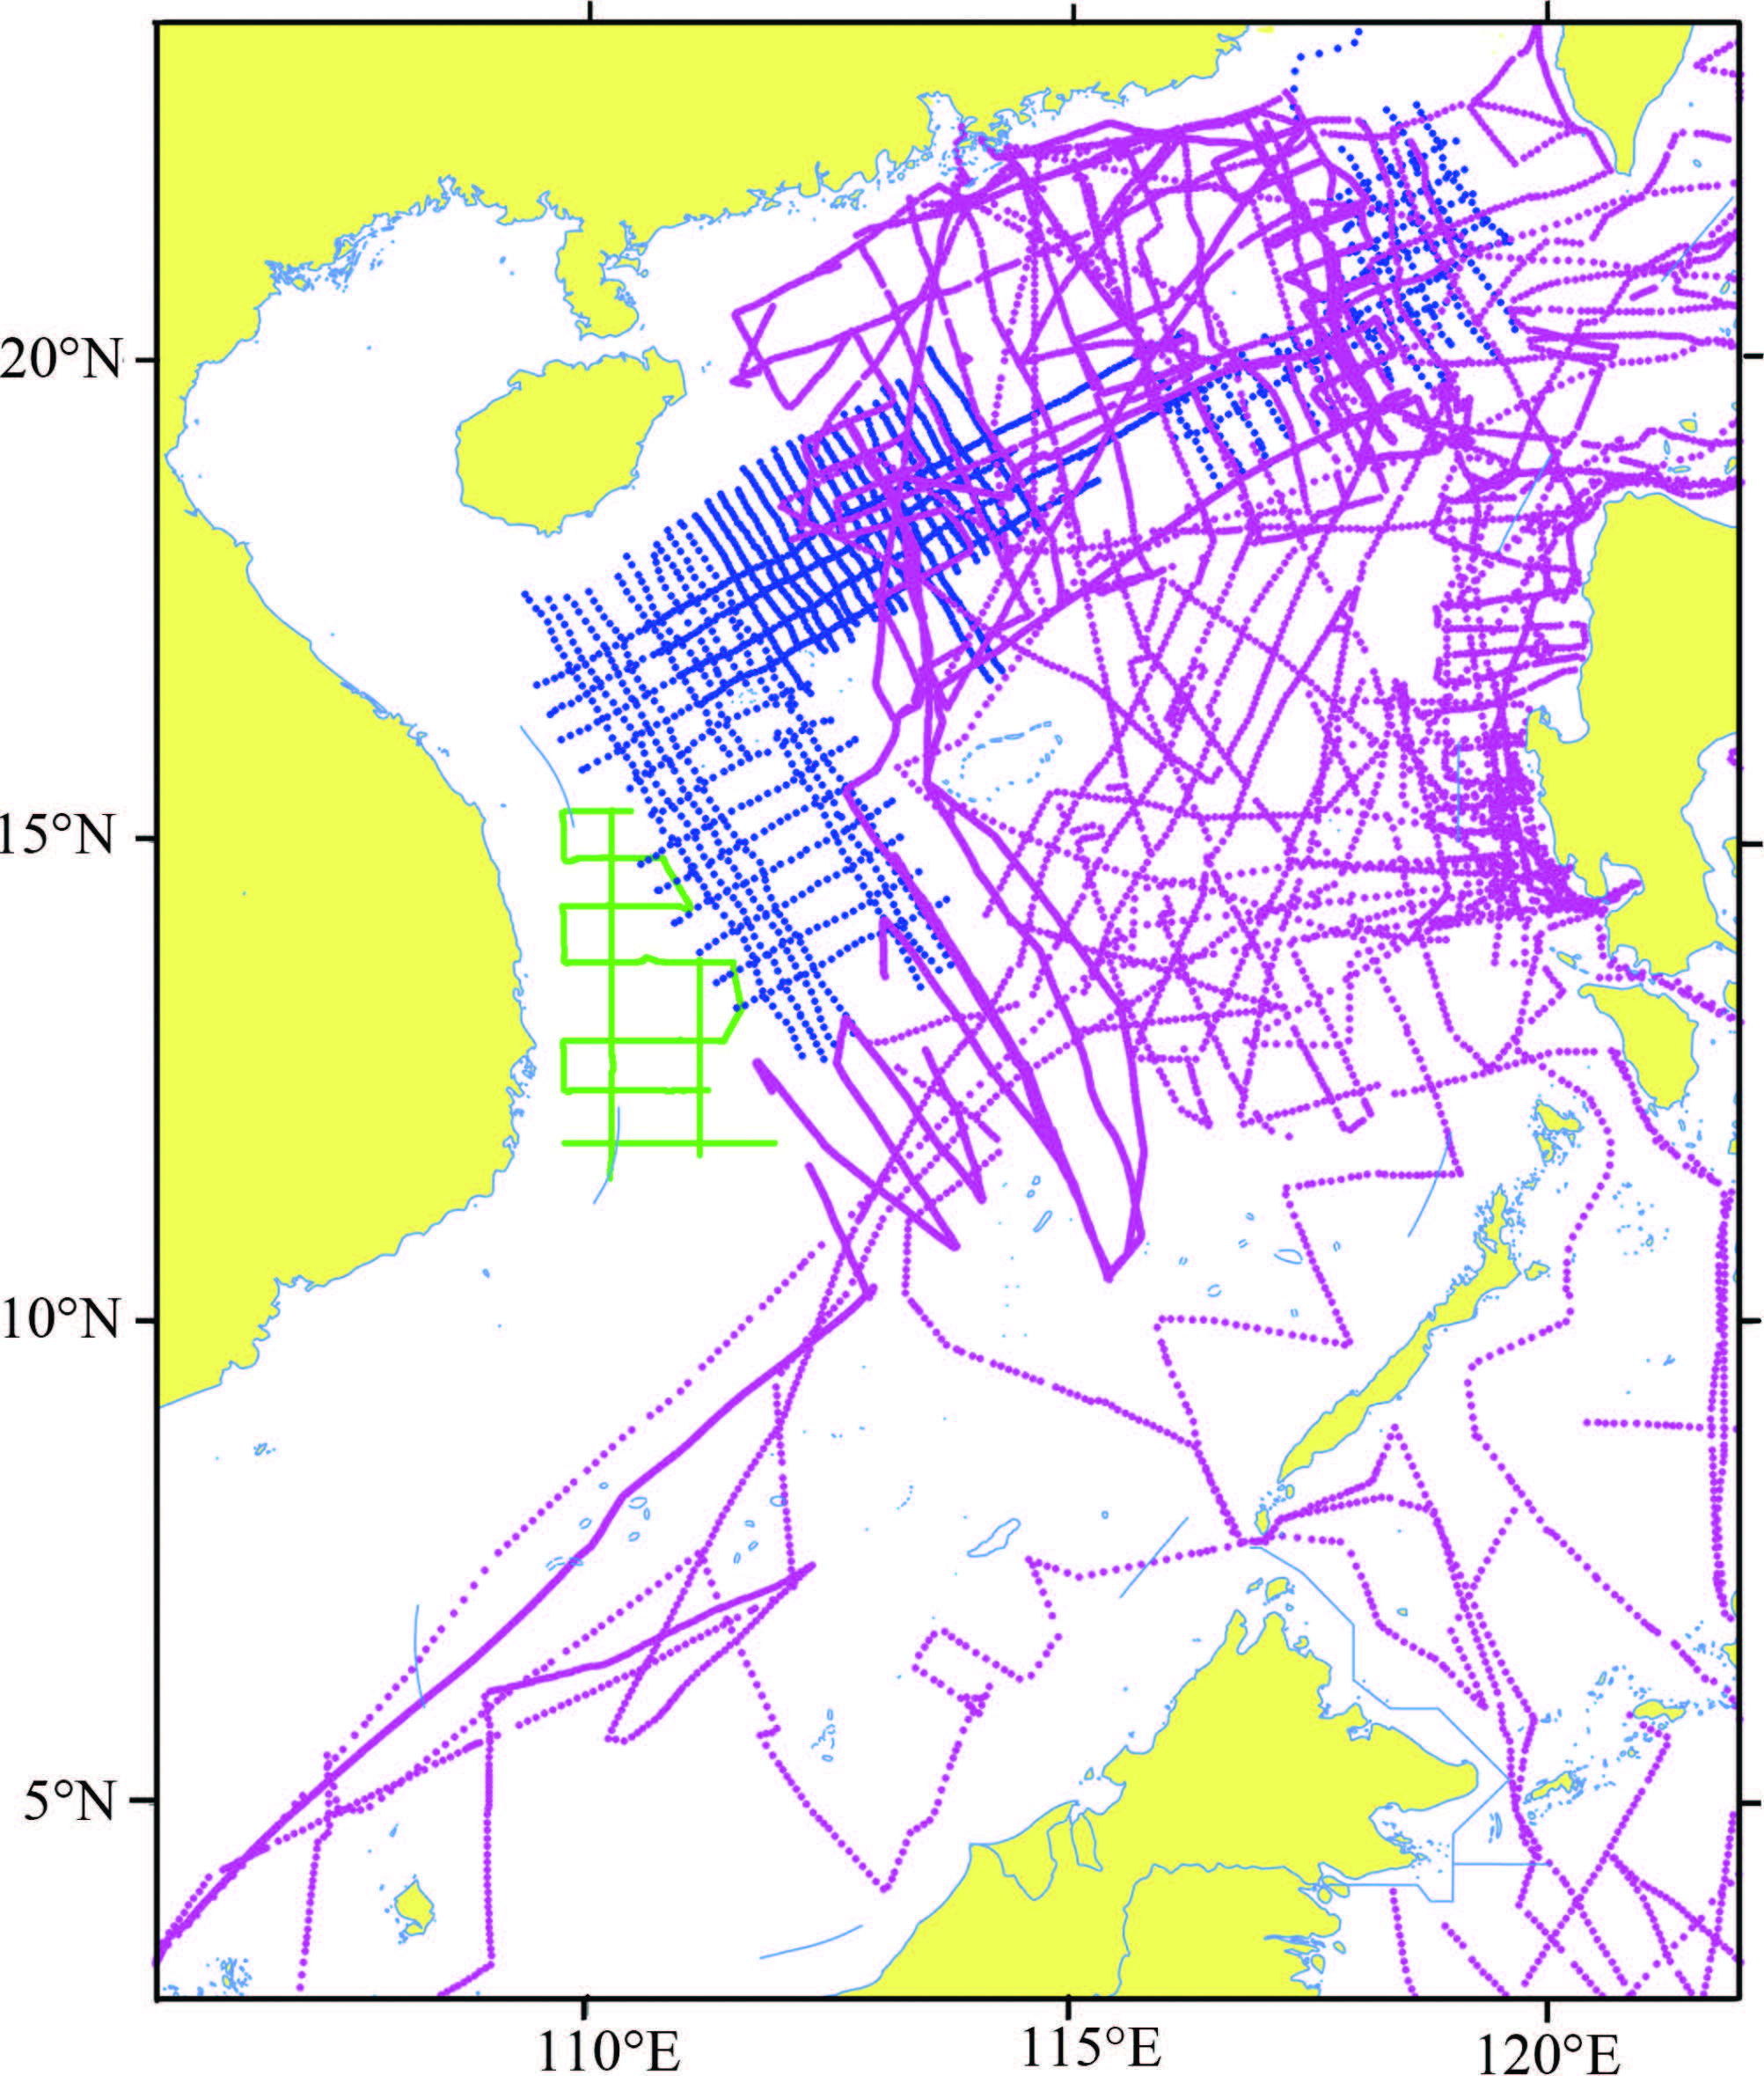
For better analysis of the role of satellite altimetry gravity data in map compilation, we developed a STD analysis method for independent three measurements which permits comparison of satellite altimetry gravity data of varied versions and shipboard gravity data. The accuracy and stability of this method have been verified by noise experiments(Yang and Zhang, 2008). Using this tool, we have compared shipboard gravity data from three surveys in the South China Sea(Fig. 5) and three kinds of satellite altimetry gravity data. The systematic and st and ard deviations between them are listed in Tables 1 and 2.
|
A (green lines): Gravity survey in the southwest Xisha area in 1993; B (blue lines): Gravity survey by the second marine survey in 1983-1985; C (purple lines): Gravity survey by Lamont-Doherty geological Observatory in 1980, data is from NGDC website. Fig.5 Shipboard gravity survey track lines in the South China Sea |
| Table 1 Comparison of system errors between different satellite gravity data and shipboard gravity data in the South China Sea (mGal) |
| Table 2 Comparison of standard deviation between different satellite gravity data and shipboard gravity data in the South China Sea (mGal) |
As shown in Table 1, the satellite altimetry gravity data of varied versions have a common level system. The sea-measurement data and satellite altimetry data tend to have systematic deviations. Thus satellite gravity data can be used as the platform for shipboard gravity data. Table 2 lists the three measurements consisting of data from each survey and two different satellite altimetry data. In terms of the STD analysis method aforementioned, we calculate the st and ard deviation of each kind of data to reflect the divergence degree of data, by which we can further evaluate its accuracy. The results show that the st and ard deviations of one kind data from decomposition by different data combinations are stable. For the South China Sea, the accuracy of SS V18.1 and DNSC08GRA data is much better than SS V16.1. Compared with satellite gravity data, st and ard deviations of the sea-measurement data are all greater than 4 mGal, which are likely due to the early ages and low positioning accuracy of shipboard measurement in the sea. Of them, the accuracy of survey A and B is roughly identical, while that of survey C bears the poorest accuracy, which is presumably associated with a wealth of data recorded during ship turn-round periods. On the other h and , the sea-survey lines have dense sampling sites, thus higher resolution than satellite data. If both the sea-survey and satellite altimetry data are compared on a same planar grid, such as the 20 km grid interval in our 1:5201406100 map compilation, then the latter exhibits its advantages of larger coverage and better data consistency, which allow to meet the requirement of small-scale mapping in either resolution or accuracy of data.
4 SCHEME OF DATA USAGEThrough detailed analysis and comparative studies on the nature and accuracy of gravity data from multiple sources, in conjunction with experiences of map preparation in China and elsewhere in the world, we determined the scheme of data usage as follows: Using the EGM2008 earth gravity model as the reference platform, gridded data of ground measured free-air gravity anomalies are used for most regions of China mainl and . For those areas with sparse data and without measurement include some l and areas and isl and s, we generate synthetic average free-air gravity anomalies by inversion of Bouguer gravity anomaly data. For sea areas, ship-based gravity data are utilized as much as possible, meanwhile satellite altimetry data are fully employed as supplement to those blank realms.
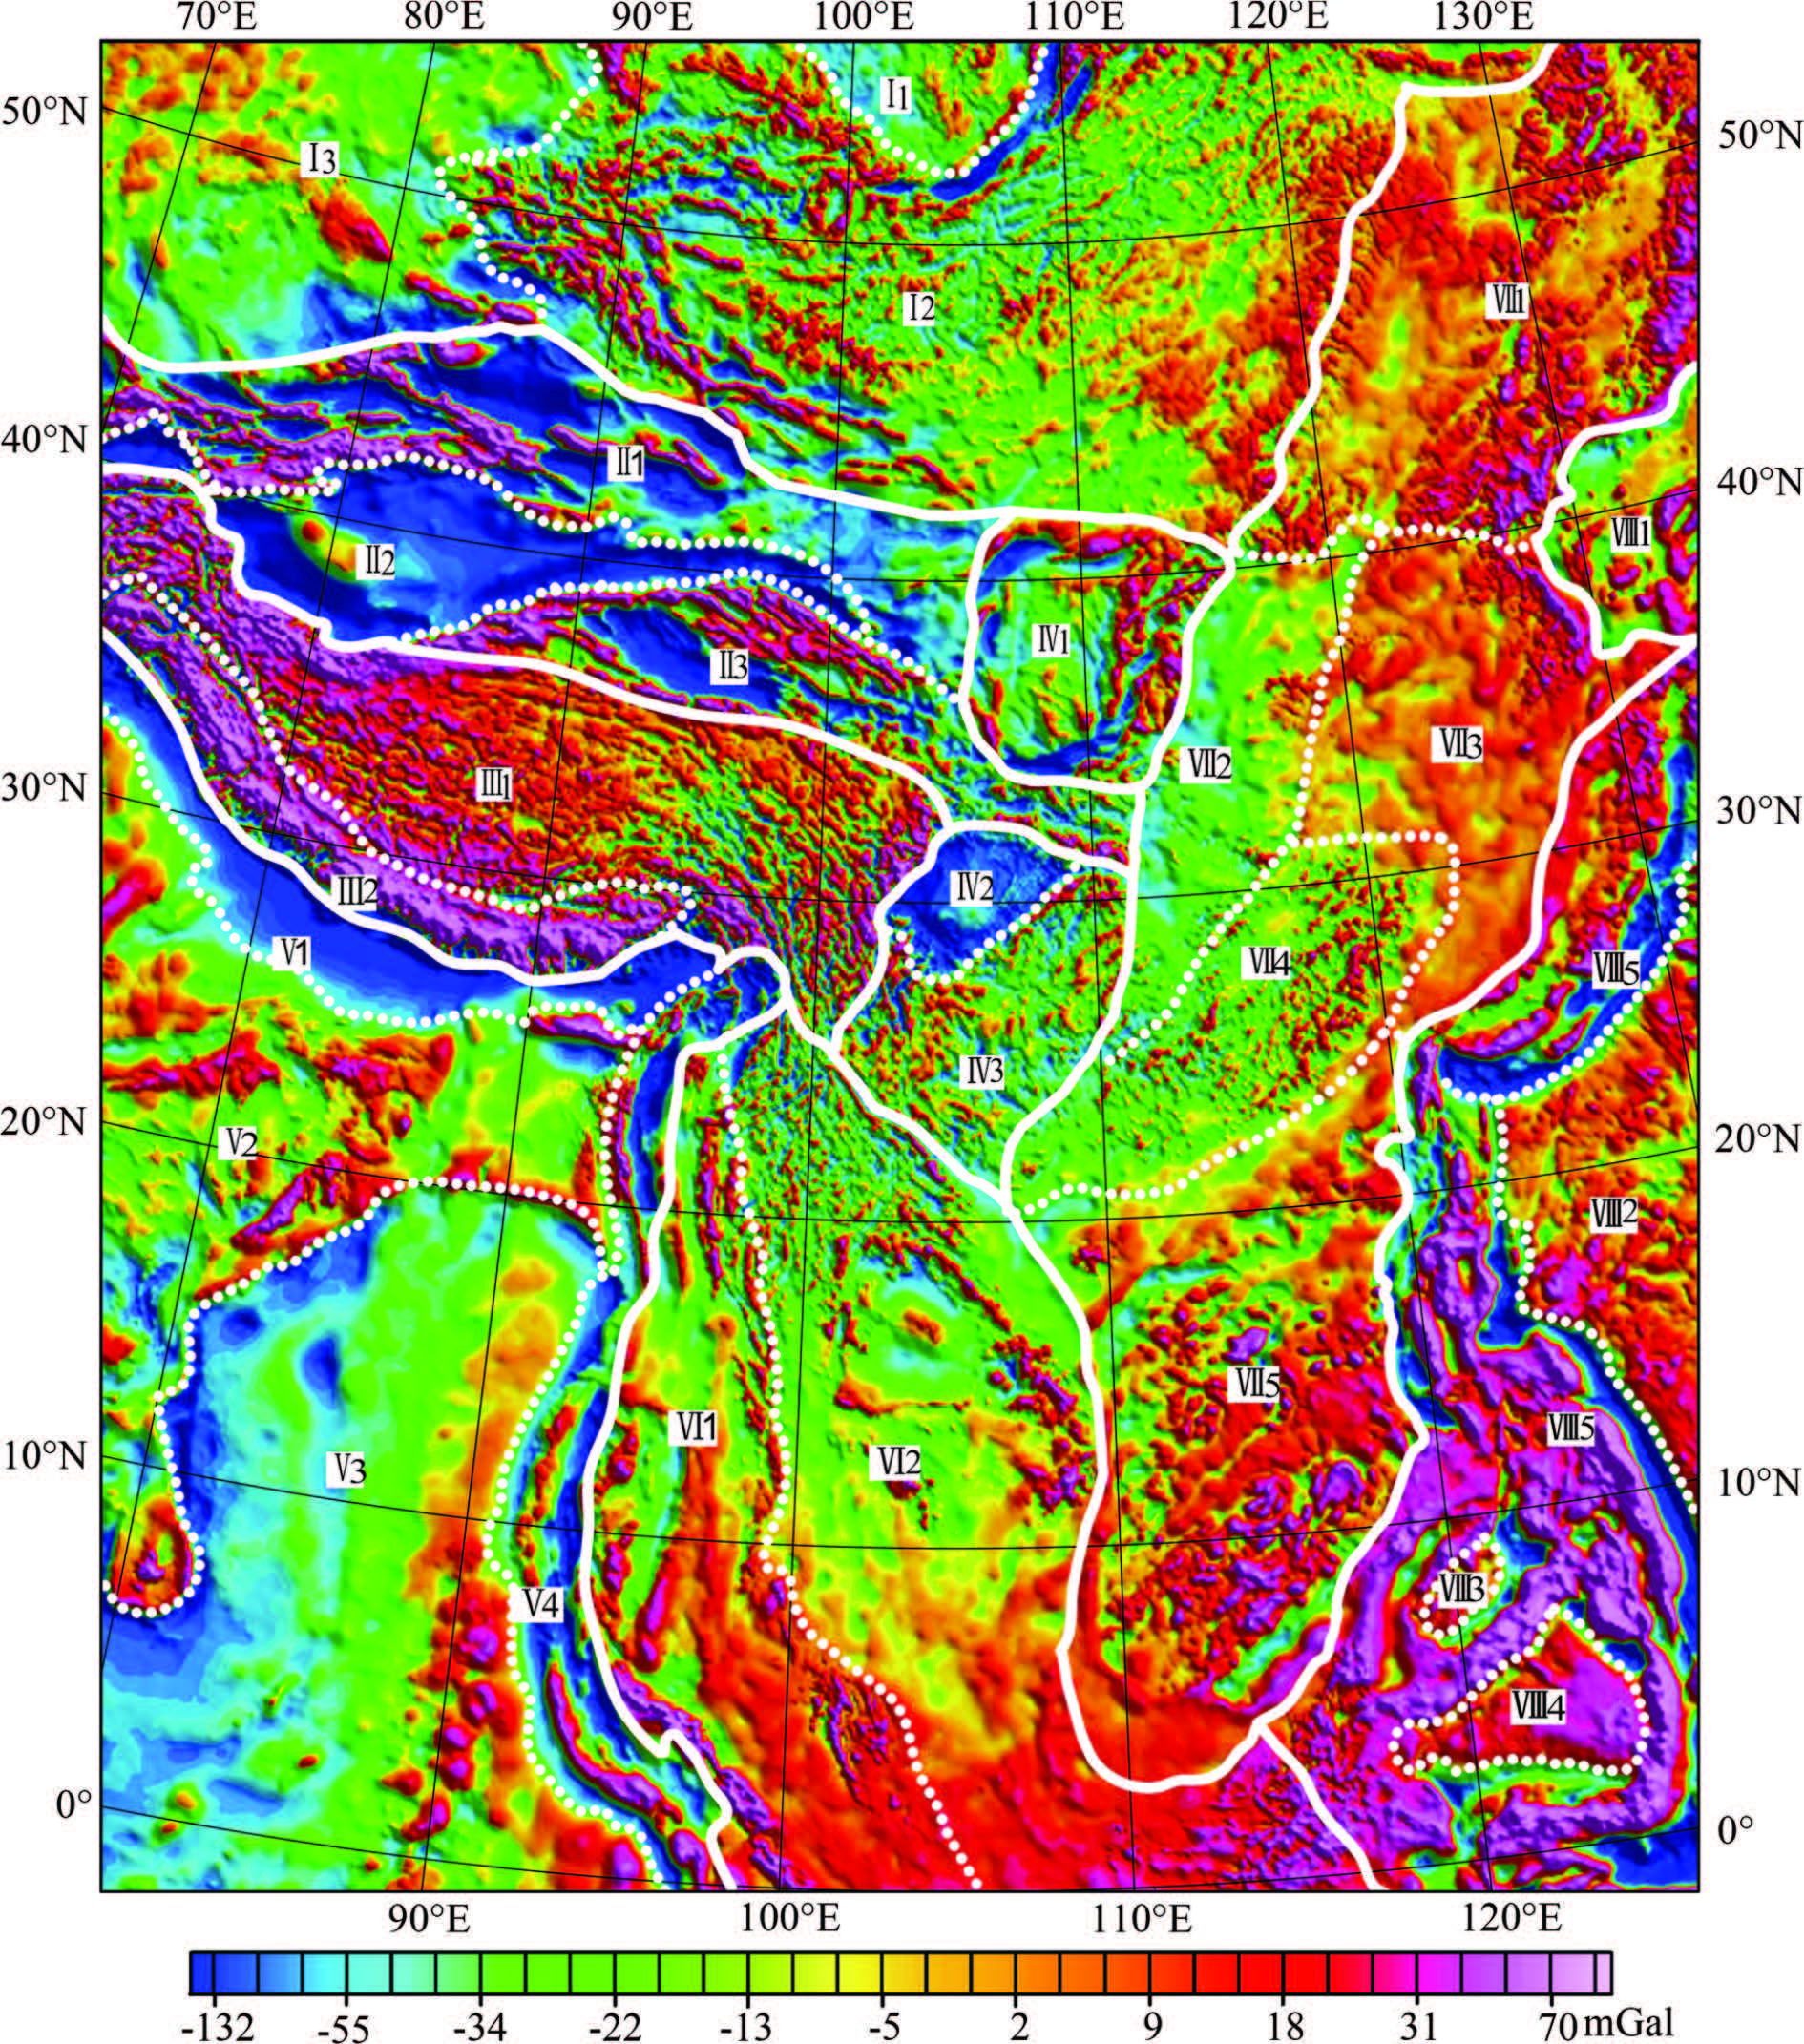
5 INTERPRETATION OF FREE-AIR GRAVITY ANOMALIESWe have conducted 20 km×20 km gridding to adjusted gravity anomaly data from multiple sources, and used an artificial sun-angle “illumination” for 3D color-shaded relief effect to generate an 1:5201406100 gravity anomaly map of China mainl and and seas and adjacent areas(Fig. 6). Free-air gravity anomalies are superposed effects of terrain mass, geologic mass and isostatic mass. The terrain effect is the gravitation produced by mass above sea level on the measurement site. Because of small distances between mass points and measurement sites as well as big density difference between air and rock, the terrain effect has a huge value that can seriously interfere with the geologic information of the subsurface. Free-air gravity anomalies are highly correlated with terrains. In the areas with gentle terrains(width of topographic relief is greater than 10 times the compensation depth), free-air gravity anomaly data can be used for crustal isostatic research. But the terrain effect is actually also a tectonic relict. Free-air gravity anomalies are the integrated expression of many tectonic movements in geologic history. Recent tectonics and lithospheric structure have more visible signatures on the free-air gravity field. The theory of block tectonics suggested by Liu Guangding divides the development history of China’s tectonics into two stages and two regimes. Bounded by the Indosinian epoch, the history before it is the ancient global tectonic stage; and that after it, i.e. Mesozoic and Cenozoic, is new global tectonic stage(Liu et al., 1997; Liu, 2007; Zhang et al., 2009). The latter has clear signs on the free-air gravity anomaly map, which were left by tectonic movement driven by plate motions. They are particularly obvious in eastern China, abutting the margin of the Pacific, and western China where the India plate is subducted beneath Eurasia.
|
Fig.6 Map of free-air gravity anomalies and the gravity field division in the land and seas of China and ajacent areas |
Within the free-air gravity anomaly map, 95% of anomaly values are in the range of -110~110 mGal, among which maximums tend to be accompanied by minimums that are present in areas with extremely large topographic relief. Most maximums of the anomalies are distributed on north and south side of the Tibetan plateau, as well as at mountain ridges such as the Tian Shan Mountains, Kunlun Mountains, and Himalaya Shan. While minimums are seen in the basins surrounding those mountains or along edges of plains. A few maximums appear on isl and s between the South China Sea and Philippine Sea, such as China Taiwan, Luzon, and Sulawesi isl and s. At trenches and troughs abutting these isl and s, such as the Philippine trench, Manila trench and Okinawa trough, there exist very low negative anomalies. For the entire map, the anomalies can be classified into two types. One is linear belts with long-strike, small width and big gradients. The other is wide areas with gentle gradients. Both correspond to two basic units in the theory of block tectonics: suture zone and block. Horizontally and vertically crossing linear anomaly zones characterize this free-air gravity anomaly map, which encompass those block-shaped anomaly areas. Centered at the axis from the Ordos basin to the Sichuan basin in the middle of the map, arc-like anomalies are distributed in the north, NW-trending anomalies dominate the west, NE-directed anomalies occupy the east, and nearly NS-oriented anomalies are present in the south. They reflect geomorphic differences caused by different tectonic settings, varied tectonic evolution histories of each area, and distinct tectonic properties.
Based on the features of free-air gravity anomalies, we use wavelet analysis to decompose these data in China mainl and and seas and adjacent areas. With reference to details of wavelets of each order, we divide the entire map into anomaly provinces with the Ordos-Sichuan axis, which include 8 first-order provinces and 27 second-order provinces(Table 3). These 8 first-order provinces are separated by first-order anomaly gradient zones which are “three horizontal lines and four vertical lines”(Table 4). Such anomaly provinces reflect the differences produced by terrains and l and forms as well as different structures of basements, covers, and deep crust.
| Table 3 Regional division of free-air gravity anomalies in the land and seas of China and adjacent areas |
| Table 4 First-order gradient belts of free-air gravity anomalies in the land and seas of China and adjacent areas |
In the west of the map, the Tibetan plateau surrounded by the Himalayan Shan and Kunlun Shan-Qilian Shan-Qin Ling-Dabie Shan gravity gradient zones, and the Malay Peninsula-Indo-China Peninsula encompassed by the Arakan-Sumatra-Java and East Indo-China Peninsula gravity gradient zones exhibit the features of subduction of the India-Austria plate beneath Eurasia, eastward movement of material, and southward extrusion by blocking of rigid blocks, jointly forming the tectonic domain affected by activity of the India-Australia plate. East of this tectonic domain, the Ordos-Sichuan-Yunnan-Guizhou anomaly province and gravity gradient zone in the eastern Indo-China Peninsula can be viewed as the anomaly transitional area. In the easternmost is the extremely remarkable gradient zone along Ryukyu-China Taiwan-Manila-Philippine-Sulu Sea-Sulawesi trencharc- basin with alternating positive and negative anomalies. West to this zone are NE-trending anomalies in eastern China, reflecting that this region is primarily affected by the westward subduction of the Pacific plate. These two anomaly provinces constitute the Pacific tectonic domain. Located between the India-Australia tectonic domain and Pacific tectonic domain, the Ordos and Sichuan-Yunnan-Guizhou areas form a transitional domain. Through the strike-slip faults in the eastern Indo-China Peninsula, the Malay-Indo-China Peninsula anomaly province also connects with the anomaly areas of eastern China. In the north portion of the map, the arc-like anomaly areas in Siberia and Kazakhstan, as well as those in Xinjiang and Qinghai of China are primarily the tectonic traces of the ancient regime because they are far away from the recent plate boundaries, affected little by the India and Pacific plates with respect to eastern and southwestern China.
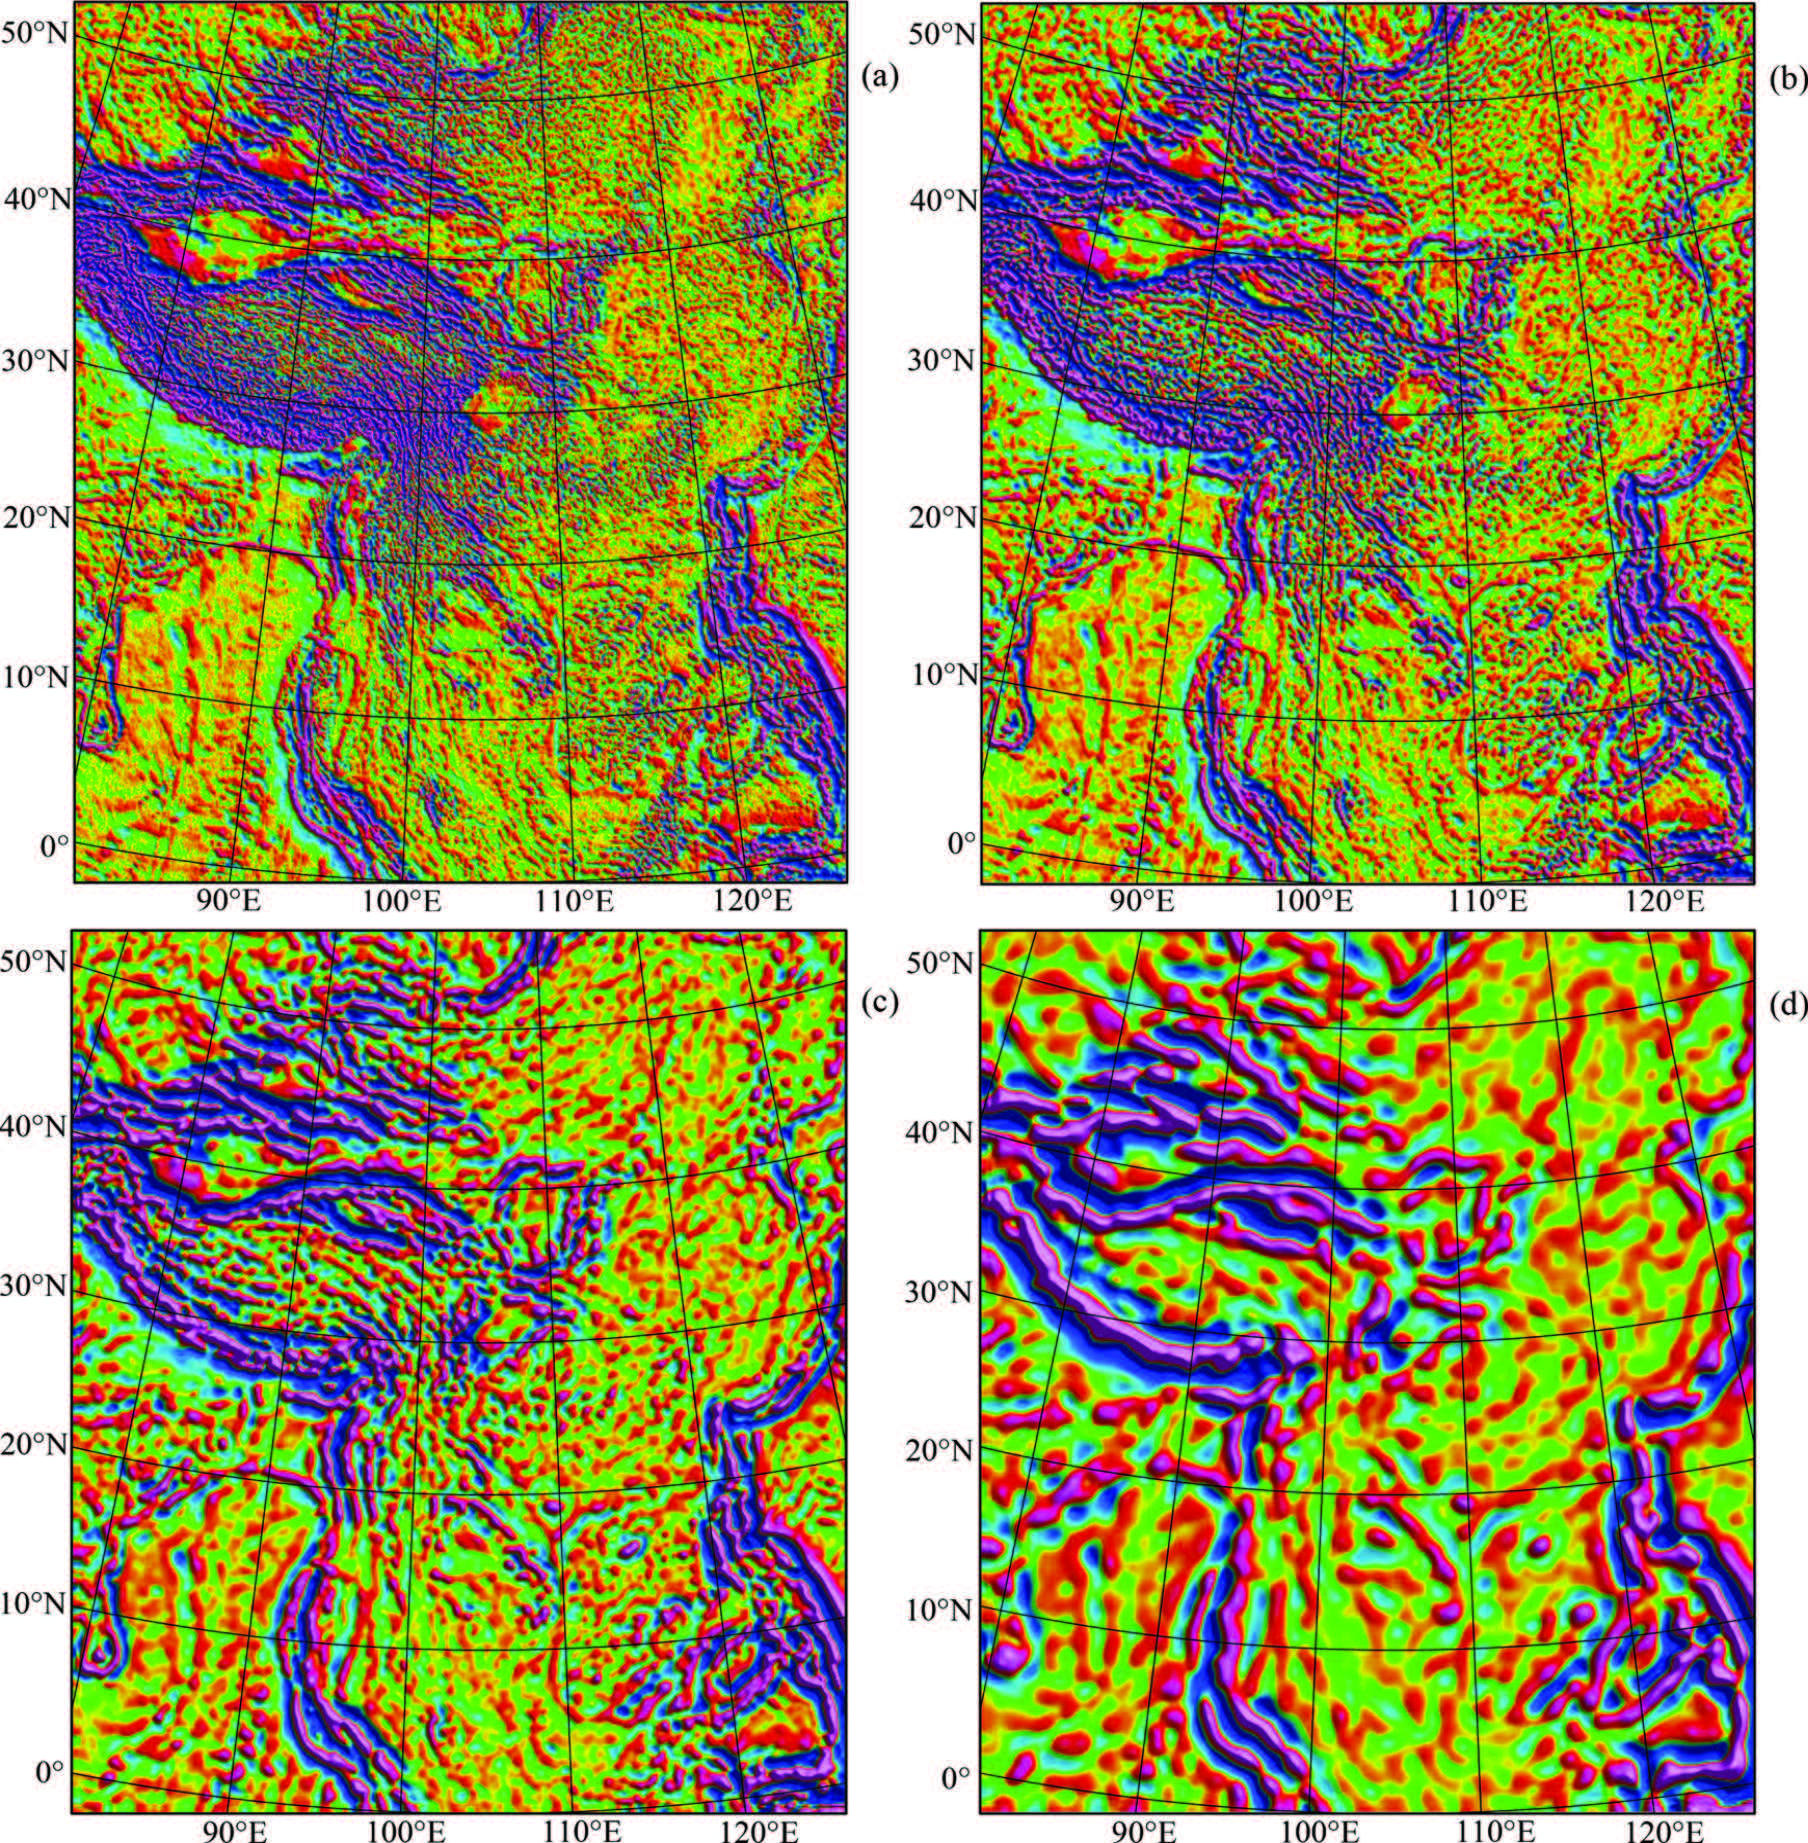
Some researchers have employed the wavelet analysis to decompose Bouguer or free-air gravity anomalies in China mainl and and part seas. Based on the resultant high-order wavelet details, they attempted to infer deep geologic structure, make tectonic subdivision of lithosphere and crust(Hou and Yang, 1997; Hou et al., 1998; Yang et al., 2001; Gao et al., 2000; Zhang et al., 2010), and discuss the implications of high-order wavelet approximation signals of free-air gravity anomalies to deep geology. In this work, relying on the details of wavelet transform, we identify and trace the important tectonic boundaries(Fig. 7).
|
(a) First order; (b) Second order; (c) Third order; (d) Forth order. Fig.7 First to fourth order wavelet transform details of free-air gravity anomalies in the land and seas of China and adjacent areas |
Due to major influence of terrains, the low-order wavelet details contain many short-wavelength anomalies(Fig. 7), thus the tectonic trends in some areas, such as eastern China, are not clear. With increasing orders of wavelet transform details, the linear anomaly zones become more remarkable with clear striking directions, which allow us to recognize the boundaries between first-order anomaly provinces. Within the Tibetan plateau, the secondary anomaly provinces can also be identified with reference to the results of wavelet analysis, which permit delineating the tectonic units which were formed by several collisions in the Eurasia plate during the evolution of the Tethys. On the free-air gravity anomaly map, the nearly EW trending Qin Ling-Dabie Shan anomaly belt seems to terminate at the eastern margin of the Ordos-Sichuan anomaly province. Whereas the map of high-order wavelet details reveals obvious eastward extension of this anomaly belt. Also in terms of the high-order wavelet detail map, we can demarcate the western boundary of the anomaly provinces in eastern China. Besides, we find that relative to free-air gravity anomalies or low-order wavelet transform details, the high-order wavelet transform details bear less effects of heterogeneity in the shallow subsurface, thus look like more continuous in the transitional portions between l and and sea, which demonstrates that the continental shelf is the natural extension of the continent, both have same properties of crust.
6 CONCLUSIONS(1)On l and , comparison of free-air gravity data from multiple sources indicates that the measured freeair gravity data can be directly used to map compilation for the areas with fairly flat terrains and uniformly distributed measurement sites. While for those areas with complex topography, sparse measurement sites or without data, it is an effective approach for data supplement to generate synthetic average free-air gravity data by inversion of Bouguer gravity anomalies with high-accuracy terrain data.
(2)In seas, comparison of multiple-source satellite altimetry gravity data and shipboard measurement data shows that the datasets of SS V18.1 and DNSC08GRA are highly consistent. Whether in data distribution, resolution or accuracy, they have been greatly enhanced relative to the satellite altimetry gravity data released in the past. Although ship-based measurement data have higher resolution on profiles, satellite altimetry gravity data are surely suitable for preparation of small-scale maps with warranted quality.
(3)Satellite altimetry gravity data can be used as a platform to adjust shipboard gravity data. The gravity data calculated from the EGM2008 earth gravity field model can be employed as a reference for natural transition of free-air gravity anomalies between sea and l and nearby coasts, which ensures the objectiveness of the gravity anomaly field expressed in the measurement blank areas.
(4)By means of wavelet transform and other methods, we can determine the locations of anomaly gradient belts. The anomaly provinces and gradient belts demarcated on the free-air gravity anomaly map provide evidence for subdivision of block tectonic units.
(5)In the China mainl and , seas and adjacent areas, the first-order gradient belts of free-air gravity anomalies can be summarized as three horizontal lines and four vertical lines, which separate 8 first-order anomaly provinces. The Ordos and Sichuan basins are transitional areas, which are surrounded by other anomaly provinces with distinct features, belonging to different tectonic domains. The anomaly areas in the east and west of the map are attributed to the Pacific and Tethys tectonic domains, respectively. Their features reflect the distinctive tectonic structures resulted from subduction of the Pacific plate and Indo-Australia plate beneath Eurasia since the Indosinian movement. While to the north of the map, in the Kazakhstan and Mongolia anomaly areas far away from the two force sources, the gravity field reflects the non-uniform material distribution created by the tectonic movement during the ancient global tectonic stage consolidated in the ancient Asia ocean tectonic domain.
7 ACKNOWLEDGMENTSWe thank Lei Shoumin for his guidance in data analysis. We are grateful to Hao Tianyao, Zhang Minghua, and Qiao Jihua for providing gravity data and the helpful discussion about gravity interpretation. This work was supported by the Special Projects of Geologic Surveys of Ministry of National L and s and Resources of China(GZH200900504) and the National Natural Science Foundation of China(41210005, 41206050).
| [1] | Andersen O B, Knudsen P. 2000. The role of satellite altimetry in gravity field modelling in coastal areas. Phys. Chem.Eurth, 25(1):17-24. |
| [2] | Andersen O B, Knudsen P, Berry P A M. 2010. The DNSC08GRA Global Marine Gravity field from Double Retracked Satellite Altimetry. Journal of Geodesy, 84(3):191-199. |
| [3] | Bacchin M, Milligan P R, Wynne P, et al. 2008. Gravity Anomaly Map of the Australian region (Third Edition), scale 1:5000000. Geoscience Australia, Canberra. |
| [4] | Becker J J, Sandwell D T, Smith W H F, et al. 2009. Global Bathymetry and Elevation Data at 30 Arc Seconds Resolution:SRTM30 PLUS. Marine Geodesy, 32(4):355-371. |
| [5] | Chacksfield B C, Kimbell G S. 2006.] The gravtiy anomalsy index map at 1:3000000 scale. British Geological Survey, Natural Environment Research Coucil. Nottingham. |
| [6] | Fairhead J D, Green C M, Odegard M E. 2001. Satellite-derived gravity havingan impact on marine exploration. The Leading Edge, 20:873-876. |
| [7] | Falvey D A. 2001. 1:1000000 UTMSeries Gravity Anomaly Map. Britsh Geological Survey, Natural Environment Research Coucil. Nottingham. |
| [8] | Gao D Z, Hou Z Z, Tang J. 2000. Multiscale analysis of gravity anomalies onEast China Sea and adjacent regions.Chinese J. Geophys. (in Chinese), 43(6):842-849. |
| [9] | GSC (Geological Survey of Canada). 1988. Gravity anomaly map of the Continental Margin of Eastern Canada, Map 1708A, Scale 1:5000000. Geological Survey of Canada. |
| [10] | Hou Z Z, Yang W C. 1997. Wavelet transform and multi-scale analysis on gravity anomalies of China. Acta Geophysica Sinica (in Chinese), 40(1):85-95. |
| [11] | Hou Z Z, YangWC, Liu J Q. 1998. Multiscale inversion of the density contrast within the crust of China. Acta Geophysica Sinica (in Chinese), 41(5):642-651. |
| [12] | Liu G D. 1993. Atlas of Geology and geophysics of China seas and ajacent regions(in Chinese). Beiijng:Science Press, 47-48. |
| [13] | Liu G D. 2007. Geodynamical evolution and tectonic framework of China (in Chinese). Earth Science Frontiers, 14(3):39-46. |
| [14] | Liu G D, Hao T Y, Liu Y K. 1997. Continentaltectonic of Chinaand its relationship with mineral resources. Chinese Science Bulletin, 42(2):113-118. |
| [15] | NGA (US National Geospatial-Intelligence Agency). 2008. Earth Graritational Model (EGM2008). http:earth-info. nga.mil/GandG/wgs84/gravitymod/egm2008/index. html. |
| [16] | Pavis N K, Factor J, Holmes S A. 2006. Terrain-related gravimetric quantities computed for the next EGM. http://earthinfo.nag.mil/GandG/wgs84/gravitymod/new-egm/EGM08papers/NPavlis&alS8Revised111606.pdf. presented at the 1st International symposium of the International gravity sercice, Istanbul, turkey. |
| [17] |
Pavlis N K, Holmes S A, Kenyon S C, et al. 2008. An Earth Gravitational Model to Degree 2160:EGM2008.http://earth-info.nga.mil/GandG/wgs84/gravitymod/egm2008/NPavlis&alEGU2008. pptpresented at the 2008 General Assembly of the European Geosciences Union, Vienna, Austria, 2008. Pavlis N K, Holmes S A, Kenyon S C, et al. 2012. The development andevaluation of the Earth Gravitational Model 2008 (EGM2008). J. Geophys. Res.:Solid Earth (1978-2012), 117(B4):B04406. General Assembly of the European GeosciencesUnion. |
| [18] | Sandwell D T, Smith W H F. 1997. Marine gravity anomaly from Geosat and ERS 1 satellite altimetry. Journal of Geophysical Research:Solid Earth (1978-2012), 102(B5):10039-10054. |
| [19] | Sandwell D T, Smith W H F. 2005.] Retracking ERS-1 altimeter waveforms for optimal gravity field recovery. Geophys.J. Int., 163(1):79-89. |
| [20] | Sandwell D T, Smith W H F. 2009. Global marine gravity from retracked Geosat and ERS-1 altimetry:Ridge segmentation versus spreading rate. Journal of Geophysical Research:Solid Earth (1978-2012), 114(B1):B01411. |
| [21] | USGS (U. S. Geological Survey). 2013. Gravity anomaly map of the conterminous United States. Gridded geophysical data sets for the conterminous United States on CD-ROM (DDS-9). Denver. |
| [22] | Yang J Y, Zhang X H. 2008. Study on the accuracy of shipboard gravity anomalies and satellite altimetry derived gravity anomlaies in the China Seas.//Jin X L, Qin Y S, Zhu R X, et al. Research and Development of Geology and Geophysics in China (in Chinese). Beijing:Ocean Press, 741-746. |
| [23] | Yang J Y, Zhang X H, Zhang F F, et al. 2012. On the accuracy of EGM2008 earth gravitational model in Chinese Mainland. Progress in Geophys. (in Chinese), 27(4):1298-1306. |
| [24] | Yang W C, Shi Z Q, Hou Z Z, et al. 2001. Discrete wavelet transform for multiple decomposition of gravity anomalies.Chinese J. Geophys. (in Chinese), 44(4):534-541. |
| [25] | Zhang X H, Guo X W, Yang J Y, et al. 2010. Gravity characteristics and preliminary division of tectonic units in China andadjacent areas. Geology in China (in Chinese), 37(4):881-887. |
| [26] | Zhang X H, Meng X J, Han B. 2009. Block and block tectonics. Marine Geology & Quaternary Geology (in Chinese), 29(5):59-64. |
 2014, Vol. 57


