 2014, Vol. 57


2. The Key Laboratory of Marine Hydrocarbon Resources and Environment Geology, Ministry of Land and Resources, Qingdao Institute of Marine Geology, Qingdao 266071, China
The coastal area of South China, immediate the northern continental margin of the South China Sea, lies in the locality where the Eurasia plate, Philippine plate and Indian Ocean plate meet(Fig. 1). Controlled by joint actions of these three plates, this region has experienced intense tectonic compression and extension since Mesozoic(Gilder et al, 1996; Shu, 2012; Liu et al, 2013). Deep material activities, along with the evolutionary process, have formed series of deep fracture zones which cut through crust and reach upper mantle. These fracture zones are still active, leading to earthquakes in the coastal areas of South China(Zhang and Wu, 1994; Ren et al, 1998; Hao et al, 2002). Characteristics of the deep structure and tectonic activities have recorded important information about evolution history of this area as well as the northern South China Sea. Studying the deep crustal structure and its relation with main fracture zones is of great significance in underst and ing dynamical mechanism of interaction between discrete blocks and earthquake prediction in this area.

|
Fig.1 Seismic stations around the coastal area of South China and distribution of the teleseismic events Black triangles represent seismic stations. Black stars represent teleseismic events. |
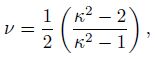
Crustal thickness(H) and Poisson’s ratio(v)are two important parameters for studying plate evolution mechanism and earth composition. The first one was resulted from geological processes such as plate convergence and collision, serving as an important marker for defining types of global plates and regional blocks. Zhang et al.(2011)collected a large number of data of seismology, gravity and other observations, and proposed that the crustal thickness in China ranges from 20 to 63 km, decreasing from west to east and reaching the minimum in the South China Sea. According to the latest surveys using ocean bottom seismometers(Qiu et al., 2011; Ruan et al., 2011), the crust in the southwest sub-basin of the South China Sea is only about 5 km thick. Diversity of the crustal thickness between different tectonic units reflects complexity of regional crustal structure and geodynamic mechanisms. The second one, Poisson’s ratio, with close relation to crustal thickness, is an important rock elastic parameter as direct evidence for exploring material composition and physical conditions of the earth interior(Christensen, 1996). Z and t et al.(1995)summarized the crustal Poisson’s ratios in shields, platforms, orogenic belts and other places on the earth. They proposed some conclusions about the way that Poisson’s ratio responses to composition of crustal material, and discussed about influences of mafic lower crust and partial melting on the Poisson’s ratio. Ji et al.(2009)revealed the ranges of Poisson’s ratio of acidic rocks(v < 0.26), intermediate rocks(0.26 < v < 0.28) and basic-ultrabasic rocks(0.28 < v < 0.30)through laboratory experiments, providing important constraints on the crustal material composition according. Chevrot et al.(2000) and Ji et al.(2009)respectively found that certain relation exists between Poisson’s ratio and crustal thickness, implying significant clues for the crustal evolution and tectonic movements. In consequence, on basis of the crustal thickness and Poisson’s ratio distribution, we can discuss about the deep crustal structure and geodynamic origin in perspective of block type, interior material composition and evolution mode.
At present, seismology is the main method to estimate the crustal thickness since it is most intuitive and reliable for probing the discontinuity(Moho)between crust and mantle(Qiu et al., 2001; Erduran, 2009; Yuan et al., 2010). In addition, utilizing active or passive seismological exploration to acquire the ratio of P and S-wave velocity is another important tool for constraining Poisson’s ratio besides physical experiments(Wu et al., 2004; Eccles et al., 2011). Among them, the receiver function method in passive seismology, utilizing nearly vertical incoming P waves and converted S waves, possesses better resolution in detecting the crustal structure and seismic velocity, which is beneficial for studying the crustal thickness and Poisson’s ratio beneath the seismic stations(Zhu & Kanamori, 2000). In this study, we collected earthquake data in Guangdong and Fujian provinces, the coastal areas of South China, utilized the receiver function method for stacking and searching for converted S waves to model the crustal thickness and Poisson’s ratio beneath seismic stations.
2 METHODThe receiver function method is a powerful tool to study the crustal and upper mantle structure utilizing three-component teleseismic(30° < Epicentral distance < 90°)records of single earthquake station(Huang et al., 2011; Sun et al., 2012). Langston(1979)proposed to deconvolve vertical seismograms from the horizontal components in the frequency domain to isolate P-to-S converted phases plus their reverberations. Since dependences of crustal thickness(H) and velocity ratio of P and S wave(κ)on P wave velocity are not as strong as on S wave velocity, with assumed average P wave velocity, H and κ can be calculated theoretically using the travel-time difference between P and S waves. Zhu et al.(2000)searched for the maximal stacking amplitude of converted S waves and its reverberations in certain ranges of H and κ, and eventually obtained estimations of their averages. This technique effectively avoids personal error due to phase identification and travel-time picking, and thereby possesses higher reliability.
Travel-times of the converted S waves and their reverberations relative to first arrival P wave can be formulated as
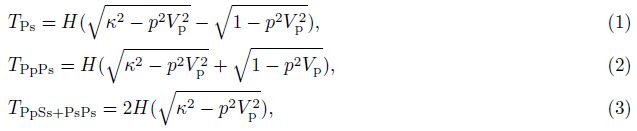
In this study, we collected earthquake data from totally 75 digital seismograph stations, including 29 in Fujian province and 46 in Guangdong province(Fig. 1)which are distributed along the coast striking in NE direction and cover 30×104 km2. These stations operated from 2001 and recorded a huge number of earthquakes, from which we selected teleseismic events with epicentral distances of 30° to 90° and with clear first P wave arrivals and high signal-to-noise ratio(SNR). There are 201 selected events which are mainly distributed in circum-Pacific and Tibetan plateau seismic belts(Fig. 1). Original waveforms were cut from 30 s before to 90 s after the first P wave arrivals according to theoretical arrivals computed from the IASP91 model(Buland and Chapman, 1983). Source equalisation procedure(Langston, 1979; Ammon, 1991)was utilized to isolate the receiver functions from teleseismic events. In this procedure, a Guassian factor of 2.5 which retains converted S waves and their reverberations generated from main crustal velocity discontinuities, and a water-level of 0.001 are used for deconvolution. We manually checked the isolated results and rejected those receiver functions with low SNR or abnormal waveforms, and finally obtained 4172 effective waveforms. Most stations recorded more than 13 waveforms except for the GUT station in Fujian with no usable waveforms. Only 6 or 7 waveforms were obtained respectively for the PUN and SHD station.
H and κ were searched by the H-κ stacking method with average P wave velocity of 6.2 km·s-1(Zheng et al., 2003; Cai et al., 2003). Weighted factors for converted S wave and their reverberations PpPs and PsPs+PpSs were set as 0.6, 0.3 and 0.1 respectively. Ranges for H and κ are 20~60 km(Xiong et al., 2009) and 1.5~2.0(Ji et al., 2009).
4 CALCULATION AND ANALYSIS 4.1 Search and Stack of H-κWe calculated and obtained 74 estimations of H and κ(Table 1), including 46 values in Guangdong network(GDN) and 28 values in Fujian network(FUJ). The form of the stacked amplitude spectrum depends on quality of the receiver function waveforms. On the one h and , thick sediment layers can delay S wave traveltime, thus causing an error up to 20% for estimation of Poisson’s ratio(Chen and Liu, 2007). On the other h and , reverberations from thick sediment layers, as well as converted phases from secondary discontinuities in crust, will affect the identification of converted S waves from the Moho and produce local extreme-values of the stacked amplitudes. Improper processing on these situations will give rise to wrong estimations of H and κ.
| Table 1 Locations of seismic stations, crustal thickness (H) , and velocity ratio (κ) |
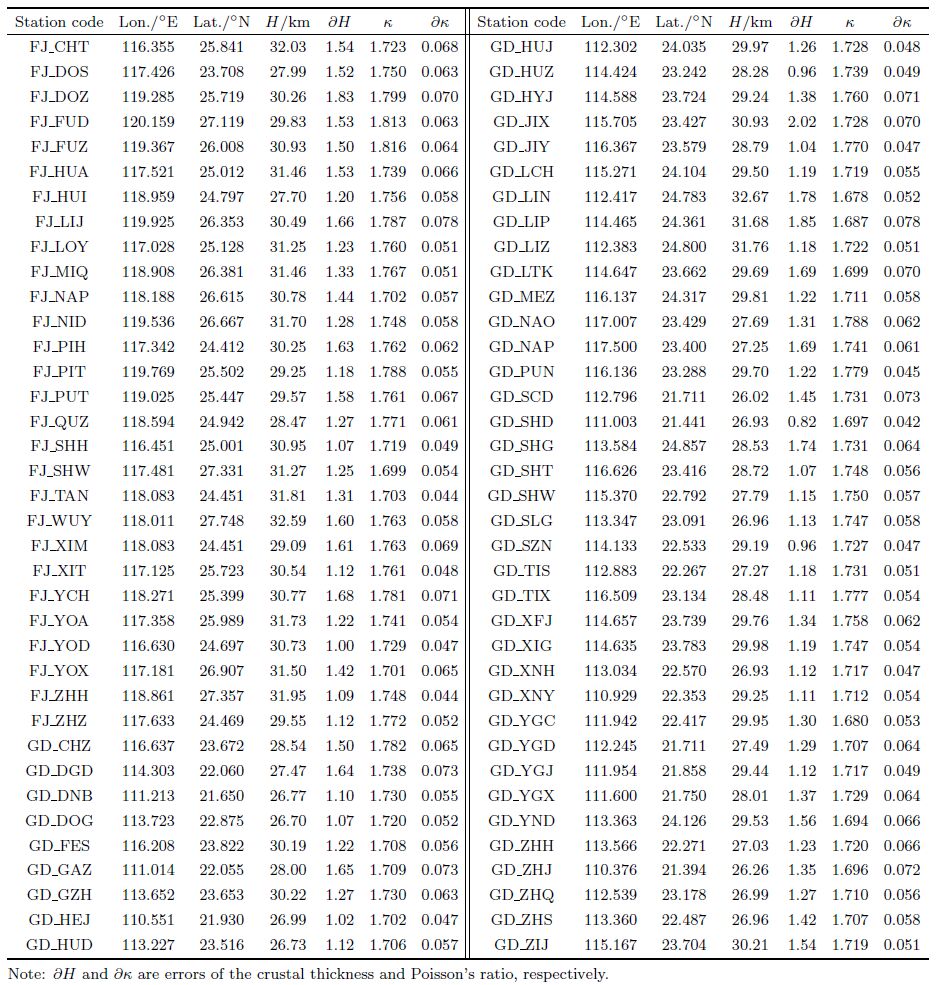
Figure 2 shows stacking results of receiver functions recorded by LCH, SHG in GDN and YOD, FUZ in FUJ, in which, different colors and related contours represent stacked amplitudes(only showing positive values). Among them, LCH station records 108 receiver functions with high SNR. Clear P first arrivals(0 second), converted S wave(3 seconds) and its reverberation PpPs(12 seconds)are clearly identified. Accordingly, estimations of H and κ are reliable owing to the simple formation of the stacked amplitudes and the obvious linear trend of Ps and PpPs stacked amplitudes(Eq.(1) and (2)). SHG station records 120 receiver functions with high SNR where clear P, Ps and PpPs phases can be identified. Arrivals of these phases are similar as those ones in LCH. Another phase with travel time of 2 seconds is identified as converted S wave from some discontinuity in crust and named as Pcs. Distribution of the stacked amplitudes of SHG is complicated and has several local extreme-values. For special, the stacked amplitude of Pcs and its reverberations results in local extreme-value at the depth of 23 km. YOD station records 65 receiver functions with low SNR due to wild noises. In spite of this, clear and continuous Ps and PpPs phases can also be identified. The linear trend in the stacked amplitudes is more distinct, although some local extreme-values appear under influence of noises. FUZ station records 71 receiver functions. Although the SNR is high, only Ps phases can be identified. PpPs phases are not clear, and the maxima values distribute along the stacked amplitudes of Ps so as to be blurred. The local extreme-value corresponding to H of 22 km is supposed to be related to Pcs arrival in 2 seconds.

|
Fig.2 H-κ stacking of receiver functions at Stations LCH, DOH in GDN and YOD, FUZ in FJN White cross in colored diagram represents the maximal stacked amplitude. Accompanying values are estimations of H and κ. |
We interpolated(Smith and Wessel, 1990)the estimations acquired using the H-κ stacking method and obtained distribution of the crustal thickness in the coastal area of South China(Fig. 3). The results reveal that the crustal thickness in this area is featured by blocky demarcation and generally decreases from north to south and west to east. The Nanling-Wuyi fold belt(I and II)in northern Guangdong and northwestern Fujian has the thickest crust up to 30~33 km with little lateral variation. While in the coastal area(III), Pearl River Estuary(IV) and Leiqiong(V), crust thins to 26~27 km. Transitional variation zones of the crustal thickness exist between different blocks. For instance, between II and III, the transitional variation zone has N-E strike and is controlled by the Zhenghe-Dapu and Changle-Nan0ao fracture zones, while between I, IV and V it is steeper and controlled by the Gaoyao-Changning, Xijiang and Sihui-Wuchuan fracture zones, indicating obvious mantle uplift beneath Pearl River Estuary and Leiqiong. By projecting major historical earthquakes(magnitude > 5.0) and those ones happened from the year of 1990(magnitude > 2.8)onto the distribution map of the crustal thickness, we find that these earthquakes mainly took place at the places with gradient zones of the crust variation, consistent with fault distribution.

|
Red circles denote earthquakes. Yellow stars denote historical earthquakes in coastal area. Green solid lines represent faults.Contours lines represent crustal thickness. Roman number represents subregions. Black solid lines are location of profile in Fig. 5. Fig.3 Crustal thickness over the coastal area of South China |
Figure 4 shows that Poisson’s ratio has the same blocky distribution as crustal thickness and decreases from northeast to southwest in range of 0.24~0.27. Poisson’s ratio in the Leiqiong area and Nanling-Wuyi fold belt has little variation and are generally 0.24. While under YGX and DNB stations in GDN and XIT station in FUJ, the value is as abnormally high as 0.26. Poisson’s ratio in Pearl River Estuary is about 0.25. Whereas in stations of XIG, HYJ and XFJ to the north close to the Gaoyao-Changning fracture zone, the value increases up to 0.26. As for small earthquake swarms exist in this area, increasing of Poisson’s ratio is supposed to be related to the fracture zone or fluid activity induced by seismicity. Fracture zones in this region control the distribution of Poisson’s ratio. A N-E trending gradient zone of Poisson’s ratio is perfectly consistent with the Zhenghe-Dapu fracture zone where earthquakes mainly happened under actions of faults.

|
Contours represent crustal thickness. Capital letters and bracketed values are stations with anomalies and Poisson’s ratio. Fig.4 Crustal thickness over the coastal area of South China |
Three groups of N-E, N-W and E-W trending faults are present in the coastal area of South China, among which the N-E trending ones are largest in scale(Zhang and Wu, 1994). These faults constitute boundaries of different blocks and geomorphic units, producing varieties of tectonic l and forms including graben basins, fold uplifts, valley plains and so on. For instance, Pearl River Estuary in Guangdong is a graben basin bounded by EW and NW trending faults, while the Nanling-Wuyi fold belt is an orogenic uplift under a compression environment. Besides, extension leads to mantle uplift so as to strongly thin the crust in the Leiqiong and coastal region of Guangdong and Fujian, which is the main reason for intensive volcanism in these areas. Researches show that seismic zones in the coastal area of South China have obvious zoning characteristics(Ren and Luo, 1998), and the spatial distribution of these earthquakes depends on fault-block movements, deep crustal structure and physical attributes. In order to study the relation between crustal thickness, Poisson’s ratio and geomorphic features, in this article, we chose 4 long profiles across the coastal area of South China and compared them to geomorphic features(Fig. 5).

|
Yellow circles denote earthquakes. Solid lines at top denote elevation, red and black solid lines at the bottom denote Poisson’s ratio and crustal thickness, respectively. Three broken lines mark the Poisson’s ratio of 0.24, 0.26 and 0.28. Fig.5 Four long profiles through the coastal area of South China reflecting relation between crustal thickness, Poisson’s ratio and earthquake distribution |
Figure 5a starts from west of the Nanling-Wuyi tectonic belts through the Gaoyao-Changning fracture zone and arrives at Pearl River Estuary. Crust along this profile thins from north to south with sea-to-l and transitional property. The transitional zone is located at 24°N, where the crustal thickness decreases from 32 km to 26 km likely affected by the fault. Poisson’s ratio shows a reverse variation trend from 0.23 in l and to 0.25 in the sea, which indicates increasing of mafic material in the crust related to mantle upwelling. Earthquakes in this area generally took place at depth of 4~14 km and slightly shallower with thinning of the crust. Comparing the results with topography data, we find that crustal thickness, Poisson’s ratio and focal depth are related to geomorphic features. Anti-roots exist beneath mountain fold belts. Meanwhile, thrust faults in upper crust caused by fold structure reduce the average Poisson’s ratio.
Figure 5b starts from east of Nanling-Wuyi tectonic belts, through Zhenghe-Dapu and Nan'ao-Changle fracture zones and arrives at the coastal area of Fujian-Guangdong district. Crustal thickness decreases from 30 km in north to 26 km in the coastal area. A transitional zone also exists around the Zhenghe-Dapu fracture zone(24°N). Poisson’s ratio changes greatly from 0.24 in the north to 0.27 in the sea. The related focus depth increases from 10 km in the west of the Zhenghe-Dapu fracture zone to the Moho. Moreover, fault-fracture zones and fluid activity may exist around the Nan0ao-Changle fracture zone contributing to the rapid increasing of Poisson’s ratio.
Figure 5c starts from the north of the Nanling-Wuyi fold belt through Zhenghe-Dapu and Nan'ao-Changle fracture zone and arrives at the north of Taiwan Strait. Crustal thickness decreases from 33 km to 28, while Poisson’s ratio increases from 0.23 to 0.27. An abrupt variation belt appears around the Zhenghe-Dapu fracture zone. The focal depths gradually deepen around the fracture zone, which further proves that influences of this fracture zone on the crustal structure extending through the whole crust.
Figure 5d starts from the Leizhou Peninsula in east, crossing Pearl River Estuary, Zhenghe-Dapu and Changle-Nan’ao fracture zones trending NEE, and arrives at the coastal region of Fujian-Guangdong district. Different tectonic units in this profile correspond to topography distribution, crustal thickness and Poisson’s ratio. Terrain sinks while mantle uplifts in the coastal area and basins, whereas in mountain areas exist antiroots for the isostasy. Poisson’s ratio increases from l and to sea more obviously in this profile. Variation of Poisson’s ratio in the part area corresponds to the topography better. Earthquake sources are located mostly in upper and middle crust in the western side of the Zhenghe-Dapu fracture zone, while in eastern side, they exists around the Moho. This distribution clearly outlines the fault plane, indicating that this fault zone is a regional crustal fault and serves as the boundary of different blocks.
5.2 Relation Between Crustal Thickness and Poisson’s RatioBlock movements in mainl and of South China are manly affected by westward push of the western Pacific plate, continental rifting in eastern Asia and southward spreading of the South China Sea(Xu et al., 2009), more intense closer to the coastal region. The deep crustal structure exhibits various types according to different tectonic evolution patterns. We can reveal the crustal evolution processes and types of the tectonic movements in the coastal area of South China by studying relation between crustal thickness and Poisson’s ratio. This study discusses the tectonic environment and evolution mode by constructing this relation.
Figure 6 shows the trade-off relation between crustal thickness and Poisson’s ratio(Fig. 6b) and division of the evolutionary regions(Fig. 6a). Two H-κ relations can be concluded taking the fault zones(black dashed line in Fig. 6a)as boundary. Seaward regions of the fault zone include yellow, red and blue squares, in which the yellow ones refer to research results of the Hainan seismic network(Huang et al, 2012). In these stations, a positive trade-off relation between crustal thickness and Poisson’s ratio exists. Poisson’s ratio decreases as crust thins with determination coefficient R2 of 0.5646 which means that 56.56% of the information about changes of Poisson’s ratio can be explained by variation of the crustal thickness(Seber and Lee, 2012). Crust in the coastal area of South China has typical continental layered structure: upper crust is constituted by neutral and acid rocks while lower crust is constituted by basic rocks with femic constituents. Under strong effect of the regional tectonic extension in this area, crust is stretched and thinned. According to the “S and wich” model about composition of the continental crust and upper mantle(Ranalli & Murphy, 1987), more flowing lower crust thins to a greater degree than upper crust, which causes the decrease of Poisson’s ratio as crustal thickness reduces(Ji et al., 2009). L and ward regions of the fault zone include purple, green and pink squares. In these regions, crustal thickness is relatively larger while Poisson’s ratio decreases below 0.26 and is lower than the seaward area. As a result, a negative trade-off relation between H and κ is constructed. Under the effect of thrust-nappe structure in the Nanling-Wuyi fold belt, felsic upper crust tends to shorten and thicken more easily under the compressive environment. In this case, Poisson’s ratio decreases as crustal thickness increases.

|
(a) Classified stations in study area. Colorized square denotes earthquake station. Black dash line represents regional boundary (b) Relation between crustal thickness and Poisson’s ratio. Black dash line represents linear fitting relationship. Fig.6 Relation between the crustal thickness and Poisson’s ratio |
In this study, we processed teleseismic waveforms recorded by 75 stations of networks in the coastal area of South China. Receiver functions were obtained for estimating the crustal thickness and Poisson’s ratio utilizing the H-κ stacking method. We also analyzed the research results, compared them to fault activities, earthquake distribution and tectonic environment, and draw the following conclusions:
(1)The coastal area of South China was affected by westward compression of the Pacific plate, continental margin rifting of eastern Asian and expansion of the South China Sea. In consequence, NE, NW and EW trending fracture zones, as well as granite of different periods, developed leading to the block and zoning distribution of crustal thickness and Poisson’s ratio. Crust generally thins from north to south and l and to sea. Almost all the estimated values of Poisson’s ratio are lower than 0.28, indicating that neutral and acid rocks primarily constitute the crust in this region. In some places, affected by upwelling of mantle material, the Poisson’s ratio is high due to increasing mafic compositions in the crustal rocks.
(2)Crustal thickness and Poisson’s ratio change as transitional zones and mutation belts around fracture zones. In addition, they are positively and negatively related to the topography in this region, respectively, which demonstrates that anti-roots generally exist under mountains and thrust orogenic belts cause thickening of the felsic upper crust. Most earthquakes took place in the middle and upper crust. While in the seaward side of the Zhenghe-Dapu fracture zone, focal depth can extend to Moho, verifying that this fracture zone is deep enough to cut through the whole crust. Besides, small earthquake swarms exist in part of this region, which induce fracture zones and fluid process to increase Poisson’s ratio rapidly.
(3)Taking Zhenghe-Dapu and Gaoyao-Changning fracture zones as a boundary in the coastal area of South China, positive trade-off relation exists between crustal thickness and Poisson’s ratio in the seaward area. It is related to the layered tension of the lower crust under the extension, where weaker and flowing lower crust thins to a greater extent. In the l and area, thrust-nappe structures grow as main characteristics of the Nanling-Wuyi fold belt, leading decrease of Poisson’s ratio as crust thickens.
Crustal thickness and Poisson’s ratio in this study are average results of the whole crust. As for finer structure, 1D shear wave velocity structure beneath single stations should be studied. It is important for revealing the relations between low-velocity bodies in crust, form of the crust-mantle boundary, fault activity and seismicity. In the next step of work, we will acquire the shear wave velocity structure in the coastal area of South China using forward modeling and inversion methods of the receiver function, expecting to obtain further underst and ings about crustal composition, deep structure and tectonic evolution modes.
7 ACKNOWLEDGMENTSWe would like to thank Zhang Xunhua, Wen Zhenghe and Doctor Wang Zhonglei for their help. We also thank CENC for its downloading services of the teleseismic waveforms, and Zhu Lupei for his free program codes used in receiver function stacking. This study was supported by the Project of Geological and Geophysical Series Maps in L and and Sea of China(GZH200900504), the National Natural Science Foundation of China(91028002, 41222039) and Youth Talent Forefront Project of the Knowledge Innovation Project of the Chinese Academy of Sciences(SQ201210).
| [1] | Ammon C J. 1991. The isolation of receiver effects from teleseismic P-wave-forms. Bulletin of the Seismological Society of America, 81(6):2504-2510. |
| [2] | Buland R, Chapman C H. 1983. The computation of seismic travel times. Bulletin of the Geological Society of America, 73(5):1271-1302. |
| [3] | Cai X L, Zhu J S, Cao J M, et al. 2003. Three-dimensional tectonic types and evolutional dynamics of lithosphere of South China region. Geotectonica et Metallogenia (in Chinese), 27(4):301-312. |
| [4] | Chen J H. 2007. Teleseismic receiver function:Theory and applications[Ph. D. thesis] (in Chinese). Beijing:China Seismological Bureau of Geological Research Institute. |
| [5] | Chevrot S, van der Hilst R D. 2000. The Poisson ratio of the Australian crust:geological and geophysical implications.Earth and Planetary Science Letters, 183(1-2):121-132. |
| [6] | Christensen N I. 1996. Poisson's ratio and crustal seismology. Journal of Geophysical Research:Solid Earth (19782012), 101(B2):3139-3156. |
| [7] | Eccles J D, White R S, Christie P A F. 2011. The composition and structure of volcanic rifted continental margins in the North Atlantic:Further insight from shear waves. Tectonophysics, 508(1-4):22-33. |
| [8] | Erduran M. 2009. Teleseismic inversion of crustal S-wave velocities beneath the Isparta Station. Journal of Geodynamics, 47(5):225-236. |
| [9] | Gilder S A, Gill J, Coe R S, et al. 1996. Isotopic and paleomagnetic constraints on the Mesozoic tectonic evolution of south China. Journal of Geophysical Research:Solid Earth (1978-2012), 101(B7):16137-16154. |
| [10] | Hao T Y, Liu J H, Song H B, et al. 2002. Geophysical evidences of some important faults in South China and adjacent marginal seas region. Progress in Geophysics (in Chinese), 17(1):13-23. |
| [11] | Huang H B, Qiu X L, Xia S H. 2012. Crustal structure and Poisson's ratio beneath Hainan Island. Journal of Tropical Oceanography (in Chinese), 31(3):65-70. |
| [12] | Huang H B, Qiu X L, Xu Y, et al. 2011. Crustal structure beneath the Xisha Islands of the South China Sea simulated by the teleseismic receiver function method. Chinese J. Geophys. (in Chinese), 54(11):2788-2798. |
| [13] | Ji S C, Wang Q, Salisbury M H. 2009. Composition and tectonic evolution of the Chinese continental crust constrained by Poisson's ratio. Tectonophysics, 463(1-4):15-30. |
| [14] | Ji S C, Wang Q, Yang W C. 2009. Correlation between crustal thickness and Poisson's ratio in the north China craton and its implication for lithospheric thinning. Acta Geologica Sinica (in Chinese), 83(3):324-329. |
| [15] | Langston C A. 1979. Structure under Mount Rainier, Washington, Inferred from Teleseismic Body Waves. Journal of Geophysical Research:Solid Earth (1978-2012), 84(B9):4749-4762. |
| [16] | Liu Q Y, He L J, Huang F. 2013. Review of Mesozoic geodynamics research of South China. Progress in Geophysics, 28(2):633-647. |
| [17] | Qiu X L, Ye S Y, Wu S M, et al. 2001. Crustal structure across the Xisha trough, northwestern South China Sea.Tectonophysics, 341(1-4):179-193. |
| [18] | Qiu X L, Zhao M H, Ao W, et al. 2011. OBS survey and crustal structure of the Southwest Sub-basin and Nansha Block, South China Sea. Chinese J. Geophys. (in Chinese), 54(12):3117-3128. |
| [19] | Ranalli G, Murphy D C. 1987. Rheological stratification of the lithosphere. Tectonophysics, 132(4):281-295. |
| [20] | Ren Z H, Luo Z N. 1998. A new study on the devision of the seismic belts in the South China seismic area. South China Journal of Seismology (in Chinese), 18(2):10-15. |
| [21] | Ren Z H, Luo Z N, Qin N G. 1998. Restudy on the basic characteristics of seismicity and general situation for South China seismic zone. South China Journal of Seismology (in Chinese), 18(1):40-49. |
| [22] | Ruan A G, Niu X W, Qiu X L, et al. 2011. A wide angle Ocean Bottom Seismometer profile across Liyue Bank, the southern margin of South China Sea. Chinese J. Geophys. (in Chinese), 54(12):3139-3149. |
| [23] | Seber G A F, Lee A J. 2003. Linear Regression Analysis. New Jersey:Wiley-Interscience. |
| [24] | Shu L S. 2012. An analysis of principal features of tectonic evolution in South China Block. Geological Bulletin of China(in Chinese), 31(7):1035-1053. |
| [25] | Smith W H F, Wessel P. 1990. Gridding with Continuous Curvature Splines in Tension. Geophysics, 55(3):293-305. |
| [26] | Sun Y, Niu F L, Liu H F, et al. 2012. Crustal structure and deformation of the SE Tibetan plateau revealed by receiver function data. Earth and Planetary Science Letters, 349-350:186-197. |
| [27] | Wu H H, Tsai Y B, Lee T Y, et al. 2004. 3-D shear wave velocity structure of the crust and upper mantle in South China Sea and its surrounding regions by surface wave dispersion analysis. Marine Geophysical Researches, 25(1-2):5-27. |
| [28] | Xiong X S, Gao R, Li Q S, et al. 2009. The Moho depth of South China revealed by seismic probing. Acta Geoscientica Sinica (in Chinese), 30(6):774-786. |
| [29] | Xu X B, Zhang Y Q, Jia D, et al. 2009. Early Mesozoic geotectonic processes in South China. Geology in China (in Chinese), 36(3):573-593. |
| [30] | Yuan H Y, Dueker K, Stachnik J. 2010. Crustal structure and thickness along the Yellowstone hot spot track:Evidence for lower crustal outflow from beneath the eastern Snake River Plain. Geochemistry, Geophysics, Geosystems, 11(3):doi:10.1029/2009GC002787. |
| [31] | Zandt G, Ammon C J. 1995. Continental-crust composition constrained by measurements of crustal poissons ratio.Nature, 374(6518):152-154. |
| [32] | Zhang H N, Wu Q H. 1994. A comparative study of main active fault zones along the coast of South China. Seismology and Geology (in Chinese), 16(1):43-52. |
| [33] | Zhang Z J, Yang L Q, Teng J W, et al. 2011. An overview of the earth crust under China. Earth-Science Reviews, 104(1-3):143-166. |
| [34] | Zheng Q S, Zhu J S, Xuan R Q, et al. 2003. An approach to the crustal velocities in southern China. Sedimentary Geology and Tethyan Geology (in Chinese), 23(4):9-13. |
| [35] | Zhu L P, Kanamori H. 2000. Moho depth variation in southern California from teleseismic receiver functions. Journal of Geophysical Research:Solid Earth (1978-2012), 105(B2):2969-2980. |