 2014, Vol. 57


2. College of Geosciences, China University of Petroleum (Beijing), Beijing 102249, China
The Western Hubei Eastern Chongqing area is a major exploration block of marine-facies petroleum as well as a currently popular area of shale gas exploration. It has suffered long term uplift and erosion since the Late Yanshan-Himalayan period. It is important to accurately determine the erosion thickness, especially the spatial distribution of the erosion thickness, for the petroleum accumulation analysis, resource calculation, and the forming process of oil and gas reservoirs etc. Some studies have been made on the reconstruction of erosion thickness in the western Hubei and eastern Chongqing area. Lu et al.(2007)employed the inversion of the paleo-heat flow, and suggested that the erosion thickness on the Mesozoic and Cenozoic unconformity varied from 1700 m to 4000 m. The exhumation history of Fangdoushan-Shizhu fold belt in the Western Hubei Eastern Chongqing area since Jurassic was modeled by using combined vitrinite reflectance(Ro) and apatite and zircon(U-Th)/He and apatite fission track(AFT)dating methods(Shi et al., 2011). The results show that all samples have experienced the highest paleogeotemperature in the study area during the Late Jurassic-Early Cretaceous, and from then on, the study area kept doming and cooling in temperature. The denudation may reach 3500 m since the late Jurassic(Shi et al., 2011). Due to the limited borehole data, it is a challenge to construct a contour map of erosion thickness, and therefore studies about the petroleum accumulation, the resource calculation and the quantitative research of reservoir forming process are difficult to be carried out.
Multi-type restoration methods to estimate the thickness of eroded sedimentary rock can be categorized into four types: geothermal, geological, geophysical, and geochemical methods based on paleogeotemperature index, stratigraphical or sedimentary principles, logging or seismic data and diffussion or accumulation theory, respectively. Every type has its own application conditions and limits to estimate the eroded thickness of rocks. In practical application, it should make sure to select the most effective methods or their combinations according to sedimentary development, tectonic evolution of the sedimentary basins and the distribution of the unconformities. It was considered by integrated analysis that paleo-temperature indices of vitrinite reflectance(Ro) and apatite fission-track(AFT)are primary choices under the conditions that lower tectonic layer underwent higher paleo-temperatures than the upper sequence(Yuan et al., 2008).
However, those methods are all for a single well, rather than the whole study area. Generally, the drawing of a contour map of erosion thickness is based on the data from some single wells, which is the erosion thickness of the sequences overlying the unconformity. Then, the contour maps would be drawn by the Kriging or other interpolation methods. Because the data from the single wells are always insufficient, the contour maps of the erosion thickness can’t reflect the real situation frequently. Thus, this paper proposed a new method of drawing a contour map of erosion thickness, i.e. the erosion thickness of the wells are inverted from the paleogeothermal index of Ro, and the erosion thickness of the wells are related to the upmost sequences(the present exposed sequences). Based on the above method, the contour graph of the erosion thickness is drawn. The advantages of this method are the quantitative determination of the absolute value of the borehole erosion thickness by the inversion from the paleogeothermal gradient, and the variation trend of the erosion thickness by the stratum in the geological maps. This method is simple and easy to use. The contour maps by this method not only look nicer, but also can constrain the regional distribution of the erosion thickness more accurately. Therefore, this method can be applied in the basin modeling and resource calculation etc.
2 GEOLOGICAL SETTINGThe western Hubei and eastern Chongqing area is located to the south of the Yangtze River, the east of Wujiang River and the west of Jianshi-Pengshui fault; it includes 4 secondary tectonic units, i.e., the Fangdoushan anticlinorium, Shizhu synclinorium, Qiyueshan anticlinorium, and Lichuan synclinorium(Fig. 1). It covers an area of 20600 km2(Xiao et al., 2001).

|
Fig.1 Tectonic units of the Western Hubei Eastern Chongqing area |
Since Sinian, the western Hubei and eastern Chongqing area experienced the stable subsidences of the Chengjiangian, Caledonian, Hercynian and Indosinian. The sedimentary formations of the marine carbonate rocks interbedded with clastic rocks developed in this area, suggesting the stable cycle depression.
From the Caledonian to the Hercynian, the western Hubei and eastern Chongqing area was located in the transitional slope between the paleo-depression of Xiang0exi and the paleo-dome of Leshan-Longn¨usi. At the end of Silurian, Guangxi movement caused the erosion of the Upper Silurian, which resulted in the contacts of different strata in the upper and lower Paleozoic. At the end of the Carboniferous, Yunnan movement led to the crustal uplift and the widespread denudation of the Carboniferous, which formed some windows of tectonic denudation(Fu, 2000). The differential uplifting-subsidence movements were dominant from the Caledonian to the Hercynian, when the contact relationship of the sedimentary formations showed conformity or disconformity.
The Indosinian movement uplifted the study area and ended the history of transgression. The Middle Triassic was eroded to different degrees, and the paleo-domes of Shizhu and Kaijiang were formed(Sheng et al., 2004). According to the remnant thickness of the Middle Triassic, the uplift height of the Shizhu Paleo-dome is estimated as ~300 m(Sheng et al., 2004), and the centre of uplift was located in the Shizhu area and the centre of subsidence was located in the Longjuba area.
From Yanshanian to Himalayan, the study area accepted terrestrial sediments. It was characterized by subsidence and deposition in the Late Triassic-Jurassic. The Late Yanshanian extensional tectonic activity only affected the area east of the high and steep structural zones of Qiyueshan, but not the Shizhu synclinorium and the Fangdoushan anticlinorium in the western Hubei and eastern Chongqing area. In the early Himalayan, the subduction of the Indian Plate to the China plate was intensive, and the strong compressional stress affected the western Hubei and eastern Chongqing area through the Longmenshan in the west of Sichuan and the Sichuan basin. Based on the preexisting structures in the Yanshanian, the present tectonic framework of NE-NEE alternate uplift and depression was formed(Fu, 2000).
2.2 Deposition Characteristics Vertically,there are three structural deformation layers in the western Hubei and eastern Chongqing area, i.e., the Jurassic-Middle Triassic(T2-J), the Feixianguan Formation of the Lower Triassic-Devonian(D-T1) and the Ordovician-Sinian(Z-O). Two sets of plastic layers are in the boundary of those deformation layers, which are the Jialingjiang Formation(T1j) and the Silurian(S). Due to the wrinkles and fault slips of the plastic layers, the degree of tectonic deformation in three layers were distinct and the uncoordinated deformation formed in the upper and lower layer. The Feixianguan Formation of the Lower Triassic-Devonian layer has the strongest deformation, followed by the Ordovician-Sinian layer. The deformation of the Jurassic-Middle Triassic layer is relatively weak(Hu et al., 2000). Stratigraphically, the Mesozoic strata are dominant with widespread Jurassic in the synclinorium, besides the minor Paleozoic strata exposed in the high and steep structural zones of Fangdoushan and Qiyueshan. There are no Cretaceous strata in the western Hubei and eastern Chongqing area at present-day. However, there should be at least early Cretaceous sediments in the past coupled with the complete denudation of the Lower Cretaceous based on the vitrinite reflectance of the Jurassic. The results of the apatite fission track inversion suggested that the late uplift and erosion of the western Hubei and eastern Chongqing area started ca. 97 Ma(the Early Cretaceous, Yuan et al., 2010). Inferred from this result, the Early Cretaceous sediments should have existed in the past in this area.
3 RECOVERY OF EROSION THICKNESS3.1 Characteristics of the Paleothermal Indicator Ro Profile
The characteristics of the paleothermal indicator Ro profiles are similar in the wells of the western Hubei and eastern Chongqing area. There are not obvious “dislocations” or “jumps” in the Ro profiles of the Maan1 well, Tai1 well, Chayuan1 well, Xinchang2 well, Cizhu1 well and Li1 well(Fig. 2), regardless of the top outcropping, such as the Middle Jurassic, the Lower Jurassic, the Triassic and the Paleozoic.

|
Fig.2 Paleothermal indicator Ro profile of boreholes in the Western Hubei Eastern Chongqing area |
There is an obvious relationship between the measured Ro value and the present burial depth in each borehole, which suggests that the samples didn’t experience abnormal thermal events. In other words, the thermal evolutions of organic matter caused by the early thermal events and the erosion thickness on the early unconformity have been erased by the later deeper burial and therefore increased temperature effect of the overlying sedimentary stratum. Therefore, the burial depth is the key factor of the degree of the thermal evolutions of organic matter. The Ro values are 0.5%~1.2% in the exposed sequences of the western Hubei and eastern Chongqing area. The recorded maximum palaeotemperatures of those sequences are 70~130°C, while the present surface temperature is 15°C. Then the temperature difference is up to 55~115°C. Thus, the uplift and erosion were strong and the erosion thickness was large in the western Hubei and eastern Chongqing area during the Late Yanshanian-Himalayan.
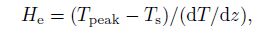
3.2 Recovery of Erosion Thickness of BoreholesThe paleogeothermal gradient method for erosion thickness reconstruction is shown in Fig. 3(Hu et al., 1999). At first, the Ro values are transformed to the highest paleogeothermal values according to the model of the parallel processing of chemical reactions(Sweeney et al., 1990). Then, regarding the tectonic layers as unit, the linear regression should be done between the paleogeothermal values and the corresponding depth. The paleogeothermal gradient and the corresponding paleotemperatures are obtained, and then the erosion thickness can be calculated:

|
Fig.3 Schematic of the paleogeothermal gradient method for erosion thickness reconstruction |
The Maan1 well, Tai1 well, Chayuan1 well, Xinchang2 well, Cizhu1 well and Li1 well have been taken to recover the erosion thickness by the paleogeothermal gradient method. Those wells are distributed in different tectonic units and different upmost sequences in the western Hubei and eastern Chongqing area.
The Chayuan1 well is located in the Chayuanping tectonic unit in the Hebachang area, Liutang Town, Shizhu County, Chongqing city, which is a buried structure in the Shizhu synclinorium. This tectonic unit belongs to the fault nose structural zone in the south of the inclined structures in the Shizhu synclinorium of the fold belt of east Sichuan. The well sequence is the lower Shaximiao Formation(J2xs)of the Middle Jurassic. The Li1 well is located in the Dachayuan, Jiantianba Town, Baiyang District, Lichuan City, Hubei province, which is a high spot of the Yupize anticline in the Yupize tectonic belt of the Lichuan synclinorium. The drilling sequence is the upper Huangjiadeng Formation(D3h)of the Upper Devonian, and the drilled sequence is the Doushantuo Formation of the Sinian. The well passed through the Devonian, the Silurian, the Ordovician, the Cambrian and the Sinian. The Maan1 well, Xinchang2 well and Cizhu1 well are located in the Fangdoushan anticlinorium, and the drilling sequences are the Middle Jurassic(J2), the Lower Jurassic(J1) and the Middle Triassic(T2)respectively.
The results indicate that the erosion thicknesses of those six wells are 2140m, 2637m, 2857m, 2888m, 3539 m and 4177 m respectively in the Yanshan-Himalayan(Fig. 4).

|
Fig.4 Erosion thickness of boreholes in the Western Hubei Eastern Chongqing area |
The methods of the drawing of the erosion thickness contour map are as follows: the absolute erosion thickness would be determined by paleogeothermal inversion based on borehole Ro data. The variation trend of the erosion thickness can be constrained by the exposed stratum in the geological map.
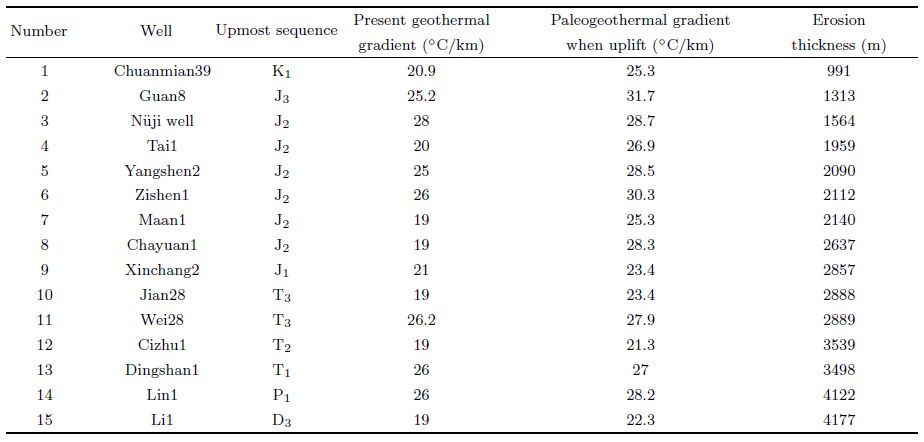
Erosion thicknesses of boreholes inversed from the paleogeothermal are listed in Table 1. There exists a clear correlation between the erosion thickness and the upmost sequence drilled by the Late Yanshanian-Himalayan wells in the western Hubei and eastern Chongqing area and the Sichuan Basin(Fig. 5): the greater age of the upmost sequence, the greater erosion thickness of the wells, and vice versa. When the latest formations are the Lower Cretaceous, the Middle Jurassic, the Upper Triassic, the Lower Triassic and the Paleozoic under the unconformity respectively, the corresponding erosion thicknesses are less than 1000m, 1500 m to 2000 m, ~2800 m, ~3500 m and more than 4000 m.
| Table 1 Erosion thickness of boreholes in Western Hubei Eastern Chongqing area and Sichuan Basin |

|
Fig.5 Relationship between erosion thickness and upmost sequence drilled by wells |
However, the prerequisites of the above method of drawing the erosion thickness plane graphs are: the variation is gentle in the thickness of the original formations, otherwise the erosion thickness should be adjusted according to the spatial variation in the formation thickness. The seismic interpretation profile in the Western Hubei Eastern Chongqing area clearly shows that the distribution of the formations were stable in a certain area before the uplift and erosion of the Yanshanian-Himalayan(Fig. 6). Therefore, none adjustments have been done when drawing the erosion thickness plane graphs.

|
Fig.6 Seismic interpretation profile across Chayuan1 well in the Western Hubei Eastern Chongqing area |
According to the above method, the erosion thickness plane graphs have been drawn(Fig. 7)by the interpolation method of Minimum Curvature. Generally, the Late Yanshan-Himalayan erosion amounts gradually decrease from east to west in the Western Hubei Eastern Chongqing area. The erosion thicknesses are more than 4000 m and 2000 m to 2500 m respectively in the north and south of the Lichuan synclinorium, which is located in the east of the study area. The erosion thicknesses are 1500 m to 2000 m and 2000 m to 2500 m respectively in the south and north of the Shizhu synclinorium, which is located in the middle of the study area. The erosion thicknesses are 3500 m to 4000 m and 1000 m to 1500 m respectively in the core and west of the Fangdoushan anticlinorium.

|
Fig.7 Contour map of Yanshan-Himalayan erosion thickness in the Western Hubei Eastern Chongqing area |
(1)The vitrinite reflectance(Ro)profiles of boreholes in the western Hubei Eastern Chongqing area do not show obvious “dislocations” or “jumps”, recorded maximum palaeotemperatures of sequences in the maximum burial depth. The paleogeothermal gradient inversion method can reconstruct the erosion thickness in the Late Yanshanian-Himalayan.
(2)There exists a clear correlation between the erosion thickness and the upmost sequence of the well: the greater age of the upmost sequence, the greater erosion thickness at the location of the wells, and vice versa.
(3)The combination of the paleogeothermal gradient inversion method and the geological map can constrain the spatial variation of the erosion thickness more accurately. Generally, the Late Yanshan-Himalayan erosion amount gradually decreases from east to west in the Western Hubei Eastern Chongqing area.
ACKNOWLEDGMENTSThis paper was financially supported by the National Key Foundational Research and Development Project(2012CB214806) and the National Science & Technology Special Project(2011ZX05005).
| [1] | Fu Y X. 2000. The relations between the characteristics of structures and hydrocarbon accumulation between the west of Hubei province and the Chongqing province. Jianghan Petroleum Science and Technology (in Chinese), 10(2):63-66, 72. |
| [2] | Hu C X, Gao L, Liu Y. 2000. Tectonic characteristics and evolution in the Western Hubei Eastern Chongqing area.Jianghan Petroleum Science and Technology (in Chinese), 10(2):59-62. |
| [3] | Hu S, Wang J S, Zhang R Y. 1999. Estimation of the amount of uplift and erosion across an unconformity using vitrinite reflectance data. Petroleum Exploration and Development (in Chinese), 26(4):42-45. |
| [4] | Lu Q Z, Ma Y S, Guo T L, et al. 2007. Thermal history and hydrocarbon generation history in Western Hubei-eastern Chongqing Area. Chinese Journal of Geology (in Chinese), 42(1):189-198. |
| [5] | Sheng X C, Wang S H, Wen K D, et al. 2004. Tectonics and sedimentology of Shizhu palaeohigh in western Hubei eastern Chongqing area. Marine Origin Petroleum Geology (in Chinese), 9(2):43-52. |
| [6] | Shi H C, Shi X B, Yang X Q, et al. 2011. Exhumation process of the Fangdoushan-Shizhu fold belt in Meso-Neozoic and its tectonic significance in western Hubei-eastern Chongqing. Progress in Geophysics (in Chinese), 26(6):1993-2002. |
| [7] | Sweeney J J, Burnham A K. 1990. Evaluation of a simple model of vitrinite reflectance based on chemical kinetics.AAPG, 74(10):1559-1570. |
| [8] | Xiao K H, He J H. 2001. Factors affecting hydrocarbon reservoir formation and future exploration planning in west Hubei and East Chongqing. Journal of Jianghan Petroleum University of Staff and Workers (in Chinese), 14(2):38-40. |
| [9] | Yuan Y S, Zheng H R, Tu W. 2008. Methods of eroded strata thickness restoration in sedimentary basins. Petroleum Geology & Experiment (in Chinese), 30(6):636-642. |
| [10] | Yuan Y S, Sun D S, Zhou Y, et al. 2010. Determination of onset of uplifting for the Mid-upper Yangtze area after Indosinian event. Chinese J. Geophys. (in Chinese), 53(2):362-369. |