 2014, Vol. 57


2. Exploration and Development Research Institute, Northwest Oilfield Company, Sinopec, Urumqi 830011, China
Elastic wave velocity of rocks VP, VS and velocity anisotropy are the basis to establish material composition and structure models of the crust and upper mantle, which plays an important role in underst and ing evolution of Earth’s crust and mantle. It is the most effective method to investigate the Earth’s interior material composition, structure and physical state, and has been widely applied to regional tectonic study and shallow seismic exploration(Christensen and Mooney, 1995; Rudnick and Fountain, 1995; Weiss et al., 1999; Gao et al., 2000; Park and Levin, 2002; Zhang, 2002; Ji et al., 2006, 2007; Barberini et al., 2007; Chen et al., 2007; Peng et al., 2007; Wang, 2007; Zhang et al., 2008).
In addition to mineral composition, there are many others factors which influences on seismic properties of rocks, such as pressure, temperature, porosity, and fluids(Potter and Mast, 1963; Nur and Simmons, 1969; Timur, 1977; Witt and Braun, 1983; Liu et al., 1998; Zhang et al., 1999; Koesoemadinata and McMechan, 2004; Liu et al., 2005; Su et al., 2005; Wang et al., 2007; Crampin and Peacock, 2008; Chichinina et al., 2009). At low pressures, some factors have a much greater influence on seismic waves than mineral composition. For example, some scholars believe that the porosity and fluid are main factors in affecting the rock wave velocity in the upper crust(Wang, 2007; Wang et al., 2007). At present, a number of studies on the relationship between seismic velocity and its influencing factors have been presented for the rocks from different regions(Batzle and Wang, 1992; Li and Ma, 1994; Best, 1997; Liu et al., 1998; Khaksar et al., 1999; Shi et al., 2001, 2003; Lu et al., 2005; Li and Li, 2009; Xiao et al., 2010), which suggest that the velocities are variable because these rocks are from different places even if their lithology is same. That is, no fixed velocities can be employed in any area.
The Yanchang oilfield is one of the important production bases for oil and gas in China, but now no data of seismic waves have been reported except our data of the VP, and VS(Qiao et al., 2012). It is well known that the interpretation of seismic data needs some extrapolated and interpolated data, and if the law is obtained that the nature of elastic wave changes with pressure(confining pressure), temperature for all kinds of typical rocks, it is more important for us to interpret seismic data. Therefore, it is necessary to study the seismic wave properties in this area, and it can provide an important basis for the interpretation of seismic data, identifying oil and water zone and comparing with well log data from that region. Because the nature of seismic waves is scarcely affected by temperatures(Timur, 1977; Li and Ma, 1994; Lu et al., 2005; Sun, 2006; Xiao et al., 2010), this work focuses on the study of effects of pressures and pore fluids on seismic wave velocities and their anisotropy of s and stones.
2 EXPERIMENTAL METHODS 2.1 SamplesThe samples used in this work were collected from the Yanchang oilfield which is located in the eastern part of the North Shaanxi slope in the Ordos basin. In regional structure, it is a gentle west-dipping monocline, with partial low amplitude nose uplift which was formed by differential compaction(Zhai et al., 1996; Li et al., 2005). The Yanchang Formation is a set of river - delta - lacustrine facies strata which was accumulated by terrigenous clastic sedimentary rocks during Ordos basin’s continual depression and stable settlement process in the Late Triassic(Wu et al., 2004; Qu et al., 2011). The three types of s and stone samples used in the experiment were taken from the Yanchang Formation, which are named Y1, Y2, and Y3, respectively. They were cut from drilling cores of three boreholes at different depths and different horizons of reservoirs. The details of sample parameters are shown in Table 1.
| Table 1 Composition, grain size, density and porosity of the samples |

To prepare the samples for velocity measurements, these cylindrical samples were cut approximately 2.5 cm in diameter and 5 cm in length along the direction parallel and perpendicular to the bedding planes, respectively, and the newly made samples are denoted by H(horizontal direction) and V(vertical direction)(Best, 2007), respectively. After polishing the surface treatment, all H and V samples were kept at 90°C in a vacuum oven for more than 48 h, or under vacuum with distilled water(or kerosene)for more than 24 h.
2.2 Basic Equipment and Measurement TechnologyThe compressional(P) and shear(S)wave velocity of the s and stone samples were measured by the pulse transmission method using the AutoLab series(Deng et al., 2005; He et al., 2010; Purcell et al., 2010; Mur et al., 2011). The 2000 Laboratory System of New Engl and Research, Inc.(NER)that can measure one compressional and two orthogonally polarized shear waves(SH and SV)(He et al., 2010; Purcell et al., 2010; Mur et al., 2011), and record these waveforms simultaneously under simulated in-situ high pressure and temperature conditions is used. For V samples, in fact only a polarized shear waves SH can be measured(Best, 2007). The P and S-wave center frequencies are 700 and 200 kHz, respectively. The maximum pressure on samples can reach 200 MPa, and the relative pressure error is ±0.5%.
According to the Hornby’s method(Hornby, 1998), the transmission method limits the relative P-wave velocity(VP) and S-wave velocity(VS)measurement errors below 1.0%, 0.77%, respectively. Pore fluids used to fill the core samples were the deionized water and kerosene. At ambient temperature, the P and S wave velocities of each s and stone sample were measured in turn in dry, water- and oil-saturated conditions from 5 MPa or 10 MPa to 180 MPa. To obtain reliable data of wave velocities, the core samples were held at the designed pressure for at least 30 minutes to make sure that the measurement system was stabilized.
3 RESULTS AND DISCUSSION 3.1 Wave Velocities VP, VSH and VSVFigure 1 shows the compressional and shear wave velocities in dry, water- and oil-saturated conditions changing with confining pressure for samples Y1(H) and Y1(V). It can be seen that the three velocities VP, VSH and VSV display a pressure dependent logarithmic curve(for P-wave, the fitting equation and correlation coefficient are embedded in the Figure; according to the relationship between pressure and depth(Wu et al., 2011), the coordinates of the reference depth are also given). For all VP, except few data the oil-saturated velocity is highest, followed by the water-saturated velocity, and the smallest is the dry velocity, namely, the oil-saturated>water-saturated>dry. This is in general agreement with the previous report(Shi et al., 1998). For all VSH and VSV, the sequence of velocities is the oil-saturated>dry>water-saturated.

|
Fig.1 P-and S-wave velocities in dry, water- and oil-saturated conditions changing with confining pressure for (a) sample Y1 (H) and (b) sample Y1 (V) |
Above the results can be interpreted by the following theory.
According to the equation of elastic wave velocity(Mavko, 2008), the water or oil filling the rock sample can have two influences on the compressional and shear wave velocities spread in those samples: the first one is to increase the effective bulk and shear modulus of the sample, so that the wave velocities are increased; the second one is to increase the density of the sample, so that the wave velocities are decreased.
Such as VP for Y1(H) and Y1(V), at low pressure the water or oil filling the pore of sample mainly increases the effective modulus of the sample. According to the equation of elastic wave velocity(Mavko, 2008), VP in the water- or oil-saturated condition will be higher than in dry condition, and the corresponding curves are above the dry curve(Fig. 1). With increasing pressure, the density of the sample filled with water or oil is also increased. Similarly, it can be known from the equation of elastic wave velocity(Mavko, 2008), the water-or oil-saturated VP will be reduced, comparing with the dry VP, there is a smaller difference between them, so that the corresponding three VP curves gradually approach. When the pressure is increased to about 130 MPa, the water-saturated curve intersects the dry curve; at pressures over 150 MPa the dry curve is located above the water-saturated one, and gets close to the oil-saturated one(Figs. 1(a, b)). In addition, the viscosity coefficient of oil is greater than water, and its density is smaller than water, relatively speaking, the oil filling the sample makes the effective elastic modulus of the sample increase more dramatically, and it also makes the density of the sample increase more slowly. So, in general, VP in the oil-saturated condition is larger than those in water-saturated condition(Figs. 1(a, b)).
For VS, there is a more complex situation than VP. The water filling the pore of the sample mainly increases its density. According to the equation of elastic wave velocity(Mavko, 2008) and the physical properties of oil and water, VSH and VSV in the water-saturated condition will be smaller than that in dry and oil-saturated conditions. However, VSH and VSV in the oil-saturated condition are affected mainly by increase of elastic modulus at low pressure. It can be known from the equation of elastic wave velocity(Mavko, 2008), VSH and VSV will be bigger than the corresponding ones in the dry condition. With increasing pressure, the effect of increasing of density of the sample on VS gradually predominates, and there is a smaller difference between oil-saturated VS and dry VS, so that the corresponding two VSH or VSV curves gradually become approximately parallel(Fig. 1a), or the dry curve is located above oil-saturated one(Fig. 1b). Furthermore, when the pressure exceeded 100 MPa, water-saturated VSH and VSV have no big difference, which also indicates the effect of increasing the density on VSH(Fig. 1a).
From Figs. 1a and b, it can be seen that dry, water- and oil-saturated velocities(except water-saturated VSH)for Y1(H)are basically greater than the corresponding ones for Y1(V). This suggests that the velocity anisotropy lies in s and stone Y1. In addition, except water-saturated VSH, other velocity-pressure curves for Y1(H)are approximately parallel to the corresponding ones for Y1(V)(Fig. 2). It indicates that Y1(H)has the same trend in velocity with rising pressure as Y1(V), although Y1 has a character of velocity anisotropy.

|
Fig.2 Comparison of measured (a) P- and (b) S-wave velocity for samples Y1 (H) and YI (V) in different pore fluid conditions under different confining pressures |
Figure 3 shows the VP, VSH and VSV in dry, water- and oil-saturated conditions changing with confining pressure for Y2(H) and Y2(V). It is clear that the three velocities display a pressure dependent logarithmic curve. This is similar to Y1, but it is different from Y1 for the relation between the dry, water- and oil-saturated velocities. Specifically, for all VP, the sequence of velocities is the water-saturated>dry>oil-saturated; for all VSH and VSV, that is the dry>water-saturated>oil-saturated. It is obvious that it is the oil-saturated velocity that results in above difference between Y2 and Y1. The reasons are explained as follows.

|
Fig.3 P-and S-wave velocity in dry, water and oil saturated conditions changing with confining pressure for (a) sample Y2 (H) and (b) sample Y2 (V) |
Firstly, s and stones Y2 and Y1 have different grain sizes. It can be seen from Table 1 and Fig. 4 that Y2 and Y1 are mainly composed of the fine and mid-sized s and s, respectively. Commonly, the pores in the fine particles s and stone should be tinier than those in the coarse particles ones. If fine-particle s and stone is full of oil, it is easier to be compacted, and further, this will result in a more obvious effect of increasing density. Therefore, for Y2, the oil-saturated velocities with pressure rise have a slower increase than the dry and watersaturated velocities. In addition, compared with the corresponding Y1, the relationship between the dry and water-saturated velocities remains unchanged because they do not vary with grain size.

|
Fig.4 Microscopic photographs for sample Y1 (a) and Y2 (b)The mineral grains marked with Qtz, Fsp, Bt and Deb are quartz, feldspar, biotite and debris, respectively. |
Secondly, Y2 might have a lower oil-bearing saturation than Y1. The lower oil-bearing saturation only causes a slow increase in the effective elastic modulus of the sample as the pressure rises, and it makes the wave velocity increase slowly. In fact, all of these are caused by the narrow pores in the fine particle s and stone Y2, where it is difficult for the relatively large viscosity oil to go through. Therefore, for Y2 the oil-bearing saturation will be lower than the water-bearing saturation.
From Fig. 5, three kinds of wave velocities for Y2(H)are basically greater than the corresponding ones for Y2(V)in the different pore fluid conditions. This implies that the velocity anisotropy is present in s and stone Y2. In addition, the velocity-pressure curves for Y2(H)are almost parallel to the corresponding ones for Y2(V), which means that Y2(H)has the same rule of velocity with pressure rises as Y2(V)although Y2 has a characteristic of velocity anisotropy.

|
Fig.5 Comparison of measured (a) P-and (b) S-wave velocity for samples Y2 (H)and Y2 (V) in different pore fluid conditions under different confining pressures |
Figure 6 shows the VP, VSH and VSV in dry, water- and oil-saturated conditions changing with pressure for sample Y3(H) and Y3(V). It is obvious that the three velocities display a pressure dependent logarithmic curve. This is similar to Y1 and Y2. In addition, there is an important similarity or universal law which holds for Y1, Y2 and Y3 that the slope of the longitudinal wave in the oil-saturated condition is much larger than that in the water-saturated condition(Fig. 6). This can be used to distinguish oil zones and water zones.

|
Fig.6 P-and S-wave velocity in dry, water and oil saturated conditions changing with confining pressure for (a) sample Y3 (H) and (b) sample Y3 (V) |
But for Y3, the relationship between the three wave velocities is different from the Y1 and Y2. For all VP, the sequence of velocities is the oil-saturated≈dry>water-saturated; for all VSH and VSV, that is the dry>oilsaturated> water-saturated. The main reason may be that Y3 has a larger porosity than Y1 and Y2(Table 1). Once the pore space of Y3 is filled with water or oil, the effect of increasing density of the sample will gradually predominate as pressure rises, so that the increase trend of wave velocities will slow down significantly. In addition, the water’s density is larger than oil, so it will have a greater impact on the wave velocity than oil. Therefore, no matter the wave velocity is VP or VSH and VSV, the wave velocity in water-saturated condition is the smallest(Fig. 6).
Moreover, because the wave velocities of Y3(H) and Y3(V)are affected by porosity, the VP, VSH and VSV-pressure curves are not so parallel as those of Y1(H, V) and Y2(H, V)(Fig. 7). It suggests that Y3 has nearly no velocity anisotropy, which will be further explained below.

|
Fig.7 Comparison of measured (a) P-and (b) S-wave velocity for samples Y3 (H) and Y3 (V) in different pore fluid conditions under different confining pressures |
As shows in Figs. 1-3 and 5-7, all VP and VS display rapid, nonlinear increases with pressures at below 50 MPa and then increase slowly and linearly in velocity at high pressures(Figs. 1-3, 5-7). The transition from the nonlinear regime to the linear regime is caused by the closure of microcracks in samples with increasing pressure(Birch, 1961; Carlson and Gangi, 1985; Hao et al., 1985; Liu et al., 1995; Yang et al., 1997; Kern et al., 2001; Li et al., 2005; Higo et al., 2006; Mao et al., 2006; David and Zimmerman, 2012; Sun et al., 2012). Because all VP and VS display a pressure dependent logarithmic curve in the range from 0~180 MPa, for the convenience of description, in this paper the equations of the nonlinear and linear regime are not given.
The microcracks have an effect on velocity anisotropy at below 50 MPa as well as wave velocity, and it will addressed from the following section.
3.2 Wave Velocity Anisotropy Coefficients ε, γ and ζAccording to the literature(Thomsen, 1986; Best et al., 2007), the velocity anisotropy of P- and S-wave can be expressed as follows

Figure 8 shows the velocity anisotropy coefficients ε, γ and ζ changing with pressure for Y1. It can be seen that ε, γ and ζ basically decrease with confining pressure rise, and display different pressure dependent curves in the different pore fluid conditions. In water-or oil-saturated conditions, they can be represented by a quadratic function, and the correlation coefficients are basically below 90%. Especially, the water-saturated γ has a lower correlation with pressure, and its values are almost less than zero. It indicates that Y1 has a weak nature of velocity anisotropy for S wave in the watersaturated condition. Relatively speaking, the dry ε, γ and ζ have a higher correlation with pressure, and they display a pressure dependent power function curve(see Eqs.(6)-(8)). In addition, except ζ, the oil-saturated ε, γ at higher pressures(>50 MPa)are larger than the corresponding dry and water-saturated ones(at 0~50 MPa ε and γ mainly affected by cracks and pores), which is similar to the anisotropy of attenuation coefficient(Shi and Deng, 2005). Under the same pore fluid condition, the relationship between ε, γ and ζ is more complex. Such as the relationship ζ > γ > ε is in the dry condition, the ε > ζ > γ is in the water-saturated condition, but in the oil-saturated condition the relationship becomes γ > ε > ζ.

|
Fig.8 Wave velocity anisotropy parameters ε, γ and ζ for sample Y1 changing with different pore fluid conditions under different confining pressures |

|
Fig.9 Relationships between wave velocity anisotropy parameters ε, γ and ζ for sample Y1 changing with different pore fluid conditions under different confining pressures |
In the dry condition:

In the water-saturated condition:

In the oil-saturated condition:

It can be seen that the anisotropy coefficients ε, γ and ζ exhibit a close correlation with pressure and the fluid property, that is, their three-dimensional graphs are basically distinguished from each other.
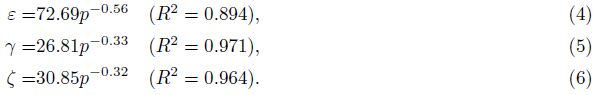
Figure 10 shows the velocity anisotropy ε, γ, and ζ varying with pressure for Y2. It can be seen that ε, γ and ζ basically decrease with confining pressure rise, displaying pressure dependent power function curves in the different pore fluid conditions, and the correlation coefficients are basically greater than 90%. In addition, the oilsaturated ε, γ, and ζ at higher pressures(> 50 MPa)are larger than the corresponding dry and water-saturated ones(at 0~50 MPa ε, γ and ζ are mainly affected by cracks and pores), which is similar to the anisotropy of attenuation coefficients(Shi and Deng, 2005). Under the same pore fluid condition, the relationship between ε, γ and ζ is expressed as ε > γ > ζ, which is different from Y1. It might be because Y2 has a finer granularity than Y1, so that it has a significant effect on velocity anisotropy as well as P- and S-wave. The fitting results are presented in the following equations.

|
Fig.10 The wave velocity anisotropy parameters ε, γ and ζ for sample Y2 changing with different pore fluid conditions under different confining pressures |
In the dry condition:
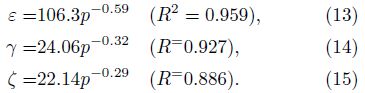
In the water-saturated condition:

In the oil-saturated condition:
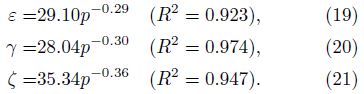
Figure 11 shows that the anisotropy factor ε, γ, ζ for Y2 varying with confining pressure in the dry, water- and oil-saturated conditions. It can be seen that ε, γ and ζ exhibit a good correlation with pressure and fluid property. By fitting, the results are expressed as the Eqs.(22)-(27). It is clear that all of the correlation coefficients are greater than or equal to the corresponding those for Y1. This might be related with the finer granularity of Y2.

|
Fig.11 Relationships between wave velocity anisotropy parameters ε, γ and ζ for sample Y2 changing with different pore fluid conditions under different confining pressures |
In the dry condition:

In the water-saturated condition:

In the oil-saturated condition:
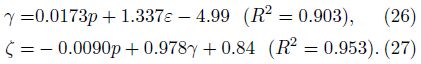
Figure 12 shows that the anisotropy factor ε, γ and ζ for Y3 vary with confining pressure in the dry, water- and oil-saturated conditions. It can be seen that almost all values of ε, γ and ζ are negative and their absolute values are around 1, which is significantly different from those of Y1 and Y2. There are two possible reasons for the negative values. Firstly, this work did not use the conventional method to calculate the anisotropy factor(i.e. the velocity difference between the maximum and minimum velocities)(Birch, 1961; Babuška, 1984). Secondly, it may be related to the sedimentary environment where the samples Y3 type were taken from the fluvial deposit, but Y1 and Y2 were from the lake and delta deposit, respectively(Li et al., 2005). In this regard there are no relevant reports at present. Based on the above analyses of the velocity and anisotropy factor of Y3, the velocity anisotropy in Y3 is considered weak, or even there is no velocity anisotropy in Y3.

|
Fig.12 Wave velocity anisotropy parameters ε, γ and ζ for sample Y3 changing with different pore fluid conditions under different confining pressures |
(1)The wave velocities VP, VSH and VSV for all the H and V samples cut from three kinds of samples of s and stone Y1, Y2 and Y3 change basically logarithmically with increasing confining pressure p, and all the correlation coefficients are over 90%(except dry VP for Y3). For all VP, the slopes of the oil-saturated curves are greater than those of the corresponding water-saturated curves. These results can be used to distinguish oil zones from water zones, i.e. serving as a significant symbol to identify oil and water zones.
(2)The relationships between wave velocities in dry, water and oil saturated conditions are obviously different for different types of s and stones Y1, Y2 and Y3, mainly because of distinct mechanic parameters, rock structures and fluid properties of those s and stone samples.
(3)For all H samples from Y1 and Y2, VP, VSH and VSV in dry, water- and oil-saturated conditions are larger than the corresponding ones of the V samples, while they have largely the same law as the corresponding wave velocity, except Y3 does not have the above characteristics.
(4)For two kinds of s and stones Y1 and Y2, velocity anisotropy parameters ε, γ and ζ change in a power function or quadratic curve with increasing confining pressure, Y2 has a greater correlation coefficient of anisotropy parameters than Y1, while there is no velocity anisotropy in Y3.
(5)The anisotropy factors ε, γ and ζ of Y1 and Y2 exhibit a close correlation with pressure and fluid property, and ε, γ in the oil-saturated condition are larger than that in the corresponding water-saturated condition at the experimental pressure. This can be also used to distinguish oil zones from water zones, and it is also a significant symbol to identify oil and water zones.
(6)The experimental results presented in this paper provide an important basis for the interpretation of seismic data, identifying oil and water zones and comparison of well log data in the study area. They are also evidence for correct explanation of data from deep geophysical exploration.
5 ACKNOWLEDGMENTSThe authors are grateful to Wang Hongcai, Zhao Weihua and Sun Dongsheng at Institute of Geomechanics for their help. We are also indebted to the anonymous reviewers for their valuable comments and suggestions on the manuscript. This work was supported by the Fundamental Research Fund of Institute of Geomechanics, Chinese Academy of Geological Sciences(DZLXJK201004), and the Deep Exploration in China Program(SinoProbe-07).
| [1] | Babuška V. 1984. P-wave velocity anisotropy in crystalline rocks. Geophysical Journal International, 76(1):113-119. |
| [2] | Barberini V, Burlini L, Zappone A. 2007. Elastic properties, fabric and seismic anisotropy of amphibolites and their contribution to the lower crust reflectivity. Tectonophysics, 445(3-4):227-244. |
| [3] | Batzle M, Wang Z J. 1992. Seismic properties of pore fluids. Geophysics, 57(11):1396-1408. |
| [4] | Best A I. 1997. The effect of pressure on ultrasonic velocity and attenuation in near-surface sedimentary rocks. Geophysical Prospecting, 45(2):345-364. |
| [5] | Best A I, Sothcott J, McCann C. 2007. A laboratory study of seismic velocity and attenuation anisotropy in near-surface sedimentary rocks. Geophysical Prospecting, 55(5):609-625. |
| [6] | Birch F. 1961. The velocity of compressional waves in rocks to 10 kilobars, part 2. Journal of Geophysical Research, 66(7):2199-2224. |
| [7] | Carlson R L, Gangi A F. 1985. Effect of cracks on the pressure dependence of p wave velocities in crystalline rocks. Journal of Geophysical Research, 90(B10):8675-8684. |
| [8] | Chen Y, Zhang Z J, Sun C Q, et al. 2013. Crustal anisotropy from Moho converted Ps wave splitting analysis and geodynamic implications beneath the eastern margin of Tibet and surrounding regions. Gondwana Research, 24(3-4):946-957. |
| [9] | Chichinina T I, Obolentseva I R, Ronquillo-Jarillo G. 2009. Anisotropy of seismic attenuation in fractured media:theory and ultrasonic experiment. Transport in Porous Media, 79(1):1-14. |
| [10] | Christensen N I, Mooney W D. 1995. Seismic velocity structure and composition of the continental crust:A global view. J. Geophys. Res., 100(B6):9761-9788. |
| [11] | David E C, Zimmerman R W. 2012. Pore structure model for elastic wave velocities in fluid-saturated sandstones. Journal of Geophysical Research, 117(B7), doi:10.1029/2012JB009195. |
| [12] | Deng J X, Wang S X, Yu J. 2005. Experimental results in partially saturated sandstone under condition of different pressure and their theoretical interpretation. Oil Geophysical Prospecting (in Chinese), 40(5):530-534. |
| [13] | Crampin S, Peacock S. 2008. A review of the current understanding of seismic shear-wave splitting in the Earth's crust and common fallacies in interpretation. Wave Motion, 45(6):675-722. |
| [14] | Gao S, Kern H, Liu Y S, et al. 2000. Measured and calculated seismic velocities and densities for granulites from xenolith occurrences and adjacent exposed lower crustal sections:a comparative study from the North China craton. J. Geophys. Res., 105(B8):18965-18976. |
| [15] | Hao J S, Lu X H, Li J H. 1985. An experimental study on the density and elastic wave velocity of typical rocks of north china under high pressure up to 10kb. Acta Seismologica Sinica (in Chinese), 1(3):276-284. |
| [16] | He T, Zou C C, Pei F G, et al. 2010. Laboratory study of fluid viscosity induced ultrasonic velocity dispersion in reservoir sandstones. Applied Geophysics, 7(2):114-126. |
| [17] | Higo Y, Inoue T, Li B S, et al. 2006. The effect of iron on the elastic properties of ringwoodite at high pressure. Physics of the Earth and Planetary Interiors, 159(3-4):276-285. |
| [18] | Hornby B E. 1998. Experimental laboratory determination of the dynamic elastic properties of wet, drained shales. Journal of Geophysical Research, 103(B12):29945-29964. |
| [19] | Ji S C,Wang Q,Wang Q, et al. 2007. Correlation between elastic properties and density for Sulu-Dabie UHP metamorphic rocks. Acta Petrologica Sinica (in Chinese), 23(12):3054-3064. |
| [20] | Ji S C, Wang Q, Denis M, et al. 2006. Pressure-dependence of P-wave velocities in Sulu UHP metamorphic rocks. Acta Geologica Sinica (in Chinese), 80(12):1807-1812. |
| [21] | Kern H, Popp T, Gorbatsevich F, et al. 2001. Pressure and temperature dependence of VP and VS in rocks from the superdeep well and from surface analogues at Kola and the nature of velocity anisotropy. Tectonophysics, 338(2):113-134. |
| [22] | Khaksar A, Griffiths C M, McCann C. 1999. Compressional- and shear-wave velocities as a function of confining stress in dry sandstones. Geophysical Prospecting, 47(4):487-508. |
| [23] | Koesoemadinata A P, McMechan G A. 2004. Effects of diagenetic processes on seismic velocity anisotropy in near-surface sandstone and carbonate rocks. Journal of Applied Geophysics, 56(3):165-176. |
| [24] | Li A B, Ma L Y. 1994. Effects of frequency and temperature on shear velocity and Q-s in sandstone. Chinese J. Geophys.(in Chinese), 37(5):653-658. |
| [25] | Li H, Wang L S, Li C, et al. 2005. Experimental study on wave velocity of rocks from tarim basin at high PT conditions and its geological implications. Geological Journal of China Universities (in Chinese), 11(4):601-607. |
| [26] | Li J, Li S G. 2009. Characteristics and changes of rock acoustic velocity under the temperature and pressure of natural reservoir. Chinese Journal of Engineering Geophysics (in Chinese), 6(6):765-768. |
| [27] | Li L J, Yan G J, Chen J W. 2005. Influences of fluid on velocities of seismic wave. Marine Geology Letters (in Chinese), 21(9):8-12. |
| [28] | Li Y H, Zhang H A, Wei X Y, et al. 2005. Sedimentary characteristics and distribution of oil and gas in Chang 6 in the Yanchang oilfield. Journal of Northwest University (Natural Science Edition) (in Chinese), 35(5):606-610, 616. |
| [29] | Liu Y X, Wu F Y, Zhang S H. 1995. The characteristics of elastic wave velocity of rocks at high t and p:implications for the study of deepseated geology. Progress in Geophys. (in Chinese), 10(3):82-94. |
| [30] | Liu B, Kern H, Popp T. 1998. Velocities and attenuation of P- and S-waves in dry and wet rocks with different porosities under different confining pressures. Chinese J. Geophys. (in Chinese), 41(4):537-546. |
| [31] | Lu L, Yan G J, Chen J W. 2005. Influences of temperature and pressure on velocities of seismic wave. Marine Geology Letters (in Chinese), 21(9):13-16, 21. |
| [32] | Ma Z G, Wu X Y, Wang Z H. 2006. Effect of effective pressure on compressional and shear wave velocities. Progress in Exploration Geophysics (in Chinese), 29(3):183-186. |
| [33] | Mavko G, Mukerji T, Dvorkin J. 2008. The Rock Physics Handbook:Tools for Seismic Analysis of Porous Media (in Chinese). Translated by Xu H B, Dai J C. Hefei:Press of University of Science and Technology of China, 45. |
| [34] | Mur A, Purcell C, Soong Y, et al. 2011. Integration of core sample velocity measurements into a 4D seismic survey and analysis of SEM and CT images to obtain pore scale properties. Energy Procedia, 4:3676-3683. |
| [35] | Nur A, Simmons G. 1969. The effect of saturation on velocity in low porosity rocks. Earth Planet. Sci. Lett., 7(2):183-193. |
| [36] | Park J, Levin V. 2002. Seismic anisotropy:tracing plate dynamics in the mantle. Science, 296(5567):485-489. |
| [37] | Potter P E, Mast R F. 1963. Sedimentary structures, sand shape fabrics, and permeability. The Journal of Geology, 71(4):441-471. |
| [38] | Purcell C, Mur A, Soong Y, et al. 2010. Integrating velocity measurements in a reservoir rock sample from the SACROC unit with an AVO proxy for subsurface supercritical CO2. The Leading Edge, 29(2):192-195. |
| [39] | Qiao E W, Zhao W H, Long C L. 2012. A laboratory study of seismic wave velocity in sandstone bearing differential pore fluids at different pressures. Chinese J. Geophys. (in Chinese), 2012, 55(12):4257-4265. |
| [40] | Qu H J, Yang X C, Cao J Z, et al. 2011. Oil accumulation rules in deep zones of Upper Triassic Yanchang Formation in Ordos Basin. Acta Petrolei Sinica (in Chinese), 32(2):243-248. |
| [41] | Rudnick R L, Fountain D M. 1995. Nature and composition of the continental crust:A lower crustal perspective. Rev. Geophys., 33(3):267-309. |
| [42] | Shi G, Deng J X. 2005. Experimental study on the attenuation anisotropy of shale and mudstone under reservoir condition. Science in China (Series D) (in Chinese), 35(3):268-275. |
| [43] | Shi G, Shen W L, Yang D Q. 2003. The relationship of wave velocities with saturation and fluid distribution in pore space. Chinese J. Geophys. (in Chinese), 46(1):138-142. |
| [44] | Shi G, Yang D Q. 2001. The regression analysis study on velocity and porisity, and clay content of rocks. Acta Scientiarum Naturalium Universitatis Pekinensis (in Chinese), 37(3):379-384. |
| [45] | Shi X J, Xia C J, Wu Y G. 1998. The laboratory study on wave velocity under reservoir condition and its affection factors. Chinese J. Geophys. (in Chinese), 41(2):234-241. |
| [46] | Su X J, Yan G J, Chen J W, et al. 2005. Influences of rock pore and clay content on velocities of seismic. Marine Geology Letters (in Chinese), 21(9):3-7. |
| [47] | Sun J G. 2006. Rock Physics (in Chinese). Beijing:Geology Press, 112. |
| [48] | Sun S S, Ji S C, Wang Q, et al. 2012. Seismic velocities and anisotropy of core samples from the Chinese Continental Scientific Drilling borehole in the Sulu UHP terrane, eastern China. Journal of Geophysical Research, 117, doi:10.1029/2011JS008672. |
| [49] | Thomsen L. 1986. Weak elastic anisotropy. Geophysics, 51(10):1954-1966. |
| [50] | Timur A. 1977. Temperature dependence of compressional and shear wave velocities in rocks. Geophysics, 42(5):950-956. |
| [51] | Wang Q. 2007. Experimental and theoretical study on seismic properties of rocks. Bulletin of Mineralogy Petrology and Geochemistry (in Chinese), 26(2):118-126. |
| [52] | Wang Y M, Miao Y K, Meng X J, et al. 2007. The impact of the fluid properties on the seismic wave velocities in rocks. Petroleum Geophysics (in Chinese), 5(3):36-39. |
| [53] | Weiss T, Siegesmund S, Rabbel W, et al. 1999. Seismic velocities and anisotropy of the lower continental crust:A review. Pure Appl. Geophys., 156(1-2):97-122. |
| [54] | Witt K J, Braun S J. 1983. Permeability-anisotropy due to particle-shape. Journal of Geotechnical Engineering, 109(9):1181-1187. |
| [55] | Wu F L, Li W H, Li Y H, et al. 2004. Delta sediments and evolution of the Yanchang Formation of Upper Triassic in Ordos Basin. Journal of Palaeogeography (in Chinese), 6(3):307-315. |
| [56] | Wu T R, He G Q. 2011. Physical Geology (in Chinese). 2nd ed. Beijing:Peking University Press, 27. |
| [57] | Xiao K, Zou C C, Nie X, et al. 2010. Experimental research of S-wave and P-wave velocities for rocks under the reservoir conditions in G sag, Jiangsu Oilfield. Chinese Journal of Engineering Geophysics (in Chinese), 7(6):688-693. |
| [58] | Yang S F, Cheng H L, Jiang J S, et al. 1997. The velocity characteristics and its geological significance of I and S type granite from Southern China under high temperature and high pressure. Science in China (Series D) (in Chinese), 27(1):33-38. |
| [59] | Zhai G M. 1996. Petroleum geology of China (in Chinese). Vol. 12. Beijing:Petroleum Industry Press, 67. |
| [60] | Zhang Z J. 2002. A review of the seismic anisotropy and its applications. Progress in Geophysics (in Chinese), 17(2):281-293. |
| [61] | Zhang Z J, Teng J W, He Z H. 1999. Azimuth anisotropic studies of Seismic velocity, attenuation and quality factor in EDA medium. Science in China (Series E) (in Chinese), 29(6):569-574. |
| [62] | Zhang Z J, Zhang X, Badal J. 2008. Composition of the curst beneath southeastern China derived from an integrated geophysical data set. Journal of Geophysical Research-Solid Earth, 113(B4), doi:10.1029/2006JB004503. |