 2014, Vol. 57


The effects of solar activities on the Earth’s climate and atmospheric circulation have been studied by many scholars(Lean et al., 1995; and Friis-Christensen Lassen et al., 1991; Friis-Christensen, 1993;Qu et al., 2004; Qu et al., 2012). Not only do the effects depend on the amount of solar radiation, but they also have an influence on the intensity and shape of the Earth’s magnetic field through the dramatic changes of the solar magnetic field. This alters the ability of the Earth’s magnetic field to trap charged particles, in turn causing the charged particles trapped by the Earth’s magnetic field to travel between the north and south poles around the magnetic force line of the Earth’s magnetic field under the Lorentz force, thereby releasing energy and heating the atmosphere. Although the amount of radiation does not increase significantly during solar activity, the ability of the Earth’s magnetic field to trap the solar radiation of all b and s increases by folds. Therefore, the increase of the Earth’s temperature is much greater than the growth of the amount of solar radiation. This signifies that solar activity exerts effects on the climate and physical environment of the Earth through the changes in both the solar radiation and magnetic field, the latter of which plays a greater role.
The establishment of the time series of MI(magnetic index)of the solar magnetic field provides a very reliable reference for detailed examination of the effects on geophysical events exerted by the polarity cycle of sunspots and magnetic field intensity. It also allow us to study and underst and the solar activity and its ways affecting the environment and physical events of the Earth from an angle of changes in the solar magnetic field. This paper investigates the effects on the arctic oscillation exerted by solar activity from the two aspects of changes in solar radiation and those in the solar magnetic field. The changes of the solar magnetic field and its effects on many geophysical events are becoming increasingly more evident, and the research on their relationship began long ago(Zhang and Xiao, 2000; Zhang et al., 1998; Shi and Wang, 1994;Dong., 1997; Liu et al., 2001; Qu et al., 2003).
AO(arctic oscillation)is an anti-phase oscillation phenomenon related to the pressure in the areas near the North Pole and mid-latitude pressure field around the pole, and it is the main type of atmospheric motion. In addition, the main variables in the Northern Hemisphere atmospheric motion all possess the AO oscillation mode. The atmospheric climate anomalies related to the abnormal changes in the AO have greatly exceeded the polar regions, ranging over the entire hemisphere. They show clear signs of links in terms of temperature, precipitation, sea ice, atmospheric activity center, monsoon, extreme weather events, and many other aspects (Gong et al., 2002; Thompson et al., 2000; Rigor et al., 2000; Thompson and Wallace, 1998). Such oscillation shows an equivalent barotropic characteristic from low to high altitudes; moreover, with the increase of height, this north-south oscillation form becomes clearer, and the variance contribution rate becomes much greater, thus the oscillation becomes the dominant form of atmospheric motion. AO has a very wide frequency domain, as both the interannual and decadal scales are very evident. Therefore, it is of great significance to study the regularities of the changes in the AO, especially the decadal variation characteristics, as they have become an important component of studies regarding unusual climate change.
What is the force source driving the AO phenomenon? Some studies have noted the effects of many factors, such as the fluctuation of sea ice and anomalies of the SST field. We think that these are merely phenomena which are directly related to each other. The anomalies of sea ice and sea surface temperature are the results of temperature anomalies, thus the abnormal changes in temperature, especially the changes in polar temperature, are the trigger of AO. The most important factor affecting the changes in polar temperature is solar activity; therefore we may link AO, polar temperature and solar activity together.
What is the force source driving the AO phenomenon? Some studies have noted the effects of many factors, such as the fluctuation of sea ice and anomalies of the SST field. We think that these are merely phenomena which are directly related to each other. The anomalies of sea ice and sea surface temperature are the results of temperature anomalies, thus the abnormal changes in temperature, especially the changes in polar temperature, are the trigger of AO. The most important factor affecting the changes in polar temperature is solar activity; therefore we may link AO, polar temperature and solar activity together.
The data used in this work were obtained from http://www.atmos.colostate.edu/ao/Data/ao index.html [2013-03-20].
2 ATMOSPHERIC CIRCULATION CHARACTERISTICS REFLECTED BY AOArctic oscillation(AO), also known as Northern Hemisphere annular mode(NAM), represents the inverse oscillation characteristics reflected by related signals in the polar and middle-latitude atmosphere regions of the Northern Hemisphere. However, it does not give specific atmospheric circulation characteristics. In order to further underst and the atmospheric circulation reflected by AO and explore its relevant factors, this study is founded on the atmospheric temperature-pressure field structure which has a clear physical meaning. In addition, the month was chosen when the oscillation form is at its clearest and the NAM time factor is at its largest. At this time, the distribution characteristics of large-scale atmospheric circulation in the Northern Hemisphere portray the basic reflection of AO in the atmospheric circulation during the positive phase period of AO. This is also the entry point for us to study the formation mechanisms of AO in terms of atmospheric circulation.
2.1 Differences of Atmospheric Circulation Characteristics at Positive and Negative Phase Periods of AO at Middle and High Latitudes of the Northern Hemisphere 1000 hPaDue to the rather barotropic vertical structure of AO, with the increase of height from sea level to the stratosphere, the north-south oscillation form of AO is clearer, thus we choose the middle troposphere 1000 hPa layer, with which newscasters are familiar with, to conduct the study.
From the time series of AO in January from 1889 to 2013, we can determine that the maximum value of the AO positive phase occurred in January, 1993(monthly anomaly: 4.162). In other words, regardless of whether being compared with various historical periods of AO or other oscillation modes, the characteristic of the annular mode at this time is the clearest. Therefore, this is the best time to study the causes of AO in terms of atmospheric circulation by investigating the characteristics of atmospheric circulation at this time in the Northern Hemisphere.
First, the monthly average of 1000 hPa geopotential height in the Northern Hemisphere(north of 20°N) in January, 1993 is obtained(Fig. 1a). It is clear that near the Arctic pole there is a deeply developed polar vortex; at the middle latitudes(20°N-50°N)surrounding the Arctic pole are smooth trough-ridge fluctuations; the three shallow high-pressure ridges lie respectively in the northern part of the Asian continent, northwestern part of the North American continent, and on the Atlantic coast of Africa and Europe. When the AO is in the positive phase, the barometric gradient which the central latitudes direct at the polar region is very large; the zonal circulation prevails in the central and high latitudes, which restricts the cold air in the polar regions from exp and ing southward; and the frequency of cold waves is lower, thus causing the Northern Hemisphere to have fewer frosts.

|
Fig.1 Geopotential height distributions of Northern Hemisphere SLP and 700 hPa in January 1993 and January 1997 |
The maximum value of the AO negative phase during the period from 1889 to 2013 occurred in January, 1940, the monthly anomaly of which was -3.451; and the second largest occurred in January, 1977, with a monthly anomaly of -3.279. Considering the fact that the density representativeness of the meteorological data from the 1940 s is inferior to that from the 1970s, and that the maximum value of the AO negative phase was -3.279 in January, 1977, we select January 1977 as the representative month to conduct our research.
Next we determine the monthly average of the geopotential height in the Northern Hemisphere 1000 hPa in January, 1977, as shown in Fig. 1b. It shows that the polar vortex shifts out of the polar region after filling and splitting, and what takes over is a polar closed high-pressure center. At the typical trough areas of the North American Great Lakes and East Asia, two deep cold vortexes are formed. Affected by this, the temperatures were abnormally low in the North American and Eurasian continents in January 1977.
Only the Atlantic coast of Europe and Pacific coast of North America was affected by the warm and wet airflow in front of the ridge, causing the climate there to be mild and rainy.
2.2 Differences of Atmospheric Circulation Characteristics at Positive and Negative Phase Periods of AO at Central and High Latitudes of the Northern Hemisphere 700 hPaDue to the rather barotropic vertical structure of AO, with the increase of height from sea level to the stratosphere, the north-south oscillation form of AO is clearer, thus we choose the middle troposphere 700 hPa layer, with which newscasters are familiar with, to conduct the study.
From the time series of AO in January from 1889 to 2013, we may determine that the maximum value of the AO positive phase occurred in January, 1993(monthly anomaly: 4.162). In other words, regardless of whether being compared with various historical periods of AO or other oscillation modes, the characteristics of the annular mode at this time are the clearest. Therefore, this is the best time to study the causes of AO in terms of atmospheric circulation by investigating the characteristics of atmospheric circulation at this time in the Northern Hemisphere.
First, the monthly average of 700 hPa geopotential height in the Northern Hemisphere(north of 20°N)in January 1993 is acquired, as shown in Fig. 1c. From Fig. 1c, near the Arctic pole there is a deeply developed polar vortex; the central latitudes(20°N-60°N)surrounding the Arctic pole are smooth trough-ridge fluctuations; the three shallow high-pressure ridges lie respectively in the northern part of the Asian continent, northwestern part of the North American continent, and on the Atlantic coast of Africa and Europe. When the AO is in the positive phase, the barometric gradient which the central latitudes direct at the polar region is very large; the zonal circulation prevails in the central and high latitudes, which restricts the cold air in the polar regions from exp and ing southward; and the frequency of cold waves is lower, thus causing the Northern Hemisphere to have fewer frosts.
The maximum value of the AO negative phase during the period from 1889 to 2013 occurred in January 1940, the monthly anomaly of which is -3.451; and the second largest occurred in January 1977, with a monthly anomaly of -3.279. Considering the fact that the density representativeness of the meteorological data from the 1940 s is inferior to that from the 1970 s, and that the maximum value of the AO negative phase is -3.279 in January 1977, we selected January 1977 as the representative month to conduct our research.
Next we calculate the monthly average of the geopotential height in the Northern Hemisphere 700 hPa in January, 1977, as shown in Fig. 1d. From the figure it may be seen that the polar vortex shifts out of the polar region after filling and splitting, and what takes over is a polar closed high-pressure center. At the typical trough areas of the North American Great Lakes and East Asia, two deep cold vortexes are formed. Affected by this, the temperatures were abnormally low in the North American and Eurasian continents in January, 1977.
Only the Atlantic coast of Europe and Pacific coast of North America was affected by the warm and wet airflow in front of the ridge, causing the climate there to be mild and rainy.
AO reveals the fluctuation law of pressure fields of polar regions and central latitude areas of the Northern Hemisphere. The following are the distribution characteristics of anomaly fields at the positive and negative phase periods of the AO in the polar regions and central latitudes 1000 hPa of the Northern Hemisphere.
Figure 2a shows that the air pressure is abnormally low in the polar regions at the positive phase of AO in January 1993, when the negative anomaly fell below -20 hPa; the area of 40°N surrounding the polar regions is the positive area; and the pleions of the African and European continent exceed +14 hPa. Therefore, the development level of AO in January mainly depends on the polar vortex and high-pressure ridge of the central latitudes. When the polar vortex and the high-pressure ridge of the central latitudes grow abnormally, the AO is strong; the air pressure of polar vortex active area drops and that of the high-pressure area in the central latitudes rises. Therefore, the barometric gradient between the central and high latitude areas increases greatly, while the west wind enhances and zonal circulation prevails.

|
Fig.2 Geopotential height distribution diagram of Northern Hemisphere 1000 hPa in January 1993 and January 1997 |
From Fig. 2b, the air pressure of the arctic region 1000 hPa is abnormally high during the negative phase of AO in January, 1977, at which time the positive anomaly exceeded +40 hPa. The area of 40°N surrounding the polar regions was the negative area; and the pleions of the North Atlantic Ocean fell below -20 hPa. Based on these observations, when the polar vortex and the high-pressure ridge of the central latitudes weakened abnormally in January, the AO also weakened. The air pressure of the polar vortex active area rose and that of the high-pressure area in the central latitudes dropped. Thus the barometric gradient between the central and high latitude areas decreased greatly; the west wind weakened; zonal circulation collapses and meridional circulation prevailed, and the cold and warm air exchange in the north and south was active.
2.3 Difference of Abnormal Distribution Characteristics of Temperature During the Periodof Positive and Negative Phases of AO in the Central and High Latitudes of the Northern Hemisphere 1000 hPa Figure 3 shows the thermal anomaly distribution characteristics during the period of the positive and negative phases of AO in the central and high latitudes of the Northern Hemisphere 1000 hPa. Fig. 3a is the thermal anomaly distribution diagram during the positive phase of AO to the north of 20°N in the Northern Hemisphere 1000 hPa in January, 1993. And then the temperature of the polar regions was abnormally low, which led to the decline of the isobaric surface and the abnormal deepening of the polar cyclone; the temperature of the central and high latitudes, other than in the polar regions, shows a predominantly positive anomaly, which resulted in the predominantly positive anomaly of the geopotential height field; the positive anomaly roughly corresponds to the locations of three shallow high-pressure ridges in the northern the Asian continent, northwestern North American continent and Atlantic coast of Africa and Europe. After comparing with Fig. 2a, we may see that the symbol distribution of temperature departure roughly shows a one-to-one correspondence with that of the geopotential height anomaly 1000 hPa in January, 1993, which signifies that the atmosphere was basically in a state of positive pressure.

|
Fig.3 Distribution diagram of temperature anomaly in the Northern Hemisphere SLP in January 1993 (a) and January 1997 (b) |
Figure 3b is the anomaly distribution of temperature during the negative phase of AO to the north of 20°N in the Northern Hemisphere 1000 hPa layer in January, 1977. The temperature was abnormally high at the polar regions and abnormally low in the central latitudes. The abnormally high temperature in the polar regions caused the polar vortex to shift out of the polar regions after filling and splitting, and what took over is a polar closed high-pressure center. The abnormally low temperature in the central latitudes caused the geopotential height to decline abnormally, which is the main cause of the formation of two deep cold vortexes in the trough area of the North American Great Lakes and the low-pressure area of East Asia deep trough-Aleutian. After comparing with Fig. 2b, it may be seen that the symbol distribution of temperature departure is roughly in one-to-one correspondence with that of the geopotential height anomaly in January, 1977 1000 hPa. This shows the rapid adaptation of geopotential height caused by the change of the atmosphere temperature field.
After comparing the positive and negative phases of AO, it may be observed that there are three major differences in the temperature field:
(1)The most significant difference during the periods of the positive and negative phases of AO is that the temperature changes from meions to pleions. The polar vortex is a deep cold low-pressure circulation system, and the rise of temperature leads to the recession and stuffing of the vortex system(Fig. 1); the geopotential height in the polar regions changes from a negative anomaly to a positive one(Fig. 2).
(2)Along 40°N, during the periods of the positive and negative phases of AO, the temperature changes from pleions into negative meions, and correspondingly the geopotential height field changes also from a positive anomaly belt into a negative one.
(3)During the period of the positive phase of AO in January 1993, the barometric gradient from the central and high latitudes to the Arctic region increased abnormally, which led to the abnormal enhancement of western wind circulation, the prevalence of zonal circulation surrounding the polar regions, and the effective separation of cold air in the Arctic area. During the period of the negative phase of AO in January 1977, the zonal circulation of the central and high latitudes surrounding the polar regions collapses; and the polar cyclone was split and separated into the North American Great Lakes cold vortex and East Asia cold vortex, which led to frequent cold waves in North America, Asia and most areas of the central latitudes in the Northern Hemisphere, resulting in a cold climate.
2.4 Cause and Significance of Abnormal Changes in Polar TemperaturesIf the temperature changes from meions into pleions during the periods of the positive and negative phases of AO in the Arctic regions, then what is the significance of the opposite changes of the polar temperature symbols? What factors cause the opposite changes of polar temperature symbols? And what is the relation between the changes in temperature and in the pressure field?
(1)Suppose the average temperature of the air column between the isobaric surfaces P1 and P2 is Tbm, based on the integral equation of statics, the geopotential thickness between the two isobaric surfaces Φ2 - >Φ1 is calculated as follows:
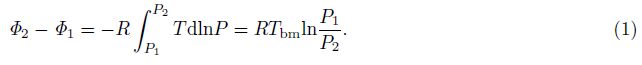
Based on this, the change of geopotential thickness Φ2 - >Φ1 between the two isobaric surfaces is determined by the average temperature of air column Tbm, and thus the abnormal change in polar temperature will lead to the changes of polar vortex strength. When the polar temperature rises abnormally, the 700 hPa geopotential height will increase; the polar vortex will weaken or even become high atmospheric pressure through filling. At the negative phase of AO in January 1977, the polar temperature was abnormally high, thus the polar vortex disappeared and a high-pressure center took over. When the polar temperature is abnormally low, the 700 hPa geopotential height will decrease and the polar vortex will deepen. For example, at the positive phase of AO in January 1993, the polar vortex deepened with the decline of polar temperature, the barometric gradient from the central and high latitudes to the Arctic region was abnormally large; and the west wind circulation strengthened and zonal circulation surrounding the pole prevailed.
(2)With the change of the pressure field, the distribution of temperature advection dominated by the high-pressure ridge changes accordingly, and thus affects the temperature distribution pattern. For example, at the positive phase of AO in January 1993, it was only a shallow ridge on the Atlantic coast of southern Europe and Pacific coast of western North America, and the warming caused by the warm advection behind the ridge was mainly found in southern Europe and southern North America; at the negative phase of AO in January, 1977, the shallow ridge on the Atlantic coast of southern Europe and Pacific coast of western North America strengthened and advanced northward(see Fig. 1). The warming caused by the warm advection behind the ridge affected not only southern Europe and western North America, but also the Arctic regions(see Fig. 3), which was a principal element for the warming of the Arctic regions. The cold advection in front of the ridge guided the cold air in the Arctic region to advance southward, which deepened the East Asia major trough into the East Asia cold vortex, as well as the North America Great Lakes trough of low pressure into the Great Lakes cold vortex. It was these two deep cold vortexes which led to the abnormal cold at central latitudes of the Northern Hemisphere.
The above two points indicate that although the pressure field is determined by air temperature, when the situation of the pressure field changes, it will soon have an adverse effect on the distribution of the temperature field. Therefore, the temperature field inside the atmospheric system tends to be in an equilibrium state with rapid mutual adaptation. The equilibrium may be broken only after inputting external additional heat, after which a climate anomaly will be caused.
This paper investigates the influences of solar activity on AO from the two aspects of the changes in solar magnetic field intensity and the direction of the magnetic field.
3 PERIODICITY OF ANOMALOUS CHANGES OF AO AND ITS RELATION TO SOLARACTIVITY There is a significant 80~110-year century cycle and quasi-22-year cycle in the changes of solar magnetic field, intensity and direction of the magnetic field. Due to the fact that the changes of atmospheric temperature in the arctic regions are particularly sensitive to solar explosion, logically AO should have periodical changes with a scale similar to the solar activity. Is this the actual situation? Indeed it is. This section mainly expounds the periodicity of AO and its close relationship with solar activity.
3.1 Century Cycle of AO and Its Relationship with the Century Cycle of the Solar Magnetic Field The power spectrum analysis of the time series of the AO indexes from 1889 to 2013 has been completed, and a significance test(reliability α=0.05)has been conducted. The computational scheme is shown in Ref. Qu et al., (2003). As shown in Table 1(black columns), the power spectral density of the AO index in the second line is located at the first wave(the corresponding cycle of which is 110 a) and fourth wave(corresponding cycle of 22 a). These values are significantly greater than the red-noise testing spectral values in the third line, thus they pass the significance test(reliability α=0.05). This signifies that the 110-year-cycle corresponding to the first wave and 22-year-cycle corresponding to the f wave are both significant cycles of AO.
| Table 1 Power spectra and test spectra of AO indexes from 1889 to 2013 (reliability α=0.05) |
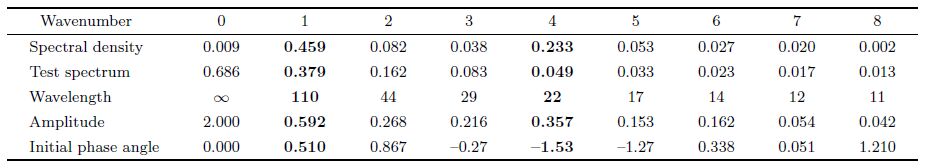
According to the fifth and the sixth lines in Table 1, when the 110-year periodic wave amplitude A is 0.592, the initial phase angle is 0.51 rad; then the equation for the 110-year periodic component C110(i)can be written as


Although spectral analysis reveals the 22 and 110-year cycles are significant periods in the arctic oscillation, what is the actual situation? Below the theoretical cycle curve and AO time sequence curve are drawn on the same picture and a compared for a test.
Comparison of the 9-year average curve(solid line) and the 110-year cycle component curve(heavy line) shows that their variation tendencies are basically same. In addition, their wave crests and wave troughs are also largely the same, indicating that the 110-year cycle has significant cyclical characteristics contained in the century changes of the AO indexes, and the 110-year cycle can be regarded as the variation tendency of AO during the period of 1900 to 2013.
To draw the 22-year a period also on the Fig. 4 needs to synthesize the 22-year period and 110-year period, namely:


|
Fig.4 AO index in January 9-year moving average curve and AO 110-year quasi-periodic component curve (heavy line) and AO 22-year cycle curve (dashed line) |
According to Eq.(4)the 22-year period is also drawn on Fig. 4(dashed line), which shows that its theoretical period is well in agreement with AO volatility, meaning it can correctly reflect the actual fluctuation characteristics of AO.
3.2 Century Cycle of AO and Its Relationshipwith the Century Cycle of the Solar Field To facilitate the analysis of the solar activity cycle and the arctic oscillation centuries period, we put the solar activity Wolff index 110-year cycle curve and AVO quasi-110-year period curve on a same picture (Fig. 5). It indicates that both have largely opposite peaks and troughs, and solar activity of 110-year cycle is in advance. It can be thought that the solar activity inspires the periodic change of the arctic oscillation.

|
Fig.5 AO 110 a quasi-periodic component curve (solid line) and solar activity 110 a cycle curve (dashed line) |
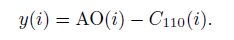
To reveal the effects of the solar activity on the interdecadal cyclical changes of AO, we first filter the century cycle from the sequence of the AO indexes. Fig. 5 AO 110 a quasi-periodic component curve (solid line) and solar activity 110 a cycle curve (dashed line) After subtracting the 110-year cycle from the sequence of original AO indexes AO(i), we obtain the sequence of AO indexes without century cycle y(i):
Then we obtain the variance of the sequence of original AO indexes:
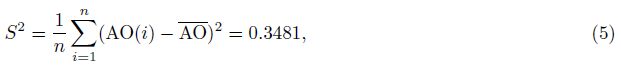

Therefore, the changes in the 110-year cycle are a very important feature of the changes in the AO index century, and the extent of their impact surpasses 44% of the abnormal changes of the total AO indexes.
Generally speaking, due to the fact that the range of the data used in this study is not sufficiently broad, it is not highly credible for analyzing the changes in the 110-year cycle of AO(i)using the data from the period of 1889 to 2013. However, from Fig. 4, the actual data of AO(i)are basically the same as the 110-year cycle curve, indicating that the 110-year cycle basically reflects the variation tendency of the AO(i)for a period of more than 100-year, thus we may regard the quasi-110-year cycle as the trend term of the sequence of AO(i) during the period of 1889 to 2013.
3.3 22-year Cycle of AO and Its Relation to the Solar Magnetic Field MIBased on Qu et al.(2014), the sun’s magnetic field of magnetic component index 22-year cycle C22, MI() is

In order to facilitate the analysis of the relationship between solar activity and the periodical changes of AO, we superimpose the 22-year periodic component curve of the AO(heavy solid line) and the MI curve of the solar magnetic field(solid line)in Fig. 6, then compare the two. We may see that their respective variation tendencies are basically contrary with each other, as evident in their wave crests and wave troughs. In addition, the wave crests and wave troughs of the solar magnetic field MI curve are ahead of the 22-year periodic component curve of AO, and the tropism of the wave crests and wave troughs of the two are relatively fixed, thus showing that there is a close inverse relationship between solar activities(especially the changes in MI of the solar magnetic field) and the changes in the 22-year cycle in January. After superimposing the quasi-22-year cycle curve of MI of solar magnetic field(dashed line)in Fig. 6, we may see that the quasi-22-year cycle curve of the MI is basically the same as the wave crests and wave troughs of the solar magnetic field MI curve, thus indicating that the quasi-22-year cycle of the solar magnetic field MI is an inherent oscillation cycle of the solar magnetic field.

|
Fig.6 The line of AO without century cycle and 22-year periodic component curve in January (heavy solid line) and quasi-22-year cycle curve of the MI of the solar magnetic field (dashed line) in January |
Qu et al.(2007)pointed out that when the solar magnetic field faces south, the solar magnetic field MI curve is located in the section from wave trough to wave crest. At this time, under the perturbation of the various wavelengths of the solar magnetic field, it is easy to maintain its southward component, thus the opportunities to reconnect with the magnetic field line of the Earth increase, in turn causing a large number of charged particles to enter the magnetosphere of the Earth and heat its atmosphere. From Fig. 6 we can see that the 22-year periodic component curve of AO in January(blue line)is from wave crest to wave trough when the solar magnetic field faces south, i.e. the mass ejection of the solar heats the Earth’s atmosphere in the Arctic region, then the atmosphere of the region becomes warm, corresponding to the negative phase period of AO.
On the contrary, when the solar magnetic field faces north, the MI curve of the solar magnetic field is from wave crest to wave trough. At this time, under the perturbation of the various wavelengths of the solar magnetic field, it is not easy to maintain its southward component, thus the opportunities to reconnect with the magnetic field line of the Earth decrease, in turn causing a large number of charged particles to slide over the periphery of the magnetosphere of the Earth, and its atmosphere cannot be heated. From Fig. 6 we see that the 22-year periodic component curve of AO in January(heavy solid line)is from wave trough to wave crest when the solar magnetic field faces north, i.e. solar mass ejection of slides over the Earth, thus the atmosphere in the polar region cannot be heated, and the atmosphere of the region remains cold corresponding to the positive phase period of AO.
4 CONCLUSIONSThis study is based on the comparative analysis of geopotential height, geopotential height anomaly and monthly temperature mean and anomalies of the Northern Hemisphere 1000 hPa during the positive and negative phases of AO(Arctic Oscillation). The results show that the abnormal warming period of the Arctic region corresponds to the negative phase of the AO, while the anomalous cold period of the Arctic region corresponds to the positive phase of the AO, thus indicating that the abnormal changes of the Arctic region determine the signs of the anomalies of the AO.
The analysis using the successive filtering method reveals that the AO phenomenon occurring in January shows clear a quasi-110-year century cycle and quasi-22-year decadal cycle which are closely related to solar activities. The specific expressions are as follows:
(1)The AO phenomenon occurring in January has a clear quasi-110-year century cycle which is closely related to solar activities. The variance contribution rate of the quasi-110-year century cycle for the AO indexes reached up to 44.4%, which is one of the most significant century change characteristics of AO phenomenon occurring in January.
(2)The spectral analysis shows that the AO indexes in January after filtering the changes in the 110-year century cycle have a significant 22-year cycle, and their variance contribution rate reached up to 18.5%, preceded only by the important characteristics of the interdecadal changes of the AO indexes after the quasi-110-year century cycle. The comparison shows that a close inverse relationship exists between solar activities(especially solar magnetic field index changes) and the changes in the 22-year cycle of the AO in January, and that the two trends are substantially opposite to each other. In other words, in most cases when the solar magnetic index MI rises from the lowest value, then the AO will drop from the highest value; and when solar magnetic index MI drops from the highest value, AO will rise from the lowest value.
In summary, the variance contribution rate of the changes in the quasi-110-year century cycle and quasi-22-year decadal cycle for the AO reach up to 62.9%, which indicates that solar activity is an important factor driving the AO.
5 ACKNOWLEDGMENTSThis work was supported by the National Science Foundation of China(41330960, 41376008).
| [1] | Friis-Christensen E, Lassen K. 1991. Length of the solar cycle:an indicator of solar activity closely associated with climate. Science, 254(5032):698-700. |
| [2] | Friis-Christensen E. 1993. Solar activity variations and global temperature. Energy., 18(12):1273-1284. |
| [3] | Dong S L. 1997. A cause of evolution of solar magnetic fieldSolar gyromagnetic effect. Acta Astrophysica Sinica (in Chinese), 17(1):86-90. |
| [4] | Gong D Y, Zhu J H, Wang S W. 2002. Significant correlation between the summer precipitation over Yangtze River and the former Arctic Oscillation. Chinese Bulletin of Science, 47:546. |
| [5] | Lean J, Beer J, Bradley R. 1995. Reconstruction of solar irradiance since 1610, implications for climate change. Geopgys. Res. Lett., 22(23):3195-3198. |
| [6] | Liu Y, Zhang H Q, Bao S D. 2001. A research on observation of solar magnetic field. Progress in Astronomy (in Chinese), 19(1):34-44. |
| [7] | Peristykh A N, Damon P E. 2003. Persistence of the Gleissberg 88-year solar cycle over the last-12000 years:Evidence from cosmogenic isotopes. J. Geophys. Res., 108(A1):1003, doi:10. 1029/2002JA009390. |
| [8] | Qu W Z, Deng S G, Huang F, et al. 2004. Influence of magnetic index abnormal change in the solar magnetic field on climate at the middle latitudes of North Hemisphere. Chinese J. Geophys. (in Chinese), 47(3):398-404. |
| [9] | Qu W Z, Wang L N, Liu Y C, et al. 2003. Research of stratospheric climate anomaly variation in Northern Hemisphere. Journal of Ocean University of Qingdao (in Chinese), 33(3):329-336. |
| [10] | Qu W Z, Zhao J P, Huang F, et al. 2012. Correlation between the 22-year solar magnetic cycle and the 22-year quasicycle in the earths atmospheric temperature. The Astronomical Journal, 144(1):6, doi:10. 1088/0004-6256/144/1/6. |
| [11] | Qu W Z, Huang F, Zhao J P, et al. 2005. Arctic oscillation and the antarcic oscillation modes in the atmospheric stratosphere. Acta Oceanologica Sinica, 24(6):46-53. |
| [12] | Qu W Z, Huang F, Zhao J P, et al. 2007. The significance of solar magnetic field direction variation on anomalous variability of the atmosphere temperature on the earth. Chinese J. Geophys. (in Chinese), 50(5):1304-1310. |
| [13] | Rigor I G, Colony R L, Martin S. 2000. Variations in surface air temperature observations in the Arctic. J Climate, 13(5):896-914. |
| [14] | Shi Z X, Wang J X. 1994. Deltasunspots and x class flares in solar cycle 22. Chinese Journal of Space Science (in Chinese), 14(1):1-7. |
| [15] | Thompson D W J, Wallace J M, Hegerl G C. 2000. Annular modes in the extratropical circulation. part ll:trends. Journal of Climate, 13(5):1018-1036. |
| [16] | Thompson D W, Wallace J M. 1998. The Arctic oscillation signature in the wintertime geopotential height and temperature fields. Geophys Res. Lett., 25(9):1297-1300. |
| [17] | Xiong G M, Chen Q L, Jiang Y, et al. 2012. Relationship between Arctic oscillation and planetary waves in winter. Journal of Chengdu University of Information Technology (in Chinese), 27(3):273-278. |
| [18] | Zhang D H, Xiao Z. 2000. The study of ionospheric TEC during the flare on Nov 22, 98 by means of 4 GPS receivers over China. Acta Scicentiarum Naturalum Universitis Pekinesis (in Chinese), 36(3):416-421. |
| [19] | Zhang Z D, Lin J, Chen J Y, et al. 1998. Researches on ideal MHD models of coronal mass ejections. Progress in Astronomy (in Chinese), 16(3):196-209. |