 2014, Vol. 57

 , WANG Hong-Cai1, 2
 , ZHAO Wei-Hua1, 2, JI Shao-Cheng3, SUN Dong-Sheng1, 2, LI A-Wei1, 2, LONG Chang-Xing1, 2
 2. Institute of Geomechanics, Chinese Academy of Geological Sciences, Beijing 100081, China;
3. Département des Génies Civil, Géologique et des Mines, Ecole Polytechnique de Montréal, Montréal, Québec, H3C3A7, Canada
Nowadays, due to limitation of scientific and technological development, our underst and ing of the deep earth relies mainly on the interpretation to geophysical data, especially on inversion of seismic data. A commonly employed approach is to compare the experimental seismic properties of samples with in-site measurement data(seismic reflection and refractory profiles)to infer mineral compositions and physical states of the crust and upper mantle(Zhang et al., 2008), meganappe(Yuan et al., 1994), crust extension and accretion(Wang et al., 2009), mantle wedge(Wei et al., 2010), and plate subduction(Ji et al., 2013). But the multiple explanations of inversion results cause some misunderst and ing of actual underground structure. Therefore, it is highly necessary to conduct laboratory research on rock seismic properties in order to provide reliable constraints and theoretical ground for both establishing inversion models of geophysical data and giving reasonable explanations to measurements.
Scientists have long conducted numerous experiment and theoretical studies on seismic velocities, anisotropy, S-wave splitting, VP and VS ratio, and energy attenuation of various kinds of rocks. For example, Jones et al.(1981)studied the anisotropy of ultrasonic waves in the Cretaceous shale of the Willison Basin under undrained conditions. Johnston et al.(1995)analyzed the mechanism triggering anisotropy of slate using X-ray and SEM techniques. Deng and Yang(2006)suggested that the anisotropy of VP and VS ratios exists extensively and is controlled by the lithology of rocks. Deng et al.(2004)studied the seismic anisotropy of shale under saturated conditions. Ji(2007)analyzed the seismic velocity hysteresis and shear wave splitting of the ultra-high pressure metamorphic rock samples from CCST(Chinese Continental Scientific Drilling). He also proposed a four-parameter model describing the relation between velocity and confining pressure and defined the physical implication of each parameter. Zhang et al.(2008)emphasized the deformation components triggering seismic anisotropy of ultra-high pressure eclogite. Kim et al.(2012)discussed the anisotropy of three parameters(Young’s module, P-wave velocity and coefficient of heat conductivity)of gneiss, schist and shale, and their interrelationships. Liu et al.(2008)compared experimental data with the corrected in-site P-wave velocity of exploration seismic profiles, determining the lithological properties of the crust in the northeastern margin of the Tibetan Plateau.
Yasuhiro(2012) studied the source process of one 2011 earthquake based on the morphology of seismic waves. However, most previous studies above were targeted at North America, western Europe, Japan and oceanic basins(Ji et al., 2007). Relatively, China’s experiment research on the seismic velocity of rocks just concentrates on high-grade metamorphic rocks(ecolgite and gneiss) and sedimentary rocks(mud shale, s and stone and carbonate rocks), with less concerns on low-grade metamorphic rocks.
Slate is a special low-grade metamorphic rock between mud shale and schist, and widely distributed in China. The fine-grained greenschist facies metamorphic rock derives from regional or low-temperature metamorphism and makes up one important rock type of the shallow crust. It occurs mainly in faulting and orogenic belts and is dominated by dynamic deformation. The northern margin of the Gaoligong Shan in Yunnan province experienced intensive tectonic activities, resulting in development of considerable faulting and folding. Its peculiar structural setting makes it an ideal place for studying continental deformation(Yun et al., 2013). Slate is widely exposed in this region and prone to hit by earthquakes. It is necessary to underst and the seismic properties of the shallow crust of this region. This study focused on the seismic research of the slate in this area and has obtained some basic data. Preliminary analysis and interpretation of these data can help determine the preferential orientation of microcracks in the upper crust and the anisotropy of the shallow crust.
2 EXPERIMENTS 2.1 Preparation and Characteristics of SamplesThe slate samples in this experiment were collected from the Bingzhongluo area of Yunnan Province(Fig. 1). This area lies in the Bangonghu-Nujiang fault zone, the southeastern margin of the Tibetan plateau with widespread exposure of the slate and peculiar structural setting. It has experienced intensive tectonic uplift. The samples we selected have no obvious fissures or veins and uniform in compositions, which can facilitate reliable seismic measurement. According to the experiment design, the cylindrical cores with a diameter of 24.5 mm(1 inch) and heights from 40 to 45 mm were cut from the slate samples in three structural directions, i.e. the Z direction perpendicular to foliation, the X direction parallel to the lineation and the Y direction perpendicular to lineation and parallel to foliation, and the directions of between X and Y at an interval of 15°(Fig. 2). The two ends of the cylindrical cores were polished with a parallel tolerance of ±0.02 mm.

|
Fig.1 Geological sketch of the study area(black dot marks the sampling location) |

|
Fig.2 Directional coring for samples |
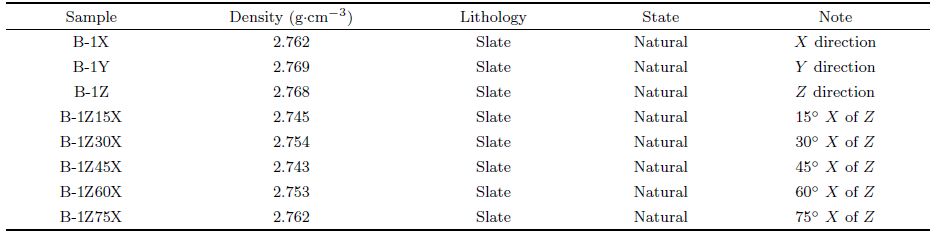
The samples selected were relatively compact in structure and low in porosity and permeability, and not required to dry or saturate. They were just kept at natural state after being dried naturally. Densities of the cores were determined using the weighting method and are listed in Table 1. Chemical compositions of the samples were tested using X-Ray Fluorescence Spectrometry at Guangzhou Institute of Geochemistry, Chinese Academy of Sciences. The results show that the samples have high contents of SiO2 and Al2O3. And the detailed whole-rock compositions of the samples are listed in Table 2.
| Table 1 Physical properties of samples |
| Table 2 Whole-rock chemical compositions(vol.%)of samples |

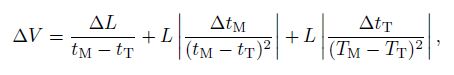
The experiment was preformed at the Institute of Geomechanics, Chinese Academy of Geological Sciences using Autolab 2000C made by the New Engl and Research Inc., USA. The pressure vessel of the testing system(Fig. 3)can keep confining pressure around 200 MPa in order to simulate the stress environment of the deep crust(Sun et al., 2012). The cores sealed with core holder were placed in the high-pressure vessel and isolated with the rubber boot from confining pressure medium, which could keep the measurement of the cores from influence of oil soaking. The seismic velocities of the cores were measured using ultrasonic pulse transmission technique. The testing apparatus Autolab 2000C not only measured the seismic velocities of measured rocks but also recorded P waves, slow S waves and fast S waves, with a receiving and transmitting frequency of 750 kHz. Data were acquired at an interval of 10 MPa when pressure was increased from 10 MPa to 200 MPa. Meanwhile, in order to analyze the seismic velocity hysteresis of rock, data were measured twice during pressurization from 10 to 200 MPa and then decompression from 200 to 10 MPa. According to relevant articles, the maximum system error using pulse transmission technique can be expressed as follows(Deng et al., 2006):

|
Fig.3 Schematic diagram of the test system |
During the experiment, the vessel temperature rose with continuous pressurization and oil temperature logged by sensors was 40°C at pressure of 200 MPa. Therefore, the influence of oil temperature could be eliminated. But r and om errors were derived mainly from acquisition for artificial initial waves. In combination with the seismic measurement for the cores, the actual accuracy was estimated 0.5%~1% for VP and ±1% for VS, respectively. The experiment apparatus at Dalhousie High Pressure Laboratory in Halifax of Canada yielded a maximum confining pressure up to 1.4 GPa by using one multiple level Air-Driven Hydraulic Pump, with oil as pressure transmission medium, transmitter and receptor frequency of 1 MHz. The accuracy of elastic velocity is estimated to be ±0.5%.
3 EXPERIMENT RESULTS 3.1 P-Wave Velocity(VP)There is a typical seismic hysteresis(Ji et al., 1993; 1994; Li et al., 2011; Zimmerman et al., 1986; Sun et al., 2012). During pressurization, the curve of velocity and confining pressure exhibits a rapid, nonlinear increase at the beginning and then a slow nearlinear increase with continuous pressurization. While during decompression, this curve shows a near-linear gradual decrease at the beginning followed by a fast non-linear decrease. At the same confining pressure, wave velocity measured during decompression is always higher than or equal to that measured in pressurization. Measurement values for each core(Fig. 4)show that the maximum value occurs in the X direction while the minimum value occurs in the Z direction. Therefore, VP measurement results suggest the seismic velocity of the rock is characterized by orthorhombic symmetry.

|
Fig.4 Relation between VP and directions of coring |
Preliminary analysis on the laboratory data shows the cores had a closure pressure of about 150 MPa. Because the maximum pressure(200 MPa)failed to promote closure of all microcracks in the cores, three cylindrical cores(B-1X, B-1Y and B-1Z)tested were sent to Dalhousie High Pressure Laboratory, Halifax of Canada, in order to obtain seismic velocities at confining pressures ranging from 0 to 600 MPa. The experiment results were fitted using the “four- parameter model of the relation between velocity and confining pressure” proposed by Ji et al.(2007), and the results are shown in Fig. 5b.

|
Fig.5 VP-P curves of depressurization for representative core samples from B-1(a)Measured in China;(b)Measured in Canada. |
The four-parameter model can be expressed by the equation:
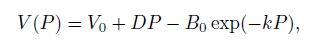
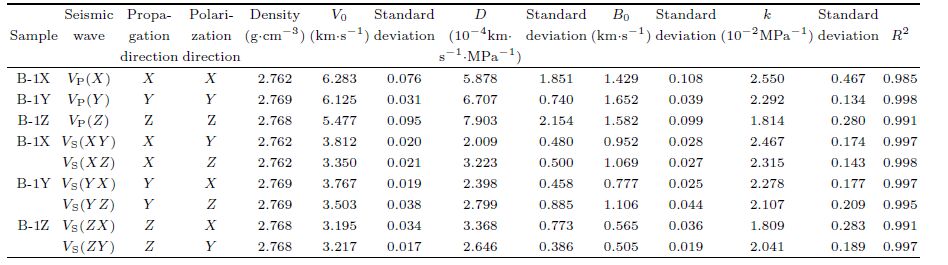
As such, with just four parameters given, the velocity at a specific confining pressure can be determined and conveniently cited by others for interpolation or extrapolation. The four-parameter velocity-pressure model in this study and its accuracy are given in Table 3.
| Table 3 Parameters of VP-P and VS-P curves measured for the slate sample during depressurization |
The anisotropy of P wave can be defined as
The relation between P-wave velocity anisotropy and confining pressure is shown in Fig. 6. Through calculation we can find that the maximum anisotropy can reach 32.12% and occurs at the low pressure stage. Anisotropy decreases gradually with pressurization. At pressure close to 150 MPa(about 6 km of burial depth), the anisotropy tends to be a stable value of 13%.

|
Fig.6 VP anisotropy of the slate as a function of pressure |
Laboratory measurement yielded S-wave velocities of the slate at pressures ranging from 10 to 600 MPa. Microscopic structure of the slate cores during decompression is in a more stable state. In the following we just discuss the seismic velocities obtained during decompression. The relation between S-wave velocities of the slate in three strain axes and confining pressures is shown in Fig. 7, in which the first initial represents S-wave propagation direction and the second represents S-wave polarization direction. For example, XY st and s for shear wave which has propagation direction parallel to extensional lineation(X) and polarization direction parallel to foliation but perpendicular to lineation. Obviously, S-wave velocity in the X and Y directions is almost same but distinctly higher than that in the Y direction(VS(XY)≈VS(Y X)> VS(Y Z)> VS(XZ)> Vs(ZX)≈VS(ZY)). When S-wave propagates in the Y direction, the velocities of fast and slow shear waves in the Z direction are largely the same.

|
Fig.7 VS-P curves and average VS-P curves for representative core samples from B-1 |
Anisotropy of S wave can be defined as

The first letter in the parentheses st and s for the propagation direction of S wave, and the second for the polarization direction of S wave. For example, VS(XY)represents the shear wave velocity which propagates in the direction parallel to extensional lineation(X) and has the polarization direction parallel to foliation but perpendicular to lineation. Calculation results(Fig. 8)indicate that the anisotropy(As)at the low pressure stage(< 50 MPa)decreases quickly with pressurization, then starts to increase at the medium pressure stage(50~75 MPa), and finally decreases with pressurization at the stage of pressures > 75 MPa.

|
Fig.8 Anisotropy of VS as a function of confining pressure for slate |
When shear waves pass through an anisotropic medium, either polarization direction is not consistent with anisotropic direction. One shear wave propagating along one direction will split into two polarized shear waves, both of which have different velocities and polarization directions. This phenomenon is termed shear wave splitting(Brich, 1960, 1961; Gardner et al., 1965). It can provide better constraints on inferring the compositions and crack development of the crust and the upper mantle(Christensen et al., 1971; Kern, 1993). The concept of S-wave splitting is easy to underst and , but its interpretation and application can easily go wrong because it has subtle differences with isotropic media.(Crampin et al., 2008). Laboratory testing yielded the velocities of fast and slow shear waves of the slate cores, and S-wave splitting data in three directions(X, Y and Z)were calculated. S-wave splitting in three directions can be respectively described as: △VS(X)= VS(XY)- VS(XZ), △VS(Y)= VS(Y X)- VS(Y Z) and △VS(Z)= VS(ZX)- VS(ZY)(Fig. 9). It is clear that S-wave splitting in X and Y directions decreases and then tends to stable with increasing pressure. Especially under low pressures(usually <150 MPa), S-wave splitting in all directions reflects the complicated interaction of preferential orientations between mineral crystal lattice and microcracks. When confining pressure is higher than 150 MPa, S-wave splitting is only caused by preferential orientation of mineral lattices within the rock. But at high pressures, the strongest S-wave splitting occurs in X and Y directions, with anisotropy values of 12% and 7%, respectively; the weakest S-wave splitting occurs in the Z direction, with an absolute value of 0.02 km/s, which can be negligible.

|
Fig.9 S wave splitting in X, Y and Z directions as a function of confining pressure(F is the ratio of absolute value of S-wave to mean velocity in this direction) |
To date, there has been little research home and abroad on the natures of seismic waves of low-grade metamorphic rocks such as slate, and thus there is less data published for such kind of study. The laboratory data of the slate seismic velocity, obtained in this study, are compared with the anisotropic data calculated based on the slate velocities by Salisbury(2005), Christensen(1965) and Godfrey et al.(2000). Contrast results are displayed in Fig. 10, in which the maximum confining pressure in this study is up to 600 MPa while the maximum value for contrast is 1.0 GPa. Comparison study suggests that the velocity range of slate is generally close to the experimental data in previous work, but characterized by significantly increasing of the velocity at low pressures(0~150 MPa). Preliminary analysis indicates that the slate used in this study contains microcracks, most of which tend to close slowly with pressurization. With continuous increase of the confining pressure to more than 150 MPa, anisotropic fluctuation tends to flat; at high pressures(>600 MPa), anisotropy tends to be more stable, and such a phenomenon is termed anisotropy of rock or mineral itself.

|
Fig.10 Anisotropic comparison Solid lines represent reference data, while the dashed line is the data of this research |
Laboratory study of the slate seismic velocity found that slate has one apparent anisotropic feature. Anisotropy of P wave at pressures lower than 150 MPa deceases quickly with elevated confining pressure, indicating most microcrack and pores have not been closed at this pressure. At pressures higher than 150 MPa, the anisotropy triggered by the orientation alignment of flaky minerals is the dominant factor for seismic anisotropy of slate; P-wave is stable in anisotropy and tends to decrease gradually with pressurization. Laboratory measurement at pressures ranging from 10 to 200 MPa shows that the VS splitting difference in the Z direction(for a specific pressure)during a circling of pressurization and depressurization is larger than that in the X and Y directions, indicating that most microcracks and pores of slate have long axes parallel to foliation and close quickly with pressurization. The anisotropy and splitting of slate S-wave decease gradually with pressurization, with the maximum splitting occurring in X and Y directions.
Previous studies show that the anisotropy of elastic wave propagation in rocks results mainly from the orientation alignment of thin interlayers and microcracks and preferential alignment of minerals. Microscopic observation of the thin section perpendicular to foliation demonstrates that elastically highly flaky minerals consist of biotite and actinolite, both of which show pronounced orientation alignment, with minor rigid quartz grains also presenting in flaky minerals(Fig. 11). Among boundaries of flaky minerals and boundaries between flaky minerals and quartz grains are microcracks nearly parallel to foliation, which tend to close gradually with pressurization, i.e. anisotropy occurring with pressurization results mainly from orientation alignment of minerals. But opposite directions of symmetrical axises of different minerals do not offset intrinsic anisotropy of minerals. Therefore, the final strength of anisotropy mostly depends on the mechanism of orientation alignment of different minerals. Anisotropy of slate at high pressures relies mainly on orientation alignment of biotite and actinolite.

|
Fig.11 Microphotographs of sample B-1(Qz: quartz, Bi: biotite, Act: actinolite)(single polarization) |
Parameters, such as Young’s modulus, shear modulus and Poisson’s ratio, will grow quickly with pressurization at pressures of < 10 to 150 MPa. In response to closure of microcracks of slate cores, these parameters become constants at confining pressures > 150 MPa. For example, E(Young’s modulus) and G(shear modulus)values perpendicular to foliation are 72.25 and 28.53 GPa, respectively. Fig. 12 shows how Young’s modulus and shear modulus vary with confining pressures. The magnitudes of the elastic modulus can reflect the intrinsic properties of rock-forming minerals and the strength of grain boundary under conditions of extension and compression along one axis, simple shearing or hydrostatic pressure. There is no difficulty to see that the values in the X and Y directions are quite close and apparently higher than that in the Y direction, no matter how we calculate mechanic parameters using either velocity measurement of slate or S-wave splitting. According to related studies(Li et al., 2006; Song, et al., 2004; Lekhnitskii, 1963; Bachman, 1983; Lo et al., 1986; Hao et al., 2006; Daley et al., 1977), we can conclude that slate can be regarded as one typical transverse isotropic(TI)medium and can be used to calculate seismic velocity based on relevant models or formula.

|
Fig.12 Shear modulus and Young modulus as a function of confining pressure |
Routinely, we employed the strain ellipsoid to fit 3D limited strain within deformed rocks. Is the 3D distribution of rock seismic velocities related to the strain ellipsoid? Based on the reference by Ji(2013), with velocity difference of P-wave in the X and Y directions(VP(X)- VP(Y))as X-axis, and velocity difference of P-wave in the Y and Z directions as Y -axis(VP(Y)- VP(Z)), this study plotted all the slate data from this study and previous studies(Fig. 13). If the points are close to Y -axis, the velocities of slate are almost same in the Y and Z directions, but higher in the X direction. If the points close to X-axis, velocities of slate are quite same in the X and Y directions but low in the Z direction. And if the points fall on the slope of 1, there is VP(X)- VP(Y)= VP(Y)- VP(Z).
The factors affecting the seismic velocity of rocks are multiple and very complicated. Generally they can be divided into two groups: microstructure and mineral composition. After closure of most microcracks at high pressures, the controlling factor that affects seismic velocity is minerals themselves. Because the control of a stress field can result in preferential orientation of minerals during formation of rocks, the anisotropy of minerals themselves will give rise to seismic velocity anisotropy of rocks. Previous research shows that rocks have “memory” of stress, that is, current physical properties of rock can reflect the stress path it underwent after the formation. Therefore, deviation of seismic velocity of slate at higher confining pressures can reflect its stress states(Fig. 13).

|
Fig.13 Flinn-type diagram showing P-wave velocities of slate at 600 MPa(modified from Ji et al. 2006)(a)Flinn-type diagram showing P-wave velocity anisotropy;(b)Pole diagrams showing three end-member types of contoured LPO patterns of slate c-axes. |
With selecting the propagation direction perpendicular to foliation plane(Z direction), time difference of fast and slow S-wave seismic velocities after S-wave splitting is very small. At the low confining pressure stage(< 100 MPa), anisotropy can reach 4%, but factors affecting the seismic velocity at the low pressure stage are complicated and make no sense. At the high pressure stage(> 100 MPa), anisotropy deviation is about 1%(Fig. 14). The difference of Vp seismic anisotropy in the X and Y directions at high pressures is < 2% due to closure of most microcracks and pores.

|
Fig.14 VS anisotropy in the direction perpendicular to the bedding as a function of pressures for slate |
Therefore, study of the seismic velocity of slate can help obtain true mechanic properties and stress state of slate, which will provide a new thinking approach to prediction of earthquake hazards and lithology determination in petroleum exploration.
5 CONCLUSIONSOur experiments reveal that slate has significant seismic anisotropy. In the natural state, the seismic velocities of the cores in all directions increase with pressurization, but anisotropy tends to decrease. Both P-waves and S-waves exhibit distinct hysteresis, i.e. there are two velocity values corresponding to one pressure, and the velocity value at depressurization is higher. Comparison study of the experimental data yields the following recognitions.
(1)At the low pressure stage, the orientation alignment of microcracks is the leading factor resulting in the strong anisotropy of samples; at the high pressure stage with most microcracks closed, the anisotropy of the samples derives mainly from the preferential orientation alignment of biotite and actinolite. Only at this moment can anisotropy truly reflect the nature of rock.
(2)The mechanism for seismic velocity hysteresis of slate is that because those closed mircrocracks and pores fail to open again completely(equivalent to increasing VP/VS ratio), and intensive deformation of soft clay minerals(biotite)can effectively enhance the contact among mineral grains.
(3)Slate is an approximately transverse isotropy material in nature. The mechanic properties of slate in the upper crust can be achieved through routine sampling and tests. Due to the difficulty to sample at depth, an approach “three-component seismic velocity” might be used to calculate its mechanic parameters, which are also characterized by transverse isotropy. Therefore, these data will provide important basis for monitoring earthquake hazards and tectonic activities.
ACKNOWLEDGMENTSThe project was funded jointly by the SinoProbe-Deep Exploration, Ministry of L and and Resources of China(SinoProbe-07) and Specific Funds for Public Warfare Scientific Research(201011071, 201011070) and the Basic Research Foundation of the Institute of Geomechanics, CAGS, China(DZLXJK201214). Our thanks go to research fellow Dr. Wang Lianjie with Institute of Mechanics, CAGS, for his advice. The authors are grateful to Dr. Matthew Salisbury and technical assistance of R. Iuliucci for their work at experiment, and the reviewers for their constructive suggestions.
| [1] | Brich F. 1960. The velocity of compressional waves in rocks to 10 kilobar:Part 1. J. Geophys. Res., 65(4):1083-1102. |
| [2] | Birch F. 1961. The velocity of compressional waves in rocks to 10 kilobars:Part2. J. Geophys. Res., 66(7):2199-2224. |
| [3] | Bachman R T. 1983. Elastic anisotropy in marine sedimentary rocks. Journal of Geophysical Research, 88(B1):539-545. |
| [4] | Chen Y, Zhang Z J, Sun C Q, et al. 2013. Crustal anisotropy from Moho converted Ps wave splitting analysis and geodynamic implications beneath the eastern margin of Tibet and surrounding regions. Gondwana Research, 24(3-4):946-957. |
| [5] | Christensen N I. 1965. Compressional wave velocities in metamorphic rocks at pressures to 10 kilobars. J. Geophys. Res., 70(24):6147-6164. |
| [6] | Christensen N I, Pamananantoandro R. 1971. Elastic moduli and anisotropy of dunite to 10 kilobars. J. Geophys. Res., 76(17):4003-4010. |
| [7] | Christensen N I. 1978. Ophiolites, seismic velocities, and oceanic crustal structure. Tectonophysics, 47:131-157. |
| [8] | Deng T, Yang L D. 2006.] Characteristics of velocity ratio of P-wave and S-wave for anisotropy rocks. Chinese Journal of Rock Mechanics and Engineering(in Chinese), 25(10):2023-2029. |
| [9] | Deng J X, Shi G, Liu R X, et al. 2004. Analysis of the velocity anisotropy and its affention factors in shale and mudstone.Chinese Journal of Geophysics(in Chinese), 47(5):862-868. |
| [10] | Daley P F, Hron F. 1977. Reflection and transmission coefficients for transversely isotropic media. Bulletin of the Seismological Society of America, 67:661-675. |
| [11] | Gardner G H F, Wyllie M R J, Droschak D H. 1965. Hysterisis in the velocity-pressure characteristics of rocks. Geophysics, 30(1):111-134. |
| [12] | Godfrey N J, Christensen N I, Okaya D A. 2000. Anisotropy of schists:contribution of crustal anisotropy to active source seismic experiments and shear wave splitting observations. J. Geophys. Res., 105(B12):27991-28007. |
| [13] | Kim H, Cho J W, Song I, et al. 2012. Anisotropy of elastic moduli, P-wave velocities, and thermal conductivities of Asan Gneiss, Boryeong Shale, and Yeoncheon Schist in Korea. Engineering Geology, 147-148:68-77. |
| [14] | Hao C T, Yao C, Wagn X. 2006. The characteristics of velocities with azimuth variation for arbitrary spatial orientation TI media. Progress in Geophysics(in Chinese), 21(2):524-530. |
| [15] | Jones L E A, Wang H F. 1981. Ultrasonic velocities in Cretaceous shales from the Williston basin. Geophysics, 46(3):288-297. |
| [16] | Johonston J E, Christensen N I. 1995. Seismic anisotropy of shales. J. Geophys. Res., 100(B4):5991-6003. |
| [17] | Ji S C, Wang Q, Marcotte D, et al. 2007. P-wave velocities, anisotropy and hysteresis in ultrahigh-pressure metamorphic rocks as a function of confining pressure. J. Geophys. Res., 112, B09204, doi:10.1029/2006JB004867. |
| [18] | Ji S C, Wang Q, Xia B. 2002. Handbook of Seismic Properties of Minerals, Rocks and Ores Seismic Properties. Polytechnic International Press, 630. |
| [19] | Ji S C, Salisbury M H. 1993. Shear-wave velocities, anisotropy and splitting in the high-grade mylonites. Tectonophysics, 221:453-473. |
| [20] | Ji S C, Zhao X O, Francis D. 1994. Calibration of shear-wave splitting in the subcontinental upper mantle beneath active orogenic belts using ultramafic xenoliths from the Canadian Cordillera and Alaska. Tectonophysics, 239:1-28. |
| [21] | Ji S C, Michibayashi Katsuyoshi, Shao T B, et al. 2013. Seismic velocities, anisotropy and petrofabrics of amphibolite from the Gaoligong Mts., Yunnan. Geological Review(in Chinese), 59(4):769-780. |
| [22] | Jung H. 2011. Seismic anisotropy produced by serpentine in mantle wedge. Earth Planet Sci. Lett., 307(3-4):535-543. |
| [23] | Kern H. 1993. P- and S-wave anisotropy and shear-wave splitting at pressure and temperature in possible mantle rocks and their relation to the rock fabric. Phys. Earth Planet Inter., 78(3-4):245-256. |
| [24] | Kern H, Lui B, Popp T. 1997. Relationship between anisotropy of P and S wave velocities and anisotropy of attenuation in serpentinite and amphibolites. J. Geophys. Res., 102(B2):3051-3065. |
| [25] | Liu M J, Li S L, Fang S M, et al. 2008. Study on crustal composition and geodynamics using seismic velocities in the northeastern margin of the Tibetan Plateau. Chinese J. Geophys.(in Chinese), 51(2):412-430. |
| [26] | Li Y H, Wu Q J, Zhang F X, et al. 2011. Seismic anisotropy of the Northeastern Tibetan plateau from shear wave splitting analysis. Earth Planet Sci. Lett., 304(1):147-157. |
| [27] | Li J Y, Chen X H. 2006. Study on seismic wave field unmerical simulation in transverse isotropic medium. Progress in Geophysics(in Chinese), 21(3):700-705. |
| [28] | Lekhnitskii S G. 1963. Theory of Elasticity of an Anisotropic Elastic Body. Holden-Day, San Francisco. |
| [29] | Lo T W, Coyner K B, Toksoz M N. 1986. Experimental determination of elastic anisotropy of berea sandstone, chiocopee shale, and chelmsford granite. Geophysics, 51(1):164-171. |
| [30] | Ji S C, Li A, Wang Q, et al. 2013. Seismic velocities, anisotropy, and shear-wave splitting of antigorite serpentinites and tectonic implications for subduction zones. J. Geophys. Res., 118(3):1015-1037. |
| [31] | Sun S S. 2011. Seismic velocities, anisotropy and elastic properties of crystalline rocks and implications for interpretation of seismic data.[Ph. D thesis]. Canada:école Polytechnique de Montréal, 210. |
| [32] | Sun S S, Ji S C, Wang Q, et al. 2012. Seismic velocities and anisotropy of core samples from the Chinese continental scientific drilling borehole in the Sulu UHP terrane, eastern China. J. Geophys. Res., 117, B01206. |
| [33] | Sun D S, Li A W, Wang H C, et al. 2012. Experiment on anisotropy of permeability with tight sandstone. Progress in Geophys.(in Chinese), 27(3):1101-1106. |
| [34] | Crampin S, Peacock S. 2008. A review of the current understanding of seismic shear-wave splitting in the Earths crust and common fallacies in interpretation. Wave Motion, 45(6):675-722. |
| [35] | Ji S C, Li A, Wang Q, et al. 2013. Seismic velocities, anisotropy, and shear-wave splitting of antigorite serpentinites and tectonic implications for subduction zones. J. Geophys. Res., 118(3):1015-1037. |
| [36] | Song I, Such M, Woo Y K, et al. 2004. Determination of the elastic modulus set of foliated rocks from ultrasonic velocity measurements. Engineering Geology, 72(3-4):293-308. |
| [37] | Wang Q, Ji S C, Xu Z Q. 2009. VP/VS anisotropy and implications for crustal composition identification and earthquake prediction. Acta Geologica Sinica, 83(4):801-815. |
| [38] | Wang Q, Ji S C, Sun S S, et al. 2011. Elastic and seismic properties of the Dabie-Sulu ultrahigh pressure metamorphic rocks. Acta Geologica Sinica, 86(1):20-37. |
| [39] | Wei W, Zhao D P, Shi Y L. 2010. Three-dimensional P-wave tomography of the volcanic areas in southwest Japan. Earth Science Frontiers(in Chinese), 17(3):149-157. |
| [40] | Yuan X C, Xu M C, Tang W B, et al. 1994. Eastern qinling seismic reflection profiling. Acta Geologica Sinica(in Chinese), 37(6):749-758. |
| [41] | Zhang Z J, Zhang X, Badal J. 2008. Composition of the crust beneath southeastern China derived from an integrated geophysical data set. Journal of Geophysical Research-Solid Earth, 113(B04417), doi:10.1029/2006JB004503. |
| [42] | Zimmerman R W, Somerton W H, King M S. 1986. Compressibility of porous rocks. J. Geophys. Res., 91(B12):12,765-12, 277. |
| [43] | Zhang Z J. 2002. A reviews of the seismic anisotropy and its applications. Progress in Geophys.(in Chinese), 17(2):281-293. |