 2013, Vol. 56


2. Geological Survey of Japan, AIST, Tsukuba 305-8567, Japan;
3. Yunnan Observatory, Chinese Academy of Sciences, Kunming 650011, China
It has been widely reported that occurrences of earthquakes are affected by tidal forces[1, 2, 3, 4, 5, 6, 7, 8, 9, 10, 11, 12, 13, 14, 15, 16, 17]. To examine the correlation between earthquakes and tidal forces,the popular method is to statistically count the selectivity of earthquakes occurrence time on some tidal phases,i.e.,on the basis of calculated time-varying curves of lunarsolar tidal forces,numbers of earthquakes in different time spans of tidal phase are statistically counted. If the number of earthquakes around a tidal phase is larger than others,it is thought that there is a dominant tidal phase. Therefore,the occurrences of earthquakes may be affected by tidal force triggering,namely there is a tidal correlation. If most of earthquakes occur randomly,there is an opposite conclusion. Most studies[18, 19, 20, 21, 22, 23, 24, 25, 26, 27, 28, 29] indicate that there is a certain degree of correlation between earthquakes and tides when the occurrences of earthquakes in some regions relatively cluster around some tidal phase,but this correlation is weak. In China there have been some studies about tidal force and earthquakes,as well as earthquake prediction testing. For example,the Load/Unload Response Ratio theory[30] and the weighted Load/Unload Response Ratio method[31, 32] have taken the short-period semidiurnal tide modulation on earthquakes into account. Some research used the wavelet transform method to analyze the 0.1-year accumulative Benioff strain caused by earthquakes in Chinese mainland and North China from 1900 to 2001,and obtained multi-scale seismically active and quiet periods[33]. The phenomena of active and quiet periods appearing by turns may contain factors associated with solid tide periods except for tectonic stress.
Most previous studies have common features as follows: ① Study regions are generally local areas with major earthquakes in the past. ② Time spans of studies are several months or years before and after great earthquakes. ③ Most seismic events are foreshock or aftershock series of great earthquakes. ④ Time-varying curves of tidal force are calculated just for short-period tidal waves. Some problems have not been solved in this kind of statistical study,e.g.,the controversial problems about tidal periods related to earthquake triggering,as well as dominant phases of tidal triggering[34, 35, 36, 37]. For the reason that it is difficult to examine the tidal phase selectivity on the basis of calculating long-period tidal force for an extensive region and a long time span (tens or hundreds of years),the studies on the correlations between earthquakes and tides have been limited for a long time by short-periodic tides and local regions.
Tidal forces contain complex periodic components and have a feature of acting repeatedly. It may be the periodic oscillation property rather than completely the strength amplitude of tidal force that plays a more significant role in earthquake tidal triggering[10, 22]. In this study,we try a different standpoint and method to avoid above mentioned limitations. Using the USGS global seismic catalog with relative more complete and longer records,we firstly build the time series of global seismic energy release. In order to extract possible quasi tidal periodicities existing in seismic energy-time series,we apply the wavelet transform method to the seismic energy-time series analysis. Our purpose is to investigate the correlation between the global seismic energy release and the tidal periods as well as related physical mechanism.
2 SEISMIC DATA 2.1 Seismic CatalogThe seismic data used in this study is from USGS website global earthquake catalog from 1 Jan. 1850 to 5 May 2012. As shown in Fig.1,we take seismic events with magnitudes larger than or equal to 5.0,which amount to 64441.

|
Fig.1 Epicenters of M ≥ 5.0 earthquake in the world during the period from 1850 to 2012 Red dots indicate earthquakes of M ≥ 7.0, and black dots show earthquakes of 5.0 ≤ M < 7.0. |
Setting a time series of global seismic energy will facilitate wavelet transform. Firstly,we use the relation of Gutenberg energy versus magnitude[38] to transform the seismic magnitude into seismic energy for each event in the catalog.


|
Fig.2 Time series of global M ≥ 5.0 seismic energy |
When we set the length of time window for the time series,following factors are considered. If seismic activities are affected by tide forces of different periods,the seismic energy release may show the related quasi periodicity. Therefore,to reasonably analyze the possible quasi-periodicity in the time series of seismic energy,the length of time window is set to be 1 year for the long periodicity ranging from several years to tens years. Otherwise,the length of time window is set to be one day for the short periodicity ranging from several days to more than ten days.
3 METHODOLOGY OF WAVELET TRANSFORMIn the present study,the wavelet transform is applied to the time series of global seismic energy to do periodical analysis. The time series of global seismic energy is a nonlinear and non-stationary signal,and the wavelet transform is an effective tool to analyze this kind of time series. The wavelet transform breaks up a signal into scaled versions of a series of wavelet functions,which are created by a function (mother wavelet) expanding,contracting and shifting. Compared with the traditional Fourier transform,the wavelet transform has a feature of multi-scale analysis,which can express a time series in flexible space: time and frequency. Localization both in time and frequency can be achieved with the wavelet transform by transforming the data within a varying window of time and shifting this window along the time series[39].
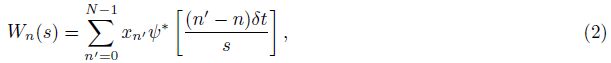
The wavelet transform of a discrete time series xn is defined as:
The wavelet function Ψ (t) is a waveform that has a zero mean and can be localized in both time and frequency space. Here,we use the Morlet wavelet:

To extract the possible quasi periods associated with tides in global seismic energy series,we apply the wavelet transform method to the seismic energy-time series. The maps of wavelet transform as well as the maps of corresponding quasi-periodic analysis are obtained. Fig.3 shows the results of wavelet transform and corresponding quasi-periodic analyses for 1-year time window series of earthquakes with different cutoff magnitudes. Fig.4 displays the result of wavelet transform and corresponding quasi-periodic analyses for 1-day time window seismic energy series.

|
Fig.3 (a, b) Diagrams of wavelet transform and corresponding quasi-periodic analyses for the time series of global M ≥ 5.0 seismic energy from 1850 to 2012; (c, d) Diagrams of wavelet transform and corresponding quasi-periodic analyses for the time series of global M ≥ 7.0 seismic energy from 1850 to 2012 |

|
Fig.4 Diagrams of wavelet transform for the time series of global M ≥ 5.0 seismic energy during 10000 days since Jan 1, 1973 |
Taking Fig.3 as an example,we explain the maps of wavelet transform and corresponding quasi-periodic analyses.
Figure3a gives the contour map showing the real part of wavelet transform coefficient for the seismic energy,which is also called as the map of wavelet transform. The left axis is period,and the bottom axis is time in Fig.3a. Different colors in the contour map reveal the strength of wavelet spectrum signal,which also indicates the strength of seismic energy. Red block indicates the peak value,and blue block represents the valley value. The focus position of every block shows both the strength center of wavelet power spectrum and its corresponding period and time for the seismic energy. Appearance in turn of the red and blue block reveals the periodic change of the wavelet spectrum signal.
Figure3b shows curves of real part of wavelet transform coefficient varying with time,which is extracted from quasi-periodic analysis corresponding to the focus position of wavelet power spectrum as shown in Fig.3a. For example,the upper curve in Fig.3b corresponds to the quasi-periodic component with the values between 7.0 and 10.7 in Fig.3a,which is estimated to be 9.05 year from the mean value of a series of focus centers. The middle curve in Fig.3b corresponds to the quasi-periodic component with the values between 16.5 and 25.5 in Fig.3a,which is estimated to be 18.72 years. The bottom curve in Fig.3b corresponds to the quasi-periodic component with the values between 39.3 and 60.6 in Fig.3a,which is 45.13 years. Using the time-varying real part of wavelet transform corresponding to the quasi-periodic components,we can get the curves of wavelet coefficient varying with time,which is called the map of quasi-periodic analyses.
4.1 Results of Long Periods Within Energy Series of Earthquakes with Different Cutoff Magni-tudesWhen we examine the long-periodic feature,a longer series of seismic energy is needed to extract the long periods. We choose the seismic catalog from 1 January 1850 to 5 May 2012 to form a time series of seismic energy. The whole catalog is divided into two sub series of seismic energy with earthquakes of M ≥5.0 and M ≥ 7.0,respectively. Figs. 3a,3b and Figs. 3c,3d show the results of wavelet transform and corresponding quasi-periodic analyses for the seismic energy series with earthquakes of M ≥ 5.0 and M ≥ 7.0,respectively.
4.2 Results of Short-Periodic Component of Seismic Energy SeriesWhen we focus on the short-periodic feature,the time span of seismic energy series is not required to be very long. So we choose seismic catalog since 1973 (when world wide digital seismograph record began) and set the length of time window to be 1 day to form time series of seismic energy. Fig.4 shows the results of wavelet transform for M ≥ 5.0 seismic energy series since 1 January 1973 with the time span of the series 10000 days (about 30 years). As shown in Fig.4,there is no focus block corresponding to a short period (such as 14 days). However,some ambiguous focus blocks appear in the map,which correspond to a quasi long period of 3200 days (about 9 years). Comparison of Fig.3 and Fig.4 indicates that the long-periodic components of seismic energy series are clearer by using the time window of one year than the time window of one day. It is helpful using time window of one day to extract shorter-periodic component.
5 DISCUSSION AND CONCLUSIONS 5.1 Three Quasi Periods Related to Long-Period Tides in Global Seismic Energy ReleaseFrom Fig.3,we find similar features in the diagrams of wavelet transform and corresponding quasi-periodic analyses for M ≥ 5.0 and M ≥ 7.0 global seismic energy series. Both results for M ≥ 5.0 and M ≥ 7.0 global seismicity show three quasi-periodic components,i.e. 9-year,19-year and 45-year periods. It is worth noting that the 45-year quasi-periodic component is most obvious. We calculate the curve of solid tidal stress (shown in Fig.5a),which obviously displays an 18.6-year period embedded with the 8.85-year period,4.43-year period and other shorter periods. Fig.5b shows the comparison of the curve of solid tidal stress and seismic energy series,which indicates the correlation between the seismic episode fluctuation and some periods of solid tidal stress.

|
Fig.5 (a) Curve of solid tidal stress varying with time; (b) Diagram of solid tidal stress and seismic energy series (Day is used to be the statistical unit) Amplitudes of four huge seismic-energy bars around year of 2005, 2010 and 2011 exceed the scale range in Fig. (b), and reach 1025J. In order to show a clearer diagram of the most shorter seismic-energy bars, the amplitudes of the four huge seismic-energy bars are cut off and limited in the range of 1024J. |
The tidal mechanisms related to the phenomenoa of above three quasi periods are discussed as follows.
9-year quasi period The possible mechanism of the 9-year quasi-periodic phenomena is result of the influence on tidal force imposed by the 8.85-year period of lunar perigee east-drifting. Since the direction of elliptical orbital plane is not fixed in moon motion,this kind of orbital precession makes the connecting line between the perigee and the apogee continuously move eastward,a circle of this motion is 8.85 years,which is called the east-drifting period of lunar perigee. The major effect of the 8.85-year east-drifting period of lunar perigee is that the Sun and the lunar apsides are in a straight line every 8.85 years,and the Moon is passing the perigee. The tidal force in a few years around this time is much bigger than in others[41],and the value can reach 6.8 kPa.
19-year quasi period The 19-year quasiperiodic phenomenon may be the result of the influence on tidal force imposed by 18.6-year west-drifting period of the lunar orbital ascending node. Since the angle between the lunar orbit i.e. moon’s path and solar orbit i.e. ecliptic is 5°9',and that the angle between ecliptic plane and equatorial plane is 23°27'. There are two points of intersection of the moon’s path and the ecliptic,one point is called as ascending node when the Moon is passing the ecliptic from the south to the north. The lunar orbital plane makes backward precession with the ascending node drifting westward due to the perturbation of solar gravity. Such movement is called westward regression of lunar ascending node. Lunar declination could reach the maximum 23°27'+5°9'=28°36' and the minimum 23°27' - 5°9' = 18°18' when the mean longitude of lunar ascending node equal to 0° and 180°,respectively. The cycle of westward regression of ascending node is 18.61 years[41, 42],and the tidal force related to 18.6-cycle can reach 7.3 kPa. The 19-year quasi period in time series of global seismic energy just reflects the great influence on tidal forces by the periodical variance of lunar declination.
45-year quasi period The 45-year quasi-periodic component is especially prominent relative to the other quasi-periodic components. However,there isn’t yet a tidal period related to lunar or solar orbital motion which can explain this 45-year quasi-periodic component. Here we try to explore the mechanism for the 45-year quasi-periodic phenomenon in the seismic energy release. We assume there is a combination of tidal periods,e.g.,the time periods of 8.85-year or the combined periods of 18.6-year and 8.85-year. Tidal forces with the combined periods are likely to satisfy the earthquake-preparation time scale for most seismic faults in the world,that make the 45-year quasi-periodic phenomenon especially prominent in the global seismic energy release.
Comparing the Fig.3b with Fig.3d,we find that the both diagrams of quasi-periodic analyses for seismic energy series with earthquakes of M ≥ 5.0 and M ≥ 7.0 are similar,but have a little difference in the phase of time-varying curves of wavelet coefficient. The phase of time-varying wavelet coefficient of the M ≥ 5.0 seismic energy series lags behind that of the M ≥ 7.0 seismic energy series,which may be attributed to the large numbers of M5.0 ~ 6.0 earthquakes,many of which may be aftershocks of major earthquakes in the M ≥ 5.0 seismic energy series.
5.2 No Quasi Periods Related to Short Periodic Tides in the Global Seismic Energy ReleaseThe diagram of wavelet transform for seismic energy series with 1-day time window (Fig.4),unexpectedly,does not display any quasi-periodic component related to short-periodic tides,such as the 14-day quasi period related to spring tide or fortnight tide. This phenomenon is attributed to the cycle of short-periodic tidal force is far less than the time scale for M ≥ 5.0 earthquake preparation on seismic faults.
Quasi periodicity related to spring tide is not found in global seismic energy release,which seems to be inconsistent with people’s knowledge that spring tidal force may trigger earthquakes. In fact,that no quasi period of spring tide is found in seismic energy release can not indicate that spring tidal force has no effect on earthquakes. The effect of spring tidal force is actually hidden in the influence of long-periodic tidal force,and it may be through the modulation to the short-periodic tide that the long-periodic tides realize its effect. For example,the modulation of the 18.6-year cycle of ascending node west-drift makes the amplitude of spring tide in some time span become larger than usual,thereby,realizing the effect on seismic activities. On the other hand,the short-periodic tide may affect the earthquake through the modulation from the long-periodic tide. For regional foreshock or aftershock series,the influence of short-periodic tide may be increased. We take two aftershock series in Yunnan province as examples,including the aftershock series of 2011 Yingjiang M5.9 and 2012 Yiliang M5.7 earthquakes. We apply wavelet transform to the series and make quasi-periodic extracting. An obvious 14-day quasi period is extracted from the Yingjiang aftershock series (Fig.6),but no such quasi period is extracted from the Yiliang aftershock series (Fig.7).

|
Fig.6 Aftershock (M ≥ 1.0, during 150 days) series of 2011 Yingjiang M5.9 earthquake (a) Diagram of wavelet transform; (b) Diagram of quasi-periodic analyses; (c) Map of the time series of seismic energy; (d) M-t plot. |

|
Fig.7 Aftershock (M ≥ 1.0, during 96 days) series of 2012 Yiliang M5.7 earthquake (a) Diagram of wavelet transform; (b) M-t diagram; (c) Diagram of the time series of seismic energy. |
The above two examples indicate that the short-periodic tide may affect regional seismic series once some conditions are satisfied,and that the so-called conditions should contain factors of both tidal force and earthquake faults. Further studies on short-periodic tide and regional seismic series need a lot of earthquake cases.
5.3 ConclusionsThe time series of global seismic energy release contains three quasi-periodicity components of 9-year,19-year and 45-year,and the 45-year quasi periodicity is most prominent. The tidal effect by the 8.85-year cycle of lunar perigee east-drift and the 18.6-year cycle of lunar ascending node west-drift is the possible reason for these phenomena.
The 45-year quasi periodicity in seismic energy release may be related to some kind of combined tidal periods,e.g.,the times periods of 8.85-year or the combined periods of 18.6-year and 8.85-year. Tidal forces with the combined periods are likely to satisfy the earthquake-prepare time scale for most seismic faults in the world,that make the 45-year quasi-periodic phenomenon especially prominent in the global seismic energy release. The mechanism for 45-year quasi periodicity in seismic energy release needs further studies.
No quasi-periodic component related to shortperiodic tide is found in the global seismic energy release. We infer that the reason that the cycle of short-period tidal force is far less than the time scale for earthquake preparation on seismic faults. The short-periodic tides may affect earthquakes through the modulation from the long-periodic tides. For regional seismic energy series the effect of short-periodic tides may be increased,but for global seismic energy series the regional effect of short-periodic tides may be covered up.
In a word,to what extent the tide poses effect on earthquake occurrence is not only related to the strength of tidal force,but also related to the periodicity of tidal force.
6 ACKNOWLEDGMENTSThis work is supported by National Natural Science Foundation of China (41074044) and (41104036). We thank Yin Jiyao. for his help. We are grateful to the associate editor,and two anonymous reviewers for providing comments that significantly improved the manuscript.
| [1] Heaton T H. Tidal triggering of earthquakes. Geophys. J. Int., 1975, 43(2): 307-326. |
| [2] Ding Z Y, Jia J K, Wang R. Seismic triggering effect of tidal stress. Tectonophysics, 1983, 93(2): 319-335. |
| [3] Palumbo A. Lunar and solar tidal components in the occurrence of earthquakes in Italy. Geophys. J. Int., 1986, 84(1): 93-99. |
| [4] Tsuruoka H, Ohtake M, Sato H. Statistical test of the tidal triggering of earthquakes: Contribution of the ocean tide loading effect. Geophys. J. Int., 1995, 122(1): 183-194. |
| [5] Kasahara J. Tides, earthquakes, and volcanoes. Science, 2002, 297(5580): 348-349. |
| [6] Tanaka S, Ohtake M, Sato H. Evidence for tidal triggering of earthquakes as revealed from statistical analysis of global data. J. Geophys. Res., 2002, 107(B10): ESE 1-1-ESE 1-11, doi: 10.1029/2001JB001577. |
| [7] Zhao J, Han Y B, Li Z A. Relationship between the variation of lunisolar tidal force and earthquakes in Taiwan. J. Natural Disasters, 2001, 10(3): 64-67. |
| [8] Zhang J, Xi Q W, Yang L Z, et al. A Study on tidal force/stress triggering of strong earthquakes. Chinese J. Geophys. (in Chinese), 2007, 50(2): 448-454. |
| [9] Feng X D, Wei D P. Statistical analysis of the spatial and temporal correlation between seismicity and tide-generating force by the Sun and the Moon. Recent Developments in World Seismology (in Chinese), 2007, 341(5): 9-15. |
| [10] Du P R, Zhao J M, Gao X L. The 18.6-year periodicity of great earthquakes. Chinese J. Geophys. (in Chinese), 2011, 54(9): 2256-2262. |
| [11] Yang X X, Han Y B, Chen Z, et al. New evidence of earthquake and volcano triggering by strong tides. Chinese J. Geophys. (in Chinese), 2004, 47(4): 616-621. |
| [12] Han Y B, Li Z A, Tian J. The researching of the relation of occurence time of earthquakes and the solar-lunar tidal force in some areas of China. Progress in Geophys. (in Chinese), 1996, 11(2): 114-122. |
| [13] Zhao J, Han Y B, Li Z A. Variation of lunisolar tidal force and the earthquakes in north China. Chinese J. Geophys. (in Chinese), 1999, 42(S1): 24-29. |
| [14] Wu X P, Mao W, Huang Y, et al. Tidal stress triggering effects of earthquakes based on various tectonic regions in China and related astronomical characteristics. Science in China Series G, 2009, 52(8): 1271-1283. |
| [15] Wu X P, Huang Y, Mao W, et al. Tidal stress triggering mechanism of earthquakes in Yun'nan and related patterns of celestial body positions. Chinese J. Geophys. (in Chinese), 2005, 48(3): 574-583. |
| [16] Xu Y J, Wu X P, Yan C H, et al. The features of tidal Coulomb failure stresses on various kinds of seismic fault. Chinese J. Geophys. (in Chinese), 2011, 54(3): 756-763. |
| [17] Li J, Jiang H K. A review on tidal triggering of earthquakes. Earthquake Research in China, 2012, 26(1): 128-141. |
| [18] Wilcock W S D. Tidal triggering of earthquakes in the Northeast Pacific Ocean. Geophys. J. Int., 2009, 179(2): 1055-1070. |
| [19] Tanaka S. Tidal triggering of earthquakes precursory to the recent Sumatra megathrust earthquakes of 26 December 2004(Mw 9.0), 28 March 2005(Mw 8.6), and 12 September 2007(Mw8.5). Geophys. Res. Lett., 2010, 37(2), L02301, doi: 10.1029/2009GL041581. |
| [20] Métivier L, de Viron O, Conrad C P, et al. Evidence of earthquake triggering by the solid earth tides. Earth and Planetary Science Letters, 2009, 278(3-4): 370-375. |
| [21] Stroup D F, Tolstoy M, Crone T J, et al. Systematic along-axis tidal triggering of microearthquakes observed at 9°500'N East Pacific Rise. Geophys. Res. Lett., 2009, 36: L18302, doi: 10.1029/2009GL039493. |
| [22] Stroup D F, Bohnenstiehl D R, Tolstoy M, et al. Pulse of the seafloor: Tidal triggering of microearthquakes at 9°500'N East Pacific Rise. Geophys. Res. Lett., 2007, 34: L15301, doi: 10.1029/2007GL030088. |
| [23] Cadicheanu N, van Ruymbeke M V, Zhu P. Tidal triggering evidence of intermediate depth earthquakes in the Vrancea zone (Romania). Natural Hazards and Earth System Science, 2007, 7(6): 733-740. |
| [24] Tanaka S, Sato H, Matsumura S, et al. Tidal triggering of earthquakes in the subducting Philippine Sea plate beneath the locked zone of the plate interface in the Tokai region, Japan. Tectonophysics, 2006, 417(1-2): 69-80. |
| [25] Tanaka S, Ohtake M, Sato H. Tidal triggering of earthquakes in Japan related to the regional tectonic stress. Earth Planets Space, 2004, 56(5): 511-515. |
| [26] Cochran E S, Vidale J E, Tanaka S. Earth tides can trigger shallow thrust fault earthquakes. Science, 2004, 306(5699): 1164-1166. |
| [27] Tanaka S, Ohtake M, Sato H. Spatio-temporal variation of the tidal triggering effect on earthquake occurrence associated with the 1982 South Tonga earthquake of Mw 7.5. Geophys. Res. Lett., 2002, 29(16), doi: 10.1029/2002GL015386. |
| [28] Wilcock W S D. Tidal triggering of microearthquakes on the Juan de Fuca Ridge. Geophys. Res. Lett., 2001, 28(20): 3999-4002. |
| [29] Tolstoy M, Vernon F L, Orcutt J A, et al. Breathing of the seafloor: Tidal correlations of seismicity at Axial volcano. Geology, 2002, 30(6): 503-506. |
| [30] Yin X C, Yin C. The precursor of instability for nonlinear systems and its application to earthquake prediction-The load-unload response ratio theory. Science in China Series B (in Chinese), 1991, 21(5): 512-518. |
| [31] Wan Y G. The weighted load/unload response ratio and its case verification. Inland Earthquake (in Chinese), 2008, 22(2): 97-103. |
| [32] Wan Y G. Some considerations on theory of load and unload response ratio and its application in earthquake prediction. Northwestern Seismological Journal (in Chinese), 2004, 26(2): 178-182. |
| [33] Wan Y G, Qi F R, Meng X C, et al. Wavelet analysis of seismic data in Chinese mainland and north China. Journal of Geodesy and Geodynamics (in Chinese), 2003, 23(4): 28-33. |
| [34] Crockett R G M, Gillmore G K, Phillips P S, et al. Tidal synchronicity of the 26 December 2004 Sumatran earthquake and its aftershocks. Geophys. Res. Lett., 2006, 33(19), doi: 10.1029/2006GL027074. |
| [35] Cochran E S, Vidale J E. Comment on "Tidal synchronicity of the 26 December 2004 Sumatran earthquake and its aftershocks" by R. G. M. Crockett et al. Geophys. Res. Lett., 2007, 34(3), doi: 10.1029/2006GL028639. |
| [36] Crockett R G M, Gillmore G K, Phillips P S, et al. Reply to comment by Elizabeth S. Cochran and John E. Vidale on "Tidal synchronicity of the 26 December 2004 Sumatran earthquake and its aftershocks". Geophys. Res. Lett., 2007, 34(4), doi: 10.1029/2006GL028925. |
| [37] Stein R S. Tidal triggering caught in the act. Science, 2004, 305(5688): 1248-1249. |
| [38] Fu S F, Liu B C. An Introduction to Seismology (in Chinese). Beijing: Seismological Press, 1991. |
| [39] Daubechies I. The wavelet transform, time-frequency localization and signal analysis. IEEE Trans. Inf. Theory, 1990, 36(5): 961-1005. |
| [40] Torrence C, Compo G P. A practical guide to wavelet analysis. Bulletin of the American Meteorological Society, 1998, 79(1): 61-78. |
| [41] Haigh I, Eliot M, Pattiaratchi C. Global influences of the 18.61 year nodal cycle and 8.85 year cycle of lunar perigee on high tidal levels. J. Geophys. Res., 2011, 116, C06025, 16 PP., doi:10.1029/2010JC006645. |
| [42] Cùrrie R G. Luni-solar 18.6-year signal in tree-rings from Argentina and Chile. Pure and Applied Geophysics, 1991, 137(3): 281-300. |