 2013, Vol. 56


2. Technology Research Center, China Petroleum Logging CO. LTD., Xi'an 710077, China;
3. State Key Lab of Oil and Gas Reservoir Geology and Exploitation(Southwest Petroleum University), Chengdu 610500, China;
4. Beihang University, Institute of Instrumental Science and Opto-Electronics Engineering, Beijing 100191, China
The classic Archie equations[1] built a standard approach for log interpretation,which turned the estimation of water saturation into quantitative calculation. The equations also set up a fundamental standard program in most petrophysical software systems for computer processing interpretation (CPI) based on well-log or LWD data. For a relatively simple reservoir,the Archie equations can faultlessly describe the relationships among reservoir properties,rock-electrical characters and water saturation. However,with the increasing complexity of oil and gas exploration and development,for example,the complexity of pore structures,increasing shale content and other factors,all the factors will affect or restrict the accuracy of Archie equations in water saturation estimation. In order to remove these limitations to use Archie formula in complex formations,Waxman-Smits et al.[2] and Aguilera et al.[3] used clay additional conductivity to improve water saturation if formation remained high shale content. Up to now,this approach has been accepted widely by oil and gas industry.
The classic Archie equations contain four input parameters,i.e. a,b,m,and n. As defined by Archie himself,all the four parameters are related to the effects of lithology,grain cement,wettability and saturation on rock resistivity[1].
Since the Archie equations were first established,in the past more than 70 years,there have been many publications and researchers to clarify the physical meanings of these parameters[3, 4, 5, 6, 7]. Many researchers have proposed a number of approaches in order to derive these parameters from experiments or/and data analysis. For instance,Aguilera[3, 4, 5] and Li et al.[6, 7] devoted their research to explain the physical properties of these meanings and proposed new methods to determine these parameters. A multiphase fluid system will be created within the pores in rock when the pores are saturated fully by multiphase fluids (such as oil,gas and water). Glover[8] put forward the general Archie’s equations to study the petrophysical properties for the multiphase system. The fundamental principles in these studies are based on the weighted geometric mean of fluids’ resistivity among different phases,and it is the weighted geometric mean that forms the conductive capacity of fluid phases. It is noted that φ-Sw,m and n do have a conductivity corresponding relationship[5, 8].
In terms of the multiphase fluid conductive model,the classic Archie equations could be regarded as the model with single-phase fluid conductivity. Recent study shows that there is intimate connection between rock conductivity and pore structure. Aguilera[3] gave a theoretical expression for the parameter “m” based on the combinations of cracks and holes in rock. After categorising all pores into hole-shaped pores and cracks-shaped pores,Shang[4, 9] also used the “equivalent rock element model” to derive new formulae for water saturation estimation. As a further research based on the Waxman-Smits model[2],Oliver[10] discussed the conductive features for clay particles and considered the permutation with uniformity for clay particles either. Oliver thought his new formulae as the modifications of the Waxman-Smits model.
In this study,we propose a sphere-cylinder model as a new theoretical approach to find out the relationship between pore structure and rock conductive characters in rock,and compare the numerical simulations of our model with experimental data. The research shows that these numerical simulations and experimental data can achieve a closed agreement. Furthermore,in terms of the number simulations using the sphere-cylinder model we explain the reasons why some experimental data show divergence,and then build up a relationship between rocks’ conduction mechanism and experiment data.
2 RELATIONSHIP BETWEEN PORE STRUCTURE AND ROCK CONDUCTIVE CHARACTERSThere exist pores connected each other in rock,which are saturated by brine. Only under these conditions does rock own some current conductive capability. In other words,both the connected pores and brine filled in the pores form conductive paths in rocks. In reality,the pore structures are very complex. For the sake of simplicity,we shall use a simplified pore model to illustrate the relationship between pore structure and rock conductive property.
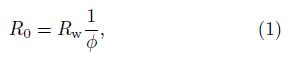
Without loss of generality,we use a rock sample embedded sphere-cylinder model (Fig.1) in a unit volume to study the relationship between pore structures and conductive properties. Conventional physics states that the resistance law is one of the fundamental approaches in research of conductive materials. The porous rock is regarded as a conductive material,and the real pores are merged into cylindrical pores,thus the rock model can be regarded as an ideal model in unit volume with a uniform straight cylindrical conductive pore (Fig.1). As the conductive model is a unit volume,both the length and cross-sectional area of the rock model are equal to one. Assuming the porosity of the rock sample is φ,the conductive section area of it should also be φ. Applying the resistance law,we can define a resistivity formula for the rock sample in unit volume as

|
Fig.1 Resistance model in a unit-volume rock sample |
Since the sample is in a unit volume,R0 numerically equals to the resistivity of rock saturated by 100% water. We state that the Eq.(1) is equal to Archie’s first equation when m = 1 and a = 1. Therefore,we can assume that the Archie equations are the resistance law of rock with particular conductive pore structures. After further examining the Archie equations,we can establish that the relationship between R0 and Sw is similar to the relationship between Rw and φ,i.e. Rw constitutes a conductive capacity of φ and R0 constitutes a conductive capacity of Sw[4, 5]. Furthermore,when the pore is saturated by brine and oil,only is the conductive cross-sectional area decreased and the conductive path does not change in rock. It can be proved that the cementation exponent (m) and saturation exponent (n) will keep the same and are equal to one. So,both of them describe the influence of the tortuous degree of conductive paths on resistivity in rock.
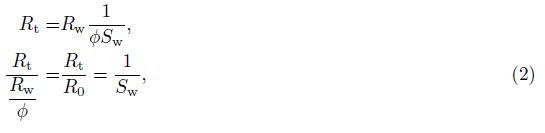
Assuming a cylindrical pore in the rock model (Fig.1) contains an oil zone with horizontal or flat layer,which leads to a volume reduction of water and the water saturation is equal to a defined Sw. Under this assumption the oil zone does not change the shape and distribution of conductive paths and it only reduces the conductive sectional area in the rock model. If the resistivity of the rock model is Rt,the model’s conductive cross-section area should be φ Sw based on the resistance law. The resistivity of the oil-bearing rock model can be derived from Eq.(2)
Researches and experiments[11, 12, 13, 5, 8] show that the conductive properties of rocks are related to pore structure. It means that when the rocks have the same porosity,they probably have different pore structures that may result in different resistivity values. Archie applied a cementation index “m” to describe how the tortuous nature of pore structure affects rock conductivity[1, 2, 3]. In reality,since rock pore structures are complicated,apart from using experimental analysis,it is still difficult to find out a satisfactory relationship between the conductivity and the pore structure in a complicated reservoir[15].
In this study we apply a sphere-cylinder model to analyze the relationship between pore structure and electrical conductivity[14]. Without loss of generality,we assume the cross-section area of the sphere-cylinder rock sample is 1 and its length is also 1,and the rock sample is within a unit volume (Fig.2).

|
Fig.2 Conductive model with spherical and cylindrical pores in a unit volume sample (rs0<$(\sqrt {\frac{1}{\pi }} )$) |
According to the equation,the radius of cylinder sample sectional area can be expressed as
Attributing the changes of pore structure to the ratio variation of cylinder radius and sphere radius (Cd in Eq.(4))[14],the volume of the sphere-cylinder model serving as porosity keeps the same as in the rock model. In the variations of Cd,the radius of the spherical pore may be less than or greater than the radius of the rock sample for a given rS0 . For example,the sphere-cylinder model may also be presented in different forms (Fig.3) when rs takes different values.

|
Fig.3 Rs value interval and degradation graph in the sphere-cylinder model |
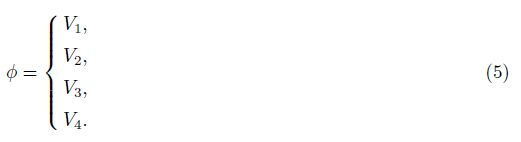
According to the different degradations of the sphere-cylinder model,the volume calculated for each degradation of the sphere-cylinder model is also equal to the pore volume,and the equations can be obtained as follows:

According to the definition of formation factor (F) in Archie equation[1],it is easy to obtain the expression of formation factors in Eq.(7).
In the models of Figs. 2 and 3,the different pore structures could be regarded as the variations of Cd. Therefore,using Eq.(7),a relationship between formation factor and porosity for the unit volume rock sample could be obtained when Cd takes different values (Fig.4).

|
Fig.4 Comparison of experimental data and numerical simulation results on formation factors |
The simulation results in Fig.4 illustrate some observations and they can be concluded as below:
(1) For the same porosity,the rock sample can have different formation factors (F) as long as the Cd takes different values,and then the rock sample has different formation resistivity values consequentially. As stated previously,since the variations of the Cd value mean the variations of the pore structure,we have proven that the changes of pore structure will lead to the changes of resistivity in an analytical method in this research.
(2) When the Cd becomes smaller,the porosity and formation factor present nonlinear variations in Fig.4 on double logarithmic coordinates (Cd=0.25 corresponding to the gray curve). The small Cd means that the rock conductive throat becomes narrow (i.e.,the conductive paths of the rock sample tend to be complex). The conductive calculations in the rock model show that in the complex pore structure,the relationship between the formation factor and porosity is a nonlinear relationship. In addition,in the complex pore structure,the cementation exponent (m) is related to the variations of porosity.
(3) When Cd value becomes larger,the pore structure of the rock tends to be simple and the relationship between the formation factor and porosity is close to linear characteristics,which shows the same conclusion with the classic Archie formula. Upon this numerical simulation,we can say that the classic Archie equations describe rock electrical properties in simple pore structures based on the rock’s resistance law. To compare the rock resistivity measurement data with the numerical simulation results,the two sets of data are marked in Fig.4,and they show some agreements when the pore structures take the same parameters.
(4) Especially,for the data divergences appearing in the measurement data,they cannot be all attributed to measurement errors. The modeling results indicate that the changes of rock pore structure might also lead to the divergence in experimental data.
Comparing Eq.(7) with Archie’s first law,according to the resistance law,the formula form and calculation results of Eq.(7) are independent of experimental data. So,Eq.(7) could be regarded as a forward model. On the other hand,because the Archie’s laws are fitting formulae based on the analysis of experimental data,the formulae forms and calculations are dependent on experimental data. And then the Archie’s laws belong to inversion model. In fact,after fitting the simulations in Fig.4 in the form of Archie’s first equation,we can also obtain a corresponding form for the sphere-cylinder model (Fig.5). Assuming Cd=0.25,Table1 gives the model corresponding to Archie’s first equation. During the data fitting process,some boundary points are appropriately removed in order to increase the impacts of intermediate data on the fitting of Eq.(8).

|
Fig.5 Comparison of number simulation with sphere-cylinder model and Archie’s fitting |
| Table 1 Numerical simulations with Cd=0.25 |

The cementation exponent (m) in Eq.(8) is equal to 1.401,which means Cd=0.25 in the sphere-cylinder model and m=1.401 in Archie’s first equation have the same electrical properties for the rock sample. In other words,Eq.(7) corresponding to Cd=0.25 and Archie’s first equation corresponding to parameters a=1.528 and m=1.401 (Eq.(8)) make the same sense to describe rock conductivity. So,Eq.(8) is a fitting formula of simulation data in Fig.5.
When oil and gas flow into the rock sample in Fig.1,apart from the conductive volume difference,the forms of oil and gas should be fully consistent with the pore structure in the sphere-cylinder model (Fig.6 and Eq.(9)).


|
Fig.6 Oil-bearing sphere-cylinder model |
As illustrated in Eq.(7),it gives a rock- electrical relationship in the rock sample that is saturated by brine only in the sphere-cylinder model. Just taking Eq.(7) for an example,we conduct research on rock electrical properties saturated by oil and brine in the first case and rs <$\sqrt {1/\pi } $,and the other situations could be estimated based on this relationship. Using the resistance law for the resistance infinitesimal in Fig.6 similarly to the resistivity expression in Eq.(7),the resistivity of the oil-bearing sphere-cylinder model can be defined (Eq.(10)). Assuming the radius of oil beads is rso,the resistivity of hydrocarbon-bearing rock can be written as
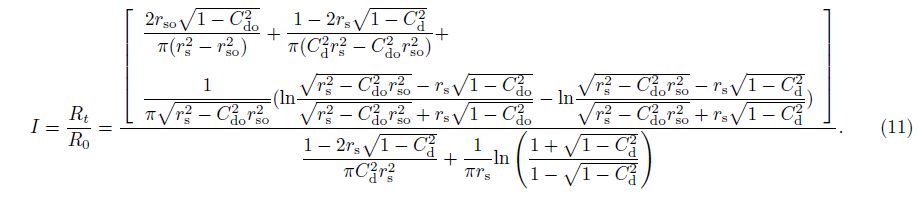
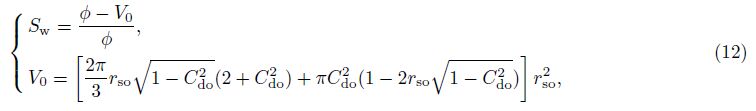
Eq.(12) is a cubic equation with respect to variable rso which can be determined by Eq.(13) using an iterative format. Our research shows that this iterative format is convergent mathematically.


|
Fig.7 comparison of lab data and number simulation for I-Sw relations in oil-bearing sphere-cylinder model |
Comparing the numerical simulations in Fig.4 and Fig.7 shows that for Cd taking 0.25,0.35 and 0.95,it poses opposite effects on the relationships F-φ and I-Sw. When Cd increases,for example,the relationship “F-φ” tends to be a straight line,while that of I-Sw tends to be a curve. Because the small Cd means small conductive paths and complex pore structure. The numerical simulations in Fig.4 confirm that the relationship of “F-φ” will be a nonlinear function in complex pore structure. Furthermore,the conductive paths will get more complex due to the different combinations between pore walls and oil beads when the pores are saturated by oil (Fig.7). The value of Cdo may be greater or smaller than the value of Cd,and then the relationship of “I-Sw” may take different non-linear functions. Particularly,when Cdo is greater than Cd,the rock resistivity shows a trend to decrease,meaning some low resistivity in the oil-bearing zone. That states,some special combinations between pore walls and oil beads may still result in the low resistivity in the oil-bearing zone even though some factors,such as the salinity of formation water and conductive minerals,are not taken into account. Of course,the rock resistivity may also increase sharply when Cdo is smaller than Cd. In this situation,it is the even distribution of oil beads that makes the rock resistivity increase (Fig.7). So,the increase of reservoir resistivity in logs may be related with the special combinations between pore walls and oil beads,and the good properties of reservoirs[16].
For example,in the case of Sw = 0.2 (oil-bearing zones) and for the first situation Cd = Cdo = 0.35,the second situation Cd = 0.65 and Cdo = 0.45,and the third Cd = 0.45 and Cdo = 0.65,the calculated resistivity indexes (I) are 5.815,42.367 and 3.153 respectively,according to Eq.(11). It means that some special combinations between pore walls and oil beads may still make the rock resistivity increase or decrease even though the oil saturations are the same. Actually this phenomenon has been discovered in logs data and experimental data[13, 16],and the conductive mechanism of it is proved by numerical simulation with analytical equations in this work.
Figure8 is the log data from Well-Luo 20. In zone 2,the top section shows high resistivity of 20 Ωm or so,but the bottom section has low resistivity only about 10 Ωm. Since the lithology and pore structure are almost the same,the decrease of resistivity can be attributed to the special combinations between pore walls and oil beads. On the other hand,the non-uniform distribution of ill beads may lead to the low resistivity in the oil-bearing zone with high oil saturation when the complex pore structures exist in the zone. Therefore,the numerical simulations in our study show that the complex pore structure is one of the reasons for low resistivity in oil-bearing reservoirs in log interpretation.

|
Fig.8 Resistivity changes due to the different pore structure |
This research is based on the sphere-cylinder model and analyzes the conductive relationships for water fully and hydrocarbon partly saturated rocks by the resistance law. Comparison of the numerical simulations of this work,experimental data and real log data shows good agreement.
(1) Archie’s equations are the special forms of the resistance law on the condition of rock conduction with simple or/and complex pore structure;
(2) Different pore structures could lead to different forms of rock conduction relationship and divergence in measurement data. So the data divergence may not only be attributed to measurement errors,but also be related to pore structures. In addition,oil beads existing in rock may lead to experimental data divergence because the distribution of oil beads in pores probably produces more complex conductive paths;
(3) Both the real logs and numerical simulation in this research have confirmed that even distribution of oil beads may lead to the high resistivity if the reservoir properties are pretty good. On the other hand,the complex pore structure is also one of factors that can lead to low resistivity in oil-bearing zones.
This research is focused on the mechanism between rock conduction and pore structure. It still requires more analysis on how apply the results to real log data. For example,more solutions and analysis are required for engineers on how to differentiate oil-bearing and brine-bearing zones with resistivity when pore structures in reservoirs are very complex. In addition,the sphere-cylinder model is a relatively regular one,and it is suitable to reservoirs in porous detrital rock. For more complex reservoirs,such as irregular porous or fractured reservoirs,more data and research are needed to verify the model.
6 ACKNOWLEDGMENTSThree anonymous reviewers provided good suggestions to improve this manuscript,and an undergraduate in Tongji University,Wunier,has taken part in the study. This work was supported by the National 863 program (2006AA06Z214),China Petroleum Group technology program (2011B-4000) and State Key Lab of Oil and Gas Geology and Exploitation Engineering.
| [1] Archie G E. The electrical resistivity log as an aid in determining some reservoir characteristics. Transactions of the American Institute of Mining, Metallurgical and Petroleum Engineers, 1942, 146(1): 54-62. |
| [2] Waxman M H, Smits L J M. Electrical conductivities in oil-bearing shaly sands. Soc. Petr. Eng. J., 1968, 8(2): 107-122. |
| [3] Aguilera R, Aguilera F R F. A triple porosity model for petrophysical analysis of naturally fractured reservoirs. Petrophysics, 2004, 45(2): 157-166. |
| [4] Kennedy D. The porosity-water saturation-conductivity relationship: an alternative to Archie's model. Petrophysics, 2007, 48(5): 335-361. |
| [5] Berg C R. Dual-porosity equations from effective medium theory. SPE 101698, 2006 SPE Annual Conference and Exhibition held in San Antonio, Texas, U. S. A., 2006: 24-27. |
| [6] Li N. Necessary conditions for the existence of one kind of logging response equations. Acta Geophysics Sinica (Chinese J. Geophys.) (in Chinese), 1989, 32(3): 329-337. |
| [7] Li N. General forms of the resistivity-porosity and resistivity-oil/gas saturation relations, as well as the determination of their optimum approximating function types (I). Acta Geophysics Sinica (Chinese J. Geophys.) (in Chinese), 1989, 32(5): 580-592. |
| [8] Glover P W J. A generalized Archie's law for n phases. Geophysics, 2010, 75(6): E247-E265. |
| [9] Shang B, Hamman J, Caldwell D. Improved water saturation estimation using equivalent rock element model and applications to different rock types, SPE-113342, 70th EAGE Conference & Exhibition, Rome, Italy, 2008. |
| [10] de Lima O A, Sharma M M. A grain conductivity approach to shaly sandstones. Geophysics, 1990, 55(10): 1347-1356. |
| [11] Mao Z Q, Gao C Q. Theoretical simulation of the resistivity and pore structure of hydrocarbon bearing rocks. Petroleum Exploration and Development (in Chinese), 2000, 27(2): 87-90. |
| [12] Wang K W, Sun J M, Guan J T, et al. Percolation network modeling of electrical properties of reservoir rock. Acta Petrolei Sinica (in Chinese), 2007, 28(1): 101-106. |
| [13] Sun J M, Wu J L, Yu D G, et al. Influential factors in Archie parameters experiment. Petroleum Geology & Oil Field Development in Daqing (in Chinese), 2006, 25(2): 39-41. |
| [14] Liu T Y, Xiao L Z, Fu R S, et al. Applications and characterization of NMR relation derived from sphere-capillary model. Chinese J. Geophys. (in Chinese), 2004, 47(4): 663-671. |
| [15] Spangenberg E. Modeling of the influence of gas hydrate content on the electrical properties of porous sediments. Journal of Geophysical Research, 2001, 106(B4): 6535-6548. |
| [16] Ouyang J, Wang G W. Analysis and Evaluation of Oil-gas-bearing Reservoir in Logging Geology. Beijing: Petroleum Industry Press, 1999: 192-199. |