 2013, Vol. 56


2. University of Chinese Academy of Sciences, Beijing 100049, China;
3. China University of Petroleum(Beijing), Beijing 102249, China
The Junggar basin lies in northern Xinjiang,spanning 81°E-92°E and 43°N-48°N,which is an important basin bearing oil and gas. In plane view,it is approximately a triangle,narrow in north and broad in south,700 km in EW and 370 km in NS directions,covering an area of 13.4×10⁴ km2 with maximum thickness of sediments up to 15 km[1]. Its tectonic setting is the conjunction among the Kazakhstan,Siberia and Tarim plates,or eastward extension of the Kazakhstan plate. This is a superposed basin with multiple cycles,bounded by Paleozoic sutures on three sides,which developed and formed from late Carboniferous to Quaternary[2, 3]. It is characterized by a double-layer base structure consisting of an early Paleozoic folded basement and a Precambrian crystalline basement[4, 5],and has undergone many periods of tectonic-thermal evolution[6, 7, 8]. The Junggar basin is divided into six first-order tectonic units with distinct features,which are the Wulungu depression,Luliang uplift,central depression,west uplift,east uplift,and range-front depression of North Tianshan[9] (Fig.1).

|
Fig.1 Map showing division of tectonic units (Ref.[9]) and measurement sites of rock thermal conductivity and heat flow in the Junggar basin I-Wulungu depression; II-Luliang uplift; III-Central depression; IV-West uplift; V-Rang-front depression of North Tianshan; VI-East uplift. |
Studies on present-day geotemperature fields and lithospheric thermal structure of the Junggar basin began since the 1990s. A number of heat flow data have been reported which are yields by temperature measurements in boreholes within the basin and on its rim,as well as measurements of physical properties such as thermal conductivity and heat generation on samples,resulting in general knowledge on features of the current geotemperature field in the basin[10, 11, 12, 13, 14]. For instance,through calculation using data from 760 sites,Liu et al. obtained the geotemperature gradient 20.7 °C/km and heat flow 35.6 mW/m2 in the basin,and suggested that it is a cold basin[10]. Zhang et al. reported the geotemperature gradient 23.7 °C/km and heat flow 40.8 mW/m2 in the Huoshaoshan oilfield,east uplift of the Junggar basin[11]. By studying the 305 geoscience transect in Xinjiang,Zhu et al. suggested that the heat flow of the southwestern Junggar basin is higher than that at the range-front of the North Tianshan and northwestern margin[12]. Qiu et al. analyzed the distribution of geotemperatures in the Junggar basin,and considered that the structure of sedimentary strata determines temperature distribution at depth when the surface heat flow values are little different[13]. Based on measurements of geotemperatures and thermal conductivity of rocks,Wang et al. presented the first batch of heat flow data for the Junggar basin,including 26 values of A class,8 of B class,and 1 of D class (i.e. the Xiao No.1 well at the range-front of the North Tianshan,with the geotemperature gradient 11.6 °C/km and heat flow 23.4 mW/m2,site No.20 in Fig.1),with the average geotemperature gradient 21.2 °C/km and heat flow 42.3±7.7 mW/m2 for the whole basin[14]. So far,only the data reported by Wang et al. above are the high-quality heat flow values for the Junggar basin that have been collected into the global terrestrial heat flow database.
Since 2000,with rapid development of petroleum exploration,the amount of geothermal data in the Junggar basin has increased; and the application of the optical scanning method makes it possible to measure thermal conductivity of rocks on larges scales and at a high accuracy[15]. In such a context,we have collected temperature data from 102 newly drilled boreholes and more than 400 wells in which oil tests were conducted. And from the latter kind of data we chose temperature data of 11 wells high quality. Meanwhile,we measured thermal conductivity on 187 samples from 15 wells,and for the first time we established the thermal conductivity column of the Junggar basin. Consequently we obtained 11 new heat flow values of high quality,and made a further analysis of features of heat flow distribution in the basin. Moreover,in terms of a layered crustal model,we attempted to reveal the difference of lithospheric thermal structure between the east uplift of the Junggar basin and the range-front depression of the North Tianshan. This work is the latest advancement of the present-day geotemperature field of the Junggar basin,and would provide evidence in geothermics for basin dynamics and evaluation of oil-gas resources.
2 DATA OF GEOTEMPERATURE 2.1 Categories of Geotemperature DataResearch of the present-day geotemperature field of a sedimentary basin relies upon various measurements of temperature in boreholes,of which the data quality is highly variable. From high to low quality of data,they can be classified into four categories[16],each of which plays a distinct role in research of the geotemperature field. (1) Temperature data from systematic measurements in a stable state,which means systematic measurements made after the borehole reaches thermal balance. The resulting data reflect the real geothermal status of the study area,thus most reliable and accurate,and most significant for geothermal research. Unfortunately,such data are difficult to acquire,and actually this kind of data are little available. (2) Temperature data from measurements in a static well,which are the temperature of tested oil at one perforation section measured by the instrument that is placed into the well closed several days or long time,or measured at different depths after the well is closed several times. To some degree,this kind of temperature data can replace temperature data from systematic measurements in a stable state,and serve as main evidence for research of the geotemperature field. (3) Temperature data from quasi-stable state measurements,which refers that collected in a well closed 1 to 3 days to be in a static state. Compared with the data from measurements in a stable state,this kind of data have big errors,which can be used as a supplement for regional geothermal research. (4) Temperature data from instantaneous measurements,referring to that made within one day after the well is completed. Because of shot-time for the well being static,the balance between the geotemperature and well-temperature is not reached yet,so the measured temperature in the well cannot reflect the real geotemperature,and cannot be utilized in research of the geothermal field. For example,in the well Mosheng No.1 in the Junggar basin,the instantaneous measurements at depths 470~4472 m reveal a geotemperature gradient merely 8.1 °C/km,much less than the gradient merely 21.0 °C/km from the measurements in the oil test well.
2.2 Analysis and Choice of Geotemperature DataBased on the work of Wang et al.[14],we have collected temperature data which were systematically measured in 102 wells newly drilled since 2000 and data from measurements in more than 400 wells for oil tests. After analysis to these data,we pick up the data of 11 wells with high quality,which are the wells Cai 47,Xiquan 092,Sha 19,Mo 15,Mana 1,Guai 19,Fudong 5,Caishen 1,Cai 504,Cai 45 and Xiayan 15 (Fig.2). Overall,these temperature values increase linearly with depth,in agreement with the feature of conductive geotherm,except local abnormal changes in some well sections due to influence of faults or activity of underground water. Therefore these data can be utilized in research of the present-day geotempertaure field in the Junggar basin.

|
Fig.2 Temperature-depth curves in newly drilled wells in the Junggar basin Well names: 1-Cai 47; 2-Xiquan 092; 3-Sha 19; 4-Mo 15; 5-Mana 1; 6-Guai 19; 7-Fudong 5; 8-Caishen 1; 9-Cai 504; 10-Cai 45; 11-Xiayan 15. |
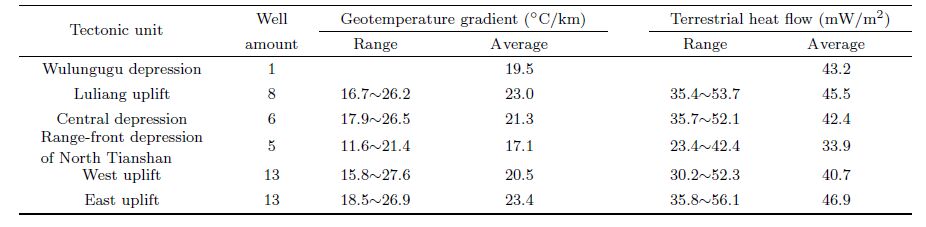
By fitting the temperature-depth curves using the least squares method,we obtain geothermal gradients of the 11 wells (Table3). The coefficients,all greater than 0.99,indicate a good linear relationship between temperature and depth as well as reliable calculation of geothermal gradients. In conjunction with the 35 data of geothermal gradients from Wang et al.[14],we plot contours of these values (Fig.3),and make statistics for each tectonic unit (Table4). The results show that the present-day geothermal gradients are 11.6~27.6 °C/km,21.3±3.7 °C/km on average,close to that of the Tarim basin (22.6±3.0 °C/km)[17],less than that of the Qaidam basin (22~33 °C/km)[18],Ordos basin (29.3 °C/km)[19],and Sichuan basin (22.8 °C/km)[20],while much lower than that of the Mesozoic-Cenozoic rift basins in eastern China[21, 22, 23, 24, 25, 26]. In regional view,the geothermal gradients seem to be associated with shapes of basement structure. They are the highest in the east uplift,varying in 18.5~26.9 °C/km,23.4 °C/km on average; next in the Luliang 16.7~26.2 °C/km,23.0 °C/km on average; and largely same in the central depression and west uplift with 21.3 °C/km and 20.5 °C/km,respectively. At the unique site in the Wulungu depression,the gradient is 19.5 °C/km. And the geothermal gradients in the range-front depression of the North Tianshan are the lowest,11.6~21.4 °C/km,17.1 °C/km on average.

|
Fig.3 Contours of present-day geothermal gradient in the Junggar basin (°C/km) |
3 THERMAL CONDUCTIVITY OF ROCKS 3.1 Measurement Method of Rock Thermal Conductivity
Rock thermal conductivity describes the rock’s property to conduct heat,which is defined as the thermal flow that runs from one side to the other side of a unit-thickness rock with temperature difference 1 °C within a unit time along the direction of heat conduction,with unit W/(m·K). Accurate measurements of thermal conductivity of rocks are an essential part of research of geotherm and physical properties of rocks. There are many methods of the measurement,such as the widely used axial heat flow method (divided bar method) with an one-dimensional stable heat source and thermal line method (probe method) with a two-dimensional radial unstable heat source[27]. Since the 1990s,the optical scanning technique[15] was widely applied to measurements of rock thermal conductivity,which has advantages such as high work efficiency,non contact manner,direct measurements on rock-cores (no need to make samples) and being able to estimate anisotropy and inhomogeneity of rocks. So far the successful cases of its utility includes the Vorotilovo deep borehole at the East Europe platform[28],deep borehole at the Kola peninsula of Russia[29],and deep borehole at the Sulu-Dabie area of China[30].
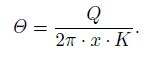
In this work,we use the Thermal Conductivity Scanning (TCS) device made by Germany with a measurement range 0.2~25W/(m·K) and accuracy ±3%. During the measurement process,two infrared sensors records temperatures before and after heating,of which the difference is temperature increment Θ
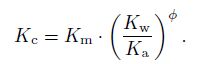
Many factors can influence rock thermal conductivity,such as temperature,pressure,properties of rock proper,and degree of compressive diageneis,among which composition and structure of rock seem most important. Rock thermal conductivity declines with increasing temperature and rises with growing pressure,both can be balanced at depth to some extent. In loose porous rocks,porosity and other relevant features,such as size of pores,their connection,water content and filling material,can pose great effects on rock thermal conductivity. So the saturated water correction should be performed on the measurements[27]:
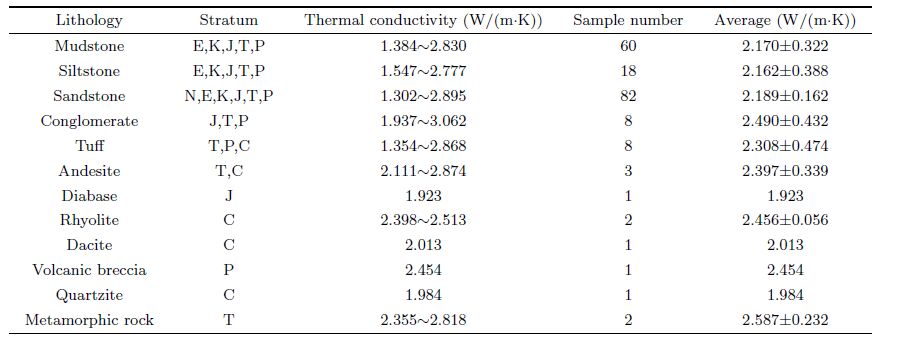
This work made in situ measurements of thermal conductivity on 187 pieces of rock samples from 15 wells (i.e. Luncan 1,Lu 9,Shi 120,Ludong 1,Dizhong 1,Fengcheng 1,Ma 13,Zhongjia 1,Shamen 1,Pen 4,Moshen 1,Pencan 2,Huo 10,Tai 8,and Ji 174). Selection of samples complies with the following three principles: Covering all the first-order tectonic units of the Junggar basin (Fig.1),including all strata of sedimentary cover (C,P,T,J,K,E,and N),and almost all rock types (conglomerate,coarse sandstone,medium-grain size sandstone,fine sandstone,siltstone,mudstone,igneous rock,and metamorphic rock). The statistical histogram (Fig.4) show relatively concentrated values of thermal conductivity,varying 1.167~3.062 W/(m·K),2.209±0.383 W/(m·K) on average; mostly in 2.0~2.6 W/(m·K) that account for 57.2% of the total. This result is slightly greater than that of Qiu et al. from statistics of 160 samples,i.e. 2.048 W/(m·K)[31]; while very close to the mean value 2.048 W/(m·K) of the Tarim basin[32]. The measured thermal conductivity values of various rocks from the Junggar basin are listed in Table1,which indicates high values of conglomerate and metamorphic rocks,largely same thermal conductivity values of mudstone,siltstone and sandstone,and highly variable values of different igneous rocks.

|
Fig.4 Histogram of thermal conductivity values of rocks in the Junngar basin |
| Table 1 Thermal conductivity data of different lithology in Junggar basin |
As shown in Fig.5,the measurements of rock thermal conductivity in this work are in the depth range 1146~7005 m,mostly in 2500~550 m. Except individual abnormal points,the thermal conductivity values generally slightly increase with depth,in accordance with the rule that rock thermal conductivity is positively correlated with depth. But such correlation differs for different rocks. For example,the thermal conductivity of coarse sandstone and conglomerate increases with depth with a little change,implying small correlation to depth; that of medium-grain size sandstone,fine sandstone and siltstone grows linearly with depth; and that of igneous rocks (primarily tuff) is also positively correlated with depth. The possible explanation is that for sandstones and mudstones dominated by inter-grain space,and igneous rocks with dominant fissures,compaction is strengthened with increasing depth,thus their porosity declines gradually,leading to enhancement of thermal conductivity[14].

|
Fig.5 Relationships of thermal conductivity versus depth for various rocks in the Junggar basin |
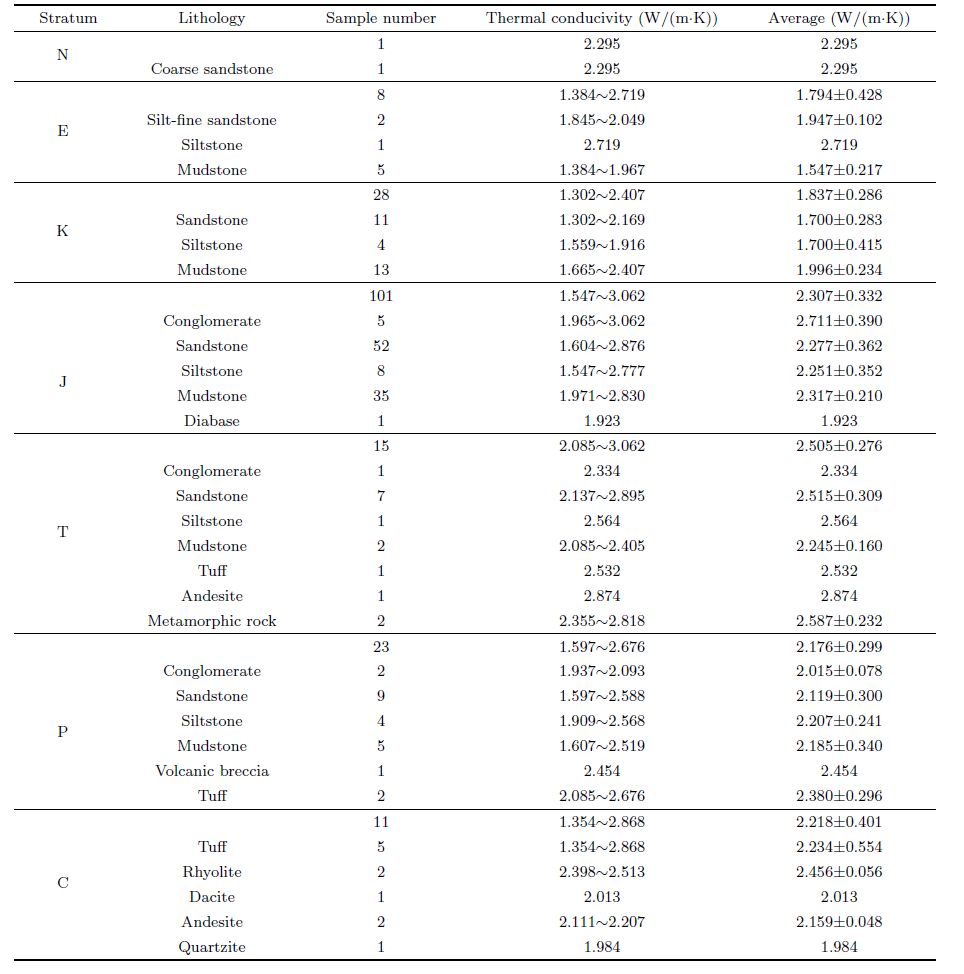
As stated previously,measurements of this work cover all strata of the sedimentary cover of the Junggar basin (C,P,T,J,K,E. and N). Based on rock thermal conductivity data from measurements on 187 samples,we establish the thermal conductivity column of the Junggar basin for the first time (Table2). It indicates that excluding only one sample of Neogene,the thermal conductivity of Triassic is the highest,as 2.505±0.276 W/(m·K) on average; next is Jurassic and Carboniferous with mean values 2.307±0.332 W/(m·K) and 2.218±0.401 W/(m·K),respectively; that of Permian is 2.176±0.299 W/(m·K) on average; and the values of Cretaceous and Eogene are the lowest,1.837±0.286 W/(m·K) and 1.794±0.428 W/(m·K),respectively. Through weighted averaging to the thickness of each layer,we estimate the mean thermal conductivity of each section measured in the well (Table3).
| Table 2 Column of stratum thermal conductivity for the Junggar basin |
| Table 3 New heat flow data of the Junggar basin |
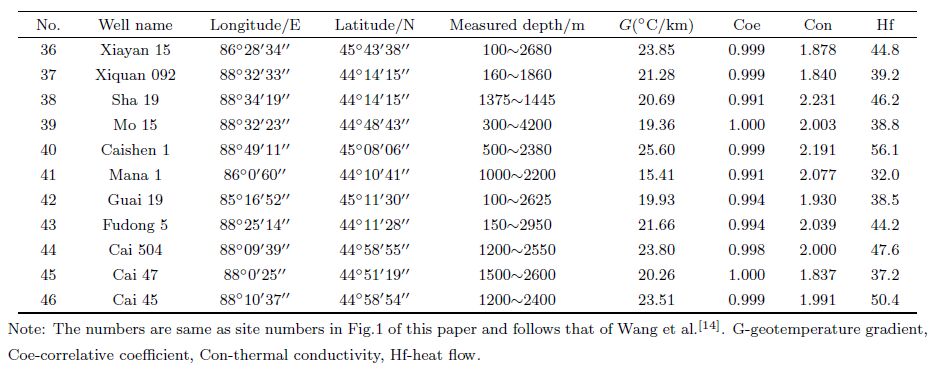
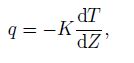
By definition,the surface (terrestrial) heat flow at a given locality is the rate of heat transferred across Earth’s surface at that place per unit area per unit time. It reflects the energy balance among various dynamic processes of Earth’s interior on the surface. It is determined as the product of the thermal conductivity and the vertical gradient of temperature
Apparently,the quality of heat flow data depends on measurement accuracy of temperature gradients and rock thermal conductivity. In this work,the 11 wells for heat flow calculation are all oil test boreholes with good linearity of well temperature data,representing the feature of the conductive geotemperature field. The thermal conductivity values are determined based on column of rock thermal conductivity of the Junggar basin and weighted averaging to each thickness of varied layers. Therefore,the resulting heat flow data have high quality,attributed to A class.
4.2 Features of Heat Flow in the Junggar BasinTable3 shows heat flow values calculated using the data of the 11 wells including the well Xiayan 15. In conjunction with the 35 heat flow values of Wang et al.[14],we prepare a map showing distribution of presentday terrestrial heat flow values in the Junggar basin (Fig.6),and their averages in each tectonic unit are listed in Table4. The results indicate that the terrestrial heat flow in the Junggar basin is in 23.4~56.1 mW/m2,42.5±7.4 mW/m2 on average,which is very close to that of the Tarim basin (43.0±8.5 mW/m2),less than that of large- and medium-scale basins in central and eastern China and offshore[18, 19, 20, 21, 22, 23, 24, 25, 26],also lower than that of the mean heat flow of China mainland (63±24.2 mW/m2)[33]. Thus,the Junggar basin is classed as one of the so-called cold basins with heat flow less than 50 W/m2[34],indicative of a tectonic setting consistent with typical cartonic basins in the world such as the Michigan basin[35] and Williston basin[36]. In the entire Junggar basin,the heat flow is largely in accordance with geotemperature gradients in distribution,both controlled by the relief of the basement structure. The heat flow is the highest in the east uplift with 35.8~56.1 mW/m2 and 46.9 mW/m2 on average; next is the Luliang uplift with 35.4~53.7 mW/m2 and 45.5 mW/m2 on average; relatively low in the Wulungu depression,central depression and west uplift with 43.2,42.4,and 40.7 mW/m2,respectively; and least in the range-front depression of the North Tianshan with merely 23.4.8~42.8 mW/m2 and 33.9 mW/m2 on average.

|
Fig.6 Distribution of present-day heat flow in the Junggar basin |
| Table 4 Geotemperature gradients and heat flow in tectonic units of the Junggar basin |
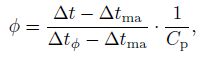
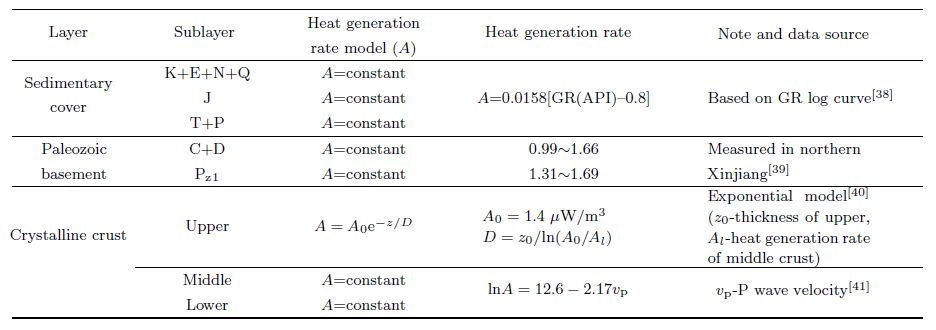
Terrestrial heat flow includes two parts,one is the heat generated by radioactive elements of rocks in crust such as U,Th and K (crustal heat flow,qc),the other is heat from deep Earth (mantle heat flow,qm). The proportions and constitutive relationship of these two kinds of heat determine the thermal structure of lithosphere in a region,which poses direct effects on current activity of crust and mantle as well as temperature status at depth. In this work,based on the layered crustal model of the Junggar basin,we use the back-stripping method to calculate the heat (qA) produced by radioactive elements of crust in each layer,and obtain mantle heat flow by qm = q - qc where qc = ΣqA. The layered model used references to that of Shao et al.[4],and the model of heat generation rates and its values taken are listed in Table5.
| Table 5 Crust heat generation model and its parameters for the Junggar basin |
Terrestrial heat flow is controlled by the shape of basement structure and overlying cover thickness. In the area with basement warped downward and thick sediments,the sedimentary rocks,which have lower thermal conductivity relative to basement rocks,can screen the heat flow from deep crust. Consequently,the heat flow in this area is refracted laterally,resulting in higher heat flow in the uplift of the basin than that of the depression. Besides,rapid sedimentation imposes strong suppression on the geotemperature field and terrestrial heat flow,making the surface heat flow decline fast. In the Junggar basin,the Moho interface below the east uplift is 43.5 km deep,B interface 6 km deep,while the sedimentary cover is merely 3.5 km thick. In contrast,in the North Tianshan,the Moho is 50 km deep beneath the range-front depression,B interface 13.8 km deep,and the sedimentary cover is as thick as 12.9 km[4]. Due to such big differences in basement structure and thickness of the sedimentary cover,the heat flow in the east uplift is larger than that in the range-front depression of the North Tianshan. Moreover,the rapid deposition in this depression since Cenozoic might have caused further decrease of its surface heat flow. Therefore,it is necessary to recover the surface heat flow before calculation to remove the anomalies of heat flow caused by heat flow convergence and rapid sedimentation.
In this study,we choose representative tectonic units in the Junggar basin for calculation of lithospheric thermal structure. One is the east uplift featured by highest heat flow and least thickness of sediments. The other is the range-front depression of the North Tianshan with lowest heat flow and largest thickness of sediments. The results can be regarded as the lower and upper limits for ratios of crust/mantle heat flow in the Junggar basin. For convenience in comparison,the two tectonic units are assigned the average heat flow 42.5 of the basin. The calculations (Fig.7) indicate that in the east uplift,the crust heat flow is 18.8 mW/m2,mantle heat flow 23.7 mW/m2,and ratio of crust to mantle heat flow is 0.79. While in the range-front depression of the North Tianshan,these three parameters are 26.0 mW/m2,16.5 mW/m2,and 1.58,respectively. Using He isotope ratios of underground fluids,Wang estimated the mantle heat flow 21.0 mW/m2 and crust to mantle ratio 1.5 in the Junggar basin[37],largely consistent with the results of this work.

|
Fig.7 Lithospheric thermal structure of the Junggar basin (a) east uplift; (b) range-front depression of North Tianshan. (crustal models are from Shao et al.[4]) |
In the Junggar basin,the present-day geotemperature gradients are 11.6~27.6 °C/km,21.3±3.7 °C/km on aveage,relatively low. In the whole region,the distribution of these values are closely related with basement structure. The geotemperature gradient is the highest in the east uplift with mean 23.4 °C/km,next in the Luliang uplift with an average value 23.0 °C/km,largely same values in the central depression and west uplift with 21.3 °C/km and 20.5 °C/km,respectively; and the lowest appearing in the range-front depression of the North Tianshan with mean merely 17.1 °C/km.
The values of rock thermal conductivity are relatively concentrated,in the range 1.167~3.062 W/(m·K),2.209±0.383 W/(m·K) on average,mostly in 2.0~2.6 W/(m·K). The statistics shows that such values of conglomerate and metamorphic rocks are relatively high,those of mudstone,siltstone and sandstone are roughly same,while differ much for various volcanic rocks. Overall,the rock thermal conductivity grows slightly with increasing depth,in agreement with the general rule that the rock thermal conductivity is positively correlated with depth. Based on the data measured on 187 samples,this work establishes for the first time the thermal conductivity column of the Junggar basin,which shows the highest thermal conductivity in the Triassic System,next the Jurassic,Carboniferous,and Permian,and lowest in the Cretaceous and Eogene Systems.
Using the high-quality geotemperature and high-accuracy heat flow data,this work offers 11 new values of terrestrial heat flow (A class) for the Junggar basin. They are in 23.4~56.1 mW/m2,42.5±7.4 mW/m2 on average,indicative of the feature of a cold basin. Like the geotemperature gradients,the heat flow distribution is controlled by the basement structure,which is the highest in the east uplift with the mean 46.9 mW/m2,next in the Luliang uplift by 45.5 mW/m2; and relatively in the Wulungu depression,central depression,and west uplift with 43.2,42.4,and 40.7 mW/m2,respectively. The lowest values appear in the range-front depression of the North Tianshan as merely 33.9 mW/m2.
In terms of a layered crust model,we calculate the thermal structure of lithosphere for the east uplift and range-front depression of North Tianshan,respectively. The results show that the crust heat flow is 18.8~26.0 mW/m2,mantle heat flow is 16.5~23.7 mW/m2,and the ratio of crust to mantle is 0.79~1.58,representing a thermal structure of “cold crust and cold mantle”. In lateral direction,the mantle heat flow follows the relief of the Moho interface,i.e. high values present in the Moho uplift while low values appearing in the Moho depression.
7 ACKNOWLEDGMENTSWe are grateful to the PetroChina Research Institute of Petroleum Exploration for its help in data collection. In situ measurements of rock thermal conductivity were performed in cooperation with the Institute of Exploration and Development of Xinjiang Oilfield and the Exploration Division of Xinjiang Oilfield. Two reviewers provided invaluable comments to the manuscript. This work was supported by the National Major Special Project of Science and Technology (2011ZX05008-002) and the National Natural Science Foundation of China (41102152).
| [1] Chen Y Q, Wang W F. Structural evolution and pool-forming in Junggar basin. Journal of the University of Petroleum, China (Edition of Natural Science) (in Chinese), 2004, 28(3): 4-8. |
| [2] Chen F J, Wang X W, Wang X W. Prototype and tectonic evolution of the Junggar basin, northwestern China. Earth Science Frontiers (in Chinese), 2005, 12(3): 77-89. |
| [3] Zhang C J, He D F, Wu X Z, et al. Formation and evolution of multicycle superimposed basins in Junggar basin. China Petroleum Exploration (in Chinese), 2006, (1): 47-58. |
| [4] Shao X Z, Zhang J R, Fan H J, et al. The basement structure in Junggar basin: deep-sounding by converted waves of earthquakes. Xinjiang Petroleum Geology (in Chinese), 2008, 29(4): 439-444. |
| [5] Zhao J M, Huang Y, Ma Z J, et al. Discussion on the basement structure and property of northern Junggar basin. Chinese J. Geophys.(in Chinese), 2008, 51(6): 1767-1775. |
| [6] Pan C C, Zhou Z Y, Fan S F, et al. Thermal history of Junggar basin. Geochimica (in Chinese), 1997, 26(6): 1-7. |
| [7] Wang S J, He L J, Wang J Y. Thermal regime and petroleum systems in Junggar basin, northwest China. Physics of the Earth and Planetary Interiors, 2001, 126(3-4): 237-248. |
| [8] Qiu N S, Zha M, Wang X L, et al. Tectono-thermal evolution of the Junggar basin, NW China: constraints from Ro and apatite fission track modeling. Petroleum Geoscience, 2005, 11(4): 361-372. |
| [9] Yang H B, Chen L, Kong Y H. A novel classification of structural units in Junggar basin. Xinjiang Petroleum Geology (in Chinese), 2004, 25(6): 686-688. |
| [10] Liu G B, Zhang H R. The hydrocarbon occurrence and characteristics of geothermal field in Junggar basin. Xinjiang Petroleum Geology (in Chinese), 1992, 13(2): 100-107. |
| [11] Zhang H R, Song Y W. Heat flow measurements of Huoshaoshan oilfield. Xinjiang Petroleum Geology (in Chinese), 1993, 14(4): 314-317. |
| [12] Zu J H, Wu Q F, Lian Y F, et al. The geothermal characteristics of northern section of Xinjiang 305 geoscience transect. Acta Seismologica Sinica (in Chinese), 1999, 21(4): 103-106. |
| [13] Qiu N S, Wang X L, Yang H B, et al. The characteristics of temperature distribution in the Junggar basin. Chinese Journal of Geology (in Chinese), 2011, 36(3): 350-358. |
| [14] Wang S J, Hu S B, Wang J Y. The characteristics of heat flow and geothermal fields in Junggar Basin. Chinese J. Geophys. (in Chinese), 2000, 43(6): 771-779. |
| [15] Popov Y A, Pribnow D F C, Sass J H, et al. Characterization of rock thermal conductivity by high-resolution optical scanning. Geothermics, 1999, 28(2): 253-276. |
| [16] Qiu N S, Hu S B, He L J. Principles and Applications on Thermal Regime of Sedimentary Basins (in Chinese). Beijing: Petroleum Industry Press, 2004: 6-9. |
| [17] Feng C G, Liu S W, Wang L S, et al. Present-day geothermal regime in Tarim basin, northwest China. Chinese J. Geophys. (in Chinese), 2009, 52(11): 2752-2762. |
| [18] Qiu N S, Kang Y S, Jin Z J. Temperature and pressure field in the Tertiary succession of the western Qaidam basin, northeast Qinghai-Tibet Plateau, China. Marine and Petroleum Geology, 2003, 20(5): 493-507. |
| [19] Ren Z L, Zhang S, Gao S L, et al. Tectonic thermal history and its significance on the formation of oil and gas accumulation and mineral deposit in Ordos basin. Science in China Series D: Earth Sciences, 2007, 50(Suppl. II): 27-38. |
| [20] Xu M, Zhu C Q, Tian Y T, et al. Borehole temperature logging and characteristics of subsurface temperature in the Sichuan basin. Chinese J. Geophys.Chinese J. Geophys. (in Chinese), 2011, 54(4): 1052-1060. |
| [21] He L J, Wang K L, Xiong L P, et al. Heat flow and thermal history of the South China Sea. Physics of the Earth and Planetary Interiors, 2001, 126(3-4): 211-220. |
| [22] He L J, Xiong L P, Wang J Y. Heat flow and thermal modeling of the Yinggehai basin, South China Sea. Tectonophysics, 2002, 351(3): 245-253. |
| [23] Yang S C, Hu S B, Cai D S, et al. Present-day heat flow, thermal history and tectonic subsidence of the East China Sea Basin. Marine and Petroleum Geology, 2004, 21(9): 1095-1105. |
| [24] Yuan Y S, Zhu W L, Mi L J, et al. "Uniform geothermal gradient" and heat flow in the Qiongdongnan and Pearl River Mouth Basins of the South China Sea. Marine and Petroleum Geology, 2009, 26(7): 1152-1162. |
| [25] Xu M, Zhao P, Zhu C Q, et al. Borehole temperature logging and terrestrial heat flow distribution in Jianghan basin. Chinese Journal of Geology (in Chinese), 2010, 45(1): 317-323. |
| [26] Zuo Y H, Qiu N S, Zhang Y, et al. Geothermal regime and hydrocarbon kitchen evolution of the offshore Bohai Bay basin, North China. AAPG Bulletin, 2011, 95(5): 749-769. |
| [27] Shen X J, Yang S Z, Zhang W R. Rock Thermal Physical Properties and Testing (in Chinese). Beijing: Science Press, 1998: 53-67. |
| [28] Popov Y A, Pinenov V P, Pevzner L A, et al. Geothermal characteristics of the Vorotilovo deep borehole drilled into the Puchezh-Katunk impact structure. Tectonophysics, 1998, 291(1-4): 205-223. |
| [29] Popov Y A, Pevzner S L, Pinenov V P, et al. New geothermal data from the Kola superdeep well SG-3. Tectonophysics, 1999, 306(3-4): 345-366. |
| [30] He L J, Hu S B, Huang S P, et al. Heat flow study at the Chinese Continental Scientific Drilling site: Borehole temperature, thermal conductivity, and radiogenic heat production. J. Geophys. Res., 2008, 113, B02404, doi: 10.1029/2007JB004958. |
| [31] Qiu N S. Characters of thermal conductivity and radiogenic heat production rate in basins of Northwest China. Chinese Journal of Geology (in Chinese), 2002, 37(2): 196-206. |
| [32] Liu S W, Feng C G, Wang L S, et al. Measurement and analysis of thermal conductivity of rocks in the Tarim basin, northwest China. Acta Geologica Sinica, 2011, 85(3): 598-609. |
| [33] Hu S B, He L J, Wang J Y. Heat flow in the continental area of China: a new data set. Earth and Planetary Science Letters, 2000, 179(2): 407-419. |
| [34] Wang J Y. Geothermics in China. Beijing: Seismological Press, 1996: 1-299. |
| [35] Speece M A, Bowen T D, Folcik J L, et al. Analysis of temperatures in sedimentary basins: the Michigan basin. Geophysics, 1985, 50(8): 1318-1334. |
| [36] Osadetz K G, Kohn B P, Feinstein S, et al. Thermal history of Canadian Williston basin from apatite fissiontrack thermochronology-implications for petroleum systems and geodynamic history. Tectonophysics, 2002, 349(1-4): 221-249. |
| [37] Wang Y. Estimations of the ratio of crust/mantle heat flow using Helium isotope ratio of underground fluid. Chinese J. Geophys. (in Chinese), 2000, 43(6): 762-770. |
| [38] Bucker C, Rybach L. A simple method to determine heat production from gamma-ray logs. Marine and Petroleum Geology, 1996, 13(4): 373-375. |
| [39] Ni S C, Man F S, Wang J R, et al. Characteristics of heat production distribution in northern Xinjiang. Journal of China University of Science and Technology (in Chinese), 1999, 29(4): 408-414. |
| [40] Lachenbruch A H. Crustal temperature and heat production: implications of the linear heat-flow relation. J. Geophys. Res., 1970, 75(17): 3291-3300. |
| [41] Rybach L, Buntebarth G. The variation of heat generation, density and seismic velocity with rock type in the continental lithosphere. Tectonophysics, 1984, 103(1-4): 335-344. |