 2013, Vol. 56


2. State Key Laboratory of Severe Weather (LaSW), Chinese Academy of Meteorological Sciences, Beijing 100081, China
The “sauna” weather is different from usual hot days with high temperature. People often feel sultry because of large humidity in the atmosphere. This kind of weather is characterized by high temperature, high humidity, and poor visibility. In meteorology, no standard definition is suitable for “sauna” weather. According to the meteorological data, “sauna” is generalized as the weather with the maximal temperature more than 32°C and the daily average humidity above 65%. In a hot and humid windless environment, people feel sweltering like steam sauna because the heat is difficult to diffuse from human body by perspiration as normal. Therefore this kind of atmospheric environments is called “sauna” weather or sauna days. Statistical results show that a “sauna” event can last a few days or even a week and lead to disease or even death due to exceeding the limits of human endurance. In recent years, “sauna” weathers with high temperature and humidity frequently occurred in densely populated metropolis, which has brought about devastating impacts[1, 2, 3, 4, 5, 6]. Besides the effect on human body, “sauna” weather also causes the sharp rise in water and electricity demands, which leads to contradiction between supply and demand and seriously affects daily life and production. In addition, high temperature and humidity are often accompanied by increased urban air pollution. In the context of global change, the study of this issue has received wide attention of scientists[7].
In recent years, sultry “sauna” weathers happened in North China every summer. For example, controlled by the subtropical high, a lot of water vapor was transported to Beijing along with southeasterly on 15 August in 2005. The large humidity was coupled with high temperatures exceeding 30°C, which produced a hot and humid “sauna” weather in Beijing. Another case appeared on 15 July 2006. As affected by periphery easterly airstream of typhoon “Bilis”, a lot of water vapor was transported to North China from ocean, which exacerbated the air humidity over Beijing. The nighttime maximal relative humidity reached more than 90%, resulting in the outbreak of hot and humid “sauna” weather in Beijing. Unlike South China with long-time high temperature and humidity in summer, the atmosphere is usually relatively dry in North China. The people in North China lacks sufficient warning capacity and environmental adaptability, which may bring more serious harm on human body. Therefore, it is very necessary to study the sudden hot and humid “sauna” weather in North China.
The burst of “sauna” event usually has close relationship with atmospheric circulation background and local weather situations. Owen and Robert[8] and Wolfson et al.[9] performed mesoscale numerical simulations and analyses for the hot and humid weathers in America. They pointed out that coaction of sinking motion, easterly airflow and warm advection was responsible for the hot and humid weather. Winston and Lance[10] analyzed the humidity adjustment over the Great Plains in the southern US during the period with persistent high temperature and humidity in summer of 1980. Another study showed that[11] urban heat island was also an important factor helpful to form urban hot and humid weather. However, in terms of the current research situation, how to select appropriate physical variables to qualitatively and quantitatively describe “sauna” weather and then to predict this kind of weather are still a challenging problem. On the basis of McNulty’ studies[12, 13], Doswell[14], Johns and Doswell[15], Doswell et al.[16] developed IM methodology (Ingredientsbased methodology). Then this method was applied to the operational analyses and forecasting for mid-latitude winter precipitation by Wetzel et al.[17]. They combined the forcing ascent and instability indicators into a new parameter, PVQ, as a factor for precipitation potential prediction to systematically forecast duration, intensity and type of winter precipitation. Is it possible to extend the IM method, which was initially developed for precipitation forecast, to analysis of “sauna” weather? Previous studies of sultry weather in North China focus on statistical analysis and atmospheric circulation analysis for high-temperature weather for certain regions[18, 19, 20] and include less dynamic analysis. Furthermore, they used single physical variables such as high temperature, large relative humidity, or circulation situation to analyze “sauna” weather. We further wonder whether the IM theory can be extended to the study of “sauna” weather by combining these individual factors into the IM method.
In this study the IM theory, which is developed for rainfall analyses in the past, is utilized to extend towards “sauna” weather regime. Several individual physical variables diagnosing “sauna” weather are combined into several simple and useful parameters to characterize “sauna” weather. In fact early in 2005, Gao et al.[21] diagnosed a typical hot and humid weather in Beijing from 30 July to 4 August 2002 by utilizing GMPV (generalized moist potential vorticity) anomalies which include multiple factors such as temperature, humidity and vorticity. Although they did not clearly stated the IM method in their study, it had been a good example that the IM method can be applied to the study of “sauna” weather. They also pointed out that the strong signal of GMPV anomalies covered a relatively large range. Therefore it might lead to over-predict the hightemperature and large-humidity weather by using GMPV anomalies as an index to estimate “sauna” event. Therefore, besides GMPV (including temperature, humidity and vorticity), the physical variables such as high temperature, large relative humidity, and sinking airflow which could characterize the “sauna” weather are involved in the IM method in this work. And several dynamical factors such as thermal helicity (TH), moisture helicity (MH), and moist thermal helicity (MTH) will be introduced in Section 2 on the basis of the IM method. In Section 3, these factors are utilized to dynamically identify two “sauna” weather processes occurred from 30 July to 4 August 2002 and from 7 to 9 July 2009. Summary is given in the last section.
2 THERMAL HELICITY AND MOISTURE HELICITYAccording to statistics, the hot weathers with temperature more than 40°C in North China are mostly concentrated in late June and July[20]. While the “sauna” weathers in North China frequently happen in mid-July to early August, when the air does not have the highest temperature of the area in summertime. Only because of the large humidity during “sauna” days, human body “feels” very hot. Although the “sauna” weather takes place generally in a high-temperature environment in summer, it is difficult to diagnose “sauna” event depending only on temperature because of large humidity during “sauna” events. The moisture is also a necessary factor to be considered. From the existing researches, “sauna” weathers are often present under sinking motion and a relatively stable circulation background. Therefore, on the basis of GMPV, considering the high temperature and humidity and the special circulation characteristics during “sauna” processes, thermal helicity (TH, including temperature, vorticity and sinking motion), moisture helicity (MH, including humidity, vorticity and sinking motion) and moist thermal helicity (MTH, which embodies the coaction among temperature, humidity, vorticity, and sinking motion) are introduced to dynamically identify “sauna” weather. From them, we attempt to seek a simple, effective, easy to use physical parameter to characterize “sauna” weather. The TH, MH, and MTH are expressed as
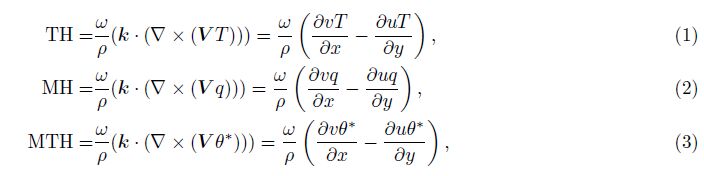
As O(△T) $ \ll $ O(T), O(△θ*) $ \ll $ O(θ*), O(△q) ~ O(q), where the units of T and θ* are K, respectively, and the unit of q is kg/kg. In Eq.(1), there are relations: $O\left( {v\frac{{\partial T}}{{\partial x}}} \right) \ll O\left( {T\frac{{\partial v}}{{\partial x}}} \right),O\left( {u\frac{{\partial T}}{{\partial y}}} \right) \ll O\left( {T\frac{{\partial u}}{{\partial y}}} \right).$ In Eq.(2), $O\left( {v\frac{{\partial q}}{{\partial x}}} \right) \sim O\left( {q\frac{{\partial v}}{{\partial x}}} \right),O\left( {u\frac{{\partial q}}{{\partial y}}} \right) \sim O\left( {q\frac{{\partial u}}{{\partial y}}} \right).$ And in Eq.(3), $O\left( {v\frac{{\partial {\theta ^*}}}{{\partial x}}} \right) \ll O\left( {{\theta ^*}\frac{{\partial v}}{{\partial x}}} \right),O\left( {u\frac{{\partial {\theta ^*}}}{{\partial y}}} \right) \ll O\left( {{\theta ^*}\frac{{\partial u}}{{\partial y}}} \right).$ Thus Eqs.(1)-(3) can be simplified as
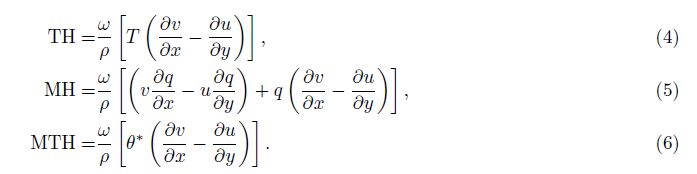
Eqs.(1)-(3) are expanded from the expression of helicity $\left( {H = \frac{1}{\rho }V \cdot \left( {\nabla \times V} \right)} \right)$. The temperature, the moisture, and the moist thermal effects are considered and extended into the helicity concept, respectively. Three kinds of expansion forms of helicity: $\frac{1}{\rho }V \cdot \left( {\nabla \times \left( {VT} \right)} \right),\frac{1}{\rho }V \cdot \left( {\nabla \times \left( {Vq} \right)} \right)$ and $\frac{1}{\rho }V \cdot \left( {\nabla \times \left( {V{\theta ^*}} \right)} \right)$, are derived. If $\nabla \times \left( {Vq} \right),\nabla \times \left( {VT} \right),\nabla \times \left( {V{\theta ^*}} \right)$ are called as moisture (flux) vorticity, thermal vorticity, and moist thermal vorticity, the vertical components of the three expansion forms of helicity above mentioned become $\frac{\omega }{\rho }\left( {k \cdot \left( {\nabla \times \left( {VT} \right)} \right)} \right),\frac{\omega }{\rho }\left( {k \cdot \left( {\nabla \times \left( {Vq} \right)} \right)} \right),\frac{\omega }{\rho }\left( {k \cdot \left( {\nabla \times \left( {V{\theta ^*}} \right)} \right)} \right)$. They are named as thermal (vertical) helicity, moisture (vertical) helicity, and moist thermal (vertical) helicity, respectively. They have clear physical meanings, indicating the upward/downward delivery status of moisture (flux) vorticity, thermal vorticity, and the moist thermal vorticity.
These expanded forms (Eqs.(4)-(6)) couple high-temperature, large-humidity, and circulation characteristics of sultry “sauna” weather in North China into the expression of helicity. For example, the interaction among several factors (sinking motion, stable subtropical high circulation in the middle troposphere, weak positive vorticity in the low troposphere) led to a strong signal of the scalar product between vertical velocity and vertical vorticity during the “sauna” episode in July 2002. Then by coupling the high temperature, large humidity, and the moist thermal effects into vertical helicity which could illustrate the circulation characteristics of “sauna” weather, the TH, MH, and MTH are introduced to analyze the “sauna” weather process, so that the useful physical parameters which could dynamically identify “sauna” weather are obtained. In next section, the introduced parameters will be used to perform case study for two “sauna” weather processes.
3 CASE STUDYA “sauna” episode broke out in North China from 30 July to 4 August 2002. Impacted by the westwardextended subtropical high, the high temperature dominated North China (Fig.1a). The southerly airflows on the northwestern edge of subtropical high transported warm and moist air from ocean to North China (Fig.1b), leading to a large humidity value in the region. An extreme value center of humidity was located at (39°N, 115°E) (Fig.1a). The middle and lower troposphere was mainly downdraft in North China (Fig.5 in the Ref.[21]). Another “sauna” weather event occurred in North China from 7 to 9 July 2009. A warm anticyclonic high occupied the upper troposphere (Fig.1d) and the hot and humid environment presented in the lower troposphere (Fig.1c). For the two above “sauna” processes, the TH, MH, and MTH will be calculated and compared with GMPV (expressed as α$\varsigma $a · ${\nabla {\theta ^*}}$, where α is the specific volume and $\varsigma $a is the absolute vorticity vector[21]) to perform case study by using the NCEP data with 1° × 1° horizontal resolution.

|
Fig.1 (a) The temperature (K) and relative humidity (shaded, %); (b) The streamline field at 925 hPa at 12 UTC 3 August 2002; (c) The temperature (K) and relative humidity (shaded, %) at 925 hPa; (d) The streamline field at 200 hPa at 06 UTC 8 July 2009 |
Figures 2 and 3 are the vertical distributions of TH, MH, MTH and GMPV during the “sauna” episode in North China from 30 July to 4 August 2002. A large-value center of TH anomaly maintained in lower troposphere (below 900 hPa) between 39°N and 42°N in North China where the “sauna” weather broke (Figs. 2a and 3a). However, the TH anomalies were also distributed in the middle and upper troposphere of other areas, such as the extreme centers of TH located at (50°N, 250 hPa) and (51°N, 700 hPa) at 06 UTC on 29 July 2002 (Fig.2a), and the center at (51°N, 300 hPa) at 12 UTC 3 August 2002 (Fig.3a). The MH anomalies mostly concentrated in Beijing and its surrounding areas in North China below 800 hPa, and maintained between 39°N and 42°N in North China (Figs. 2b and 3b). For the MTH (Figs. 2c and 3c) and GMPV (Figs. 2d and 3d) including both temperature and moisture effects, the distribution pattern of MTH is similar to that of TH. The MTH anomalies covered much larger regions than the outbreak areas of “sauna” weather. The dynamical identification of MTH for “sauna” weather in North China is worse than that of MH. The GMPV anomalies were only present below 700 hPa in the lower troposphere. At this point, it is better than the rest three variables. While the coverage of GMPV anomalies extremes was too large and located to the south of 39°N (Fig.3d). The “sauna” weather was over-predicted outside of Beijing and its surrounding areas (39°N-42°N), e.g., south of 39°N (Fig.3d). Or even missing report presented in outbreak areas of “sauna” episode in North China (Fig.2d). Fig.4 shows the horizontal distributions of TH, MH, MTH, and GMPV at 975 hPa level at 12UTC on 3 August 2002. Compared with the vertical distributions, TH, MH, and MTH in the lower troposphere are better indicative of “sauna” weather, with less rates of missing reports than GMPV. Note that the method that TH, MH and MTH are utilized to analyze “sauna” weather is different from that in previous work vertical helicity and its expanded form is used to diagnose rainfall[25]. Firstly, heavy rainfall has different circulation situations from “sauna” weather. The former has strong convection while the latter is accompanied by stable sinking motion. Therefore, positive or negative signs of vertical helicity in two kinds of weather types are determined by the configuration between vertical motion and vorticity. The interaction between vertical upward motion and cyclonic vortex in the lower troposphere near rainfall areas leads to negative vertical helicity[25]. In this study for the “sauna” case, sinking motion and weak cyclonic vortex (not shown here) are present in the middle and lower troposphere, which result in positive vertical velocity and positive vorticity, therefore positive values of vertical helicity and its expanded forms (TH, MH). Certainly, besides according to the positive or negative sign of MH (or TH, MTH), it may be more reliable to diagnose “sauna” weather by considering circulation background different from heavy rainfall (e.g., rainfall has strong convection, while “sauna” weather is often accompanied by sTable sinking airflows).

|
Fig.2 The meridional-vertical sections along 116.5°E of (a) TH (10-3Pa·m3·kg-1·s-2); (b) MH (10-8Pa·m3·kg-1·s-2); (c) MTH (10-3Pa·m3·kg-1·s-2); (d) GMPV (10-7Pa·m3·kg-1·s-2) at 06 UTC 29 July 2002 |

|
Fig.3 The same as Fig.2, but at 12 UTC 3 August 2002 |

|
Fig.4 The distributions of (a) TH (10-3Pa·m3·kg-1·s-2); (b) MH (10-8Pa·m3·kg-1·s-2); (c) MTH (10-3Pa·m3·kg-1·s-2); (d) GMPV (10-7Pa·m3·kg-1·s-2) at 975 hPa level at 12 UTC 3 August 2002 |
Look at another case for “sauna” weather in 2009. Figs. 5 and 6 are the vertical and horizontal distributions of TH, MH, MTH, and GMPV for the “sauna” episode in North China in July 2009. The large GMPV anomalies are only located below 700 hPa in the lower troposphere. At this point, GMPV is superior to TH and MTH to diagnose “sauna” weather, just similar to the case in 2002. However, the coverage of GMPV anomalies in the low level is larger than the outbreak area of “sauna” weather (Fig.5d). And the extreme value of GMPV lies to the south of 40°N. The “sauna” weather is also over-predicted south of Beijing and its surrounding area (39°N-42°N). Although there are scattered distributions of TH and MTH anomalies over the entire troposphere during the “sauna” weather episode (Figs. 5a and 5c), such as the extremes centers at (42°N, 300 hPa) and (36°N, 350 hPa), the large-value centers of TH and MTH anomalies maintain between 39°N and 43°N in North China below 800 hPa in the lower troposphere. The large MH anomaly using 2.0 as a threshold value also relatively concentrates near Beijing and its surrounding areas (39°N-43°N) below 850 hPa (Fig.5b). At 975 hPa horizontal chart (Fig.6), there are some empty forecasts of TH, MH and MTH for “sauna” weather outside Beijing and its periphery regions, while their extremes are still located near Beijing and its periphery. And their rates of empty forecasts for “sauna” weather in North China are far less than that of GMPV in lower troposphere.

|
Fig.5 The same as Fig.2, but at 06 UTC 8 July 2009 |

|
Fig.6 The same as Fig.4, but at 06 UTC 8 July 2009 |
Comparison of TH, MH, and MTH indicates that the distributions of TH and MTH are similar. Reviewing Eqs.(4)-(6), MTH has the same order of magnitude as TH. Both neglect the horizontal change term (${\nabla q}$) of moisture q. Certainly, the θ* variable in MTH expression involves moisture factor q. However, there are the relations (MTH/TH) = θ*/T , and O(θ*) = O(T) = 300 K, i.e., O(θ*)/O(T) = 1. Therefore, the magnitude order of the correction of moisture effect to temperature in θ* formula is far less than that of the temperature itself, which also leads to that the distribution of MTH is similar to that of TH. The MH includes the horizontal gradient of moisture, therefore MH has more sensitive response to the change of moisture distribution. It is clear that under generally high-temperature environments in summer, MH better reflects the sultry feature of “sauna” weather different from other high-temperature days because MH includes the horizontal change of moisture.
It can be seen that for “sauna” weather, humidity plays a decisive role under generally hot background in summer. Although its outbreak may not be necessarily during the highest-temperature period in summer, under generally hot environments human body perceives particularly sultry because of large humidity. The GMPV is a good tool to diagnose “sauna” weather, while to some extent MH especially in lower troposphere improves the empty forecast for “sauna” event in North China. Thus MH in the lower troposphere is even more effective to dynamically identify “sauna” weather in North China.
From the definition of MH, it is associated with atmospheric circulation characteristics and moisture distribution. During the “sauna” episode mentioned above, a large amount of moisture is transported along the western edge of the stable anticyclone circulation from ocean to Beijing and its surrounding areas in North China, which greatly increases the relative humidity of the target region. Also due to the sink warming under subtropical high, the air becomes hot and humid at the low level, thus MH anomalies are present in the outbreak area of “sauna” weather.
In this study, two strong “sauna” weather processes in North China in 2002 and 2009 are analyzed. And the TH, MH, and MTH parameters are tried to diagnose “sauna” weather for the two cases. Next more cases studies are performed to test and compare the validity of these parameters. The MH parameter involves both atmospheric circulation characteristics and moisture effect therefore could reflect the interaction between wind and humidity fields. Thus it has some advantage relative to the single variable such as temperature or humidity. By deriving the MH tendency equation and calculating MH tendency in the future, the occurrence and the short-term intensity trends of sultry “sauna” weather in North China can be predicted. This is our next step to be done.
4 SUMMARYAccording to temperature, humidity and circulation characteristics during “sauna” weather processes, TH, MH, and MTH are introduced to dynamically identify “sauna” weathers. Two “sauna” weather events in North China are selected to calculate above several parameters. One is from 30 July to 4 August 2002. Another lasted from 7 to 9 July 2009. And the generalized moist potential vorticity (GMPV) is used to make a comparison with them. The diagnostic analysis shows that the MH anomalies concentrate in the lower troposphere around Beijing and its peripheral areas in North China and maintain during the “sauna” weather process. However, the coverage of TH anomalies is larger than our target region of the “sauna” weather event. Even for the MTH and GMPV including both temperature and humidity effects, it is also worse to use their anomaly areas to dynamically identify “sauna” weather than using MH’s anomalies. It is clear that humidity is a determining factor during the sultry “sauna” weather process in North China in high-temperature summertime. The MH, which integrates both the atmospheric circulation characteristics and humidity effect, may be a useful factor to dynamically identify “sauna” weather in North China. And it has a great value to practical application to analysis of “sauna” weather. More cases will be selected to test the validity of MH to diagnose “sauna” weathers. By deriving the MH tendency equation and calculating MH tendency, we can better predict the occurrence and evolution of sultry “sauna” weather in North China in the future.
ACKNOWLEDGMENTSThis work was supported by the National 973 Fundamental Research Program of the Ministry of Science and Technology of China (2013CB430105), the National Natural Science Foundation of China (41105027, 41375054, 40930950), and the Opening Foundation of the State Key Laboratory of Severe Weather, Chinese Academy of Meteorological Sciences (2012LASW-B02).
| [1] Changnon S A, Kunkel K E, Reinke B C. Impacts and responses to the 1995 heat wave:a call to action. Bulletin of the American Meteorological Society, 1996, 77(7):1497-1506. |
| [2] Kovats R S, Hajat S. Heat stress and public health:a critical review. Annual Review of Public Health, 2008, 29(1):41-55. |
| [3] Semenza J C, Rubin C H, Falter K H, et al. Heat-related deaths during the July 1995 heat wave in Chicago. New England Journal of Medicine, 1996, 335(2):84-90. |
| [4] Vandentorren S, Suzan F, Medina S, et al. Mortality in 13 French cities during the August 2003 heat wave. American Journal of Public Health, 2004, 94(9):1518-1520. |
| [5] Kosatsky T. The 2003 European heat waves. Eurosurveillance, 2005, 10(7):148-149. |
| [6] Grize L, Huss A, Thommen O, et al. Heat wave 2003 and mortality in Switzerland. Swiss Medical Weekly, 2005, 135(13-14):200-205. |
| [7] Rooney C, McMichael A J, Kovats R S, et al. Excess mortality in England and Wales, and in Greater London, during the 1995 heat wave. Journal of Epidemiology and Community Health, 1998, 52(8):482-486. |
| [8] Owen P C, Robert E L. Mesoscale analysis of a heat wave in western Oregon. Journal of Applied Meteorology, 1970, 9(5):740-759. |
| [9] Wolfson N, Atlas R, Sud Y C. Numerical experiments related to the summer 1980 U. S. Heat wave. Mon. Wea. Rev., 1987, 115(7):1345-1357. |
| [10] Winston H, Bosart L F. A moisture budget analysis of the protracted heat wave in the southern Plains during the summer of 1980. Weather and Forecasting, 1987, 2(4):269-288. |
| [11] Basara J B, Basara H G, Illston B G, et al. The impact of the urban heat island during an intense heat wave in Oklahoma city. Advances in Meteorology, 2010:1-10, doi:10.1155/2010/230365. |
| [12] McNulty R P. On upper tropospheric kinematics and severe weather occurrence. Mon. Wea. Rev., 1978, 106(5):662-672. |
| [13] McNulty R P. Severe and convective weather:A central region forecasting challenge. Mon. Wea. Rev., 1995, 10(2):187-202. |
| [14] Doswell C A Ⅲ. The distinction between large-scale and mesoscale contribution to severe convection:A case study example. Wea. Forecasting, 1987, 2(1):3-16. |
| [15] Johns R H, Doswell C A Ⅲ. Severe local storms forecasting. Wea. Forecasting, 1992, 7(4):588-612. |
| [16] Doswell C A Ⅲ, Brooks H E, Maddox R A. Flash flood forecasting:An ingredients-based methodology. Wea. Forecasting, 1996, 11(4):560-581. |
| [17] Wetzel S W, Martin J E. An operational ingredients-based methodology for forecasting midlatitude winter season precipitation. Wea. Forecasting, 2001, 16(1):156-167. |
| [18] Xie Z, Cao H X. The asymmetric trend of change in maximum and minimum temperature in Beijing. Acta Meteorologica Sinica (in Chinese), 1996, 54(4):501-507. |
| [19] Zheng S H, Wang S R, Wang Y M. Impacts of climate disaster on Beijing sustainable development and relevant strategies. Acta Geographica Sinica (in Chinese), 2000, 55(S1):119-127. |
| [20] Wang Y C, Ge G Q, Tao Z Y. Climatic characteristics of estival muggy weather in Beijing related to 2008 Olympics. Meteorological Monthly (in Chinese), 2003, 29(9):23-27. |
| [21] Gao S T, Zhou Y S, Lei T, et al. Analyses of hot and humid weather in Beijing city in summer and its dynamical identification. Science in China (Series D Earth Sciences), 2005, 48(S2):128-137. |
| [22] Gao S T, Wang X R, Zhou Y S. Generation of generalized moist potential vorticity in a frictionless and moist adiabatic flow. Geophys. Res. Lett., 2004, 31(12):L12113, 1-4. |
| [23] Yang S, Gao S T. Modified Richardson number in non-uniform saturated moist flow. Chin. Phys. Lett., 2006, 23(11):3003-3006. |
| [24] Yang S, Gao S T, Wang D H. Diagnostic analyses of the ageostrophic Q vector in the non-uniformly saturated, frictionless, and moist adiabatic flow. J. Geophys. Res., 2007, 112(D9):D09114, doi:10. 1029/2006JD008142. |
| [25] Ran L K, Chu Y L. Diagnosis of vertical helicity, divergence flux and their extensions in heavy-rainfall events. Acta Physica Sinica (in Chinese), 2009, 58(11):8094-8106. |